

We Are
An increasingly popular approach to investing in asset classes is via passive portfolios with rules to tilt toward particular characteristics, known as factor investing.
Factors like quality and dividend yield can be useful in explaining portfolio risk and return, and when used as a portfolio strategy can potentially provide for superior risk adjusted returns than the market (e.g., the S&P 500) at a lower annual expense than actively managed funds tend to charge based on a research from 2013.1
In this report, we explore the investment thesis of quality high dividends that focuses on companies exhibiting a blend of both quality and high dividend yield factors.
There are some signals indicating the global economy is in the latter stages of the cycle, and in our view, quality dividend stocks could be a useful allocation for investors to re-position portfolios towards sectors and equities that may hold up better in this type of market environment.
Given this backdrop, we believe an investment product like the Global X S&P 500 Quality Dividend ETF (QDIV) may be appropriate for certain income and total return-oriented investors.
Key Takeaways
- Individual factors can provide different portfolio characteristics for investors than broad equities (such as historically high dividend yield). However, these may perform cyclically so using a combination of factors like quality and high dividend can potentially smooth a portfolio’s performance.
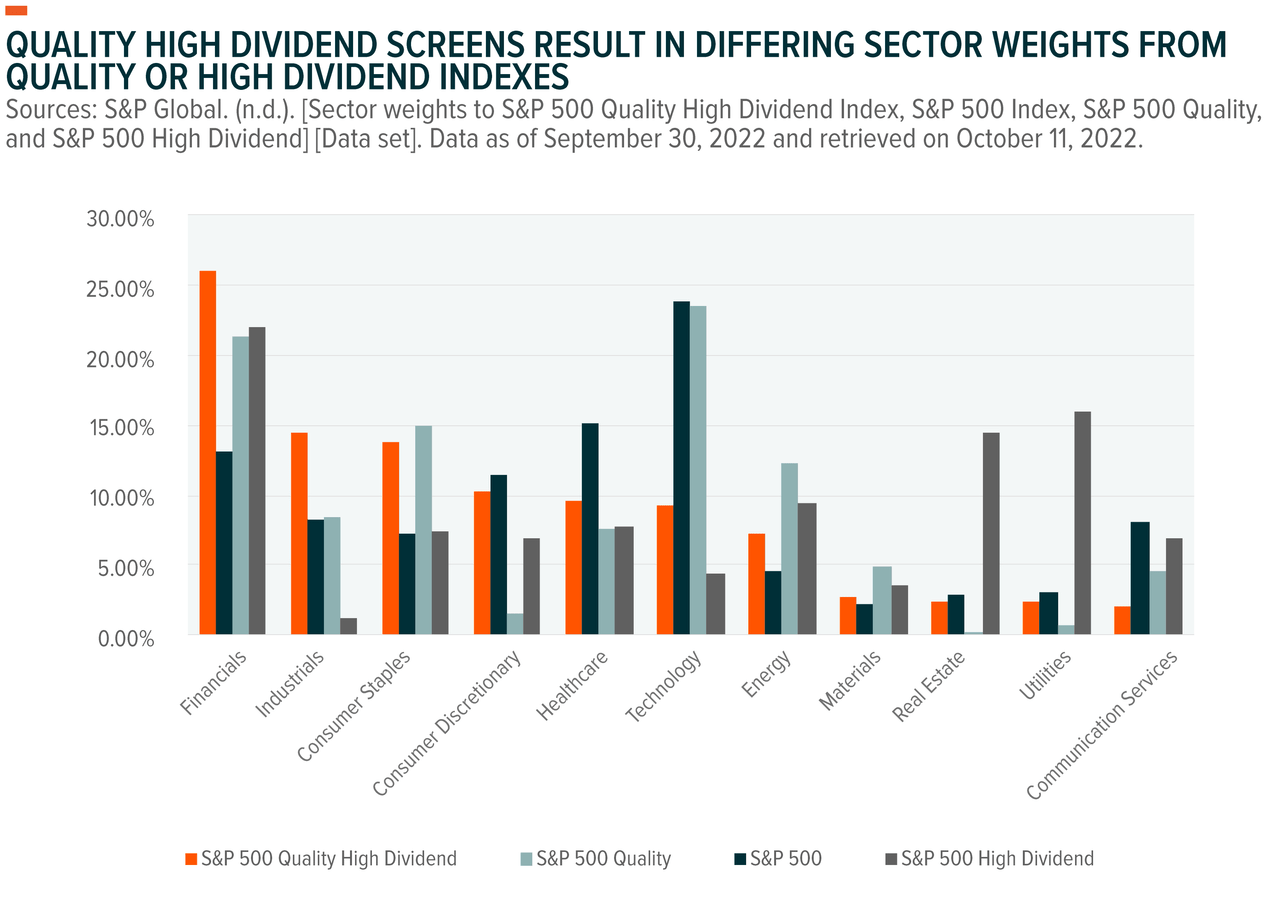
- QDIV tracks the S&P 500 Quality High Dividend Index, which is designed to measure the performance of S&P 500 members that exhibit both high quality and high dividend yield characteristics. This results in different sector weights to the S&P 500 and more value characteristics.
How QDIV Invests
Quality can encompass a wide range of measures, and dividend yield as a factor can refer to high-yielding or dividend growth, so it is important to understand the attributes of a quality dividend strategy. Here, we seek to describe the construction behind the Global X S&P 500 Quality Dividend ETF (QDIV).
As the product name implies, QDIV invests in companies from the S&P 500 which consists of the largest (by market capitalization) U.S. listed companies. The S&P 500 Quality High Dividend Index, which QDIV is designed to track, identifies the top 200 companies from the S&P 500 by indicated annual dividend yield and the top 200 companies based on a quality score. The quality score is derived from:
- Return on equity: measured by a company’s net income divided by its shareholder’s equity
- Accruals ratio: measured by changes in net operating assets over time
- Financial leverage: measured by debt to equity
The index comprises companies that fall into the top 200 of both factors (subject to a minimum of 50 stocks), and currently comprises 87 stocks.2 To reduce sector or company-specific concentrations, constituents are equal-weighted, subject to a single sector maximum weighting of 25%.
This construction results in a different sector mix to the S&P 500, but also a tilt away from the ‘mega cap’ stocks. The largest 5 stocks in the S&P 500 (Apple (AAPL), Microsoft (MSFT), Amazon (AMZN), Tesla (TSLA), Google (GOOG) (GOOGL)) comprise 21.92% of the S&P 500, none of which are currently held in QDIV.3 Additionally, the largest market cap of a QDIV holding is $0.4 trillion, compared to $2.5 trillion for the S&P 500.4
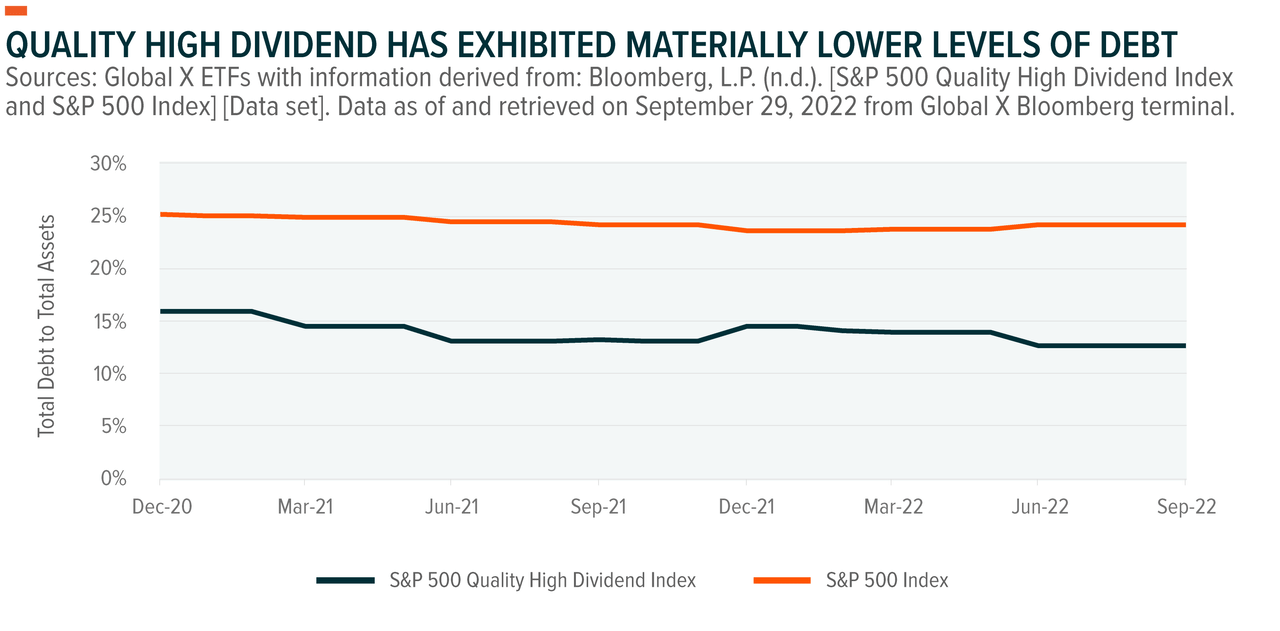
Given one of the screens applied for QDIV’s index is lower financial leverage, we would expect to see lower debt levels, however it is important to note how much lower the leverage is: QDIV’s index has averaged 47% lower debt to total assets than the S&P 500.5
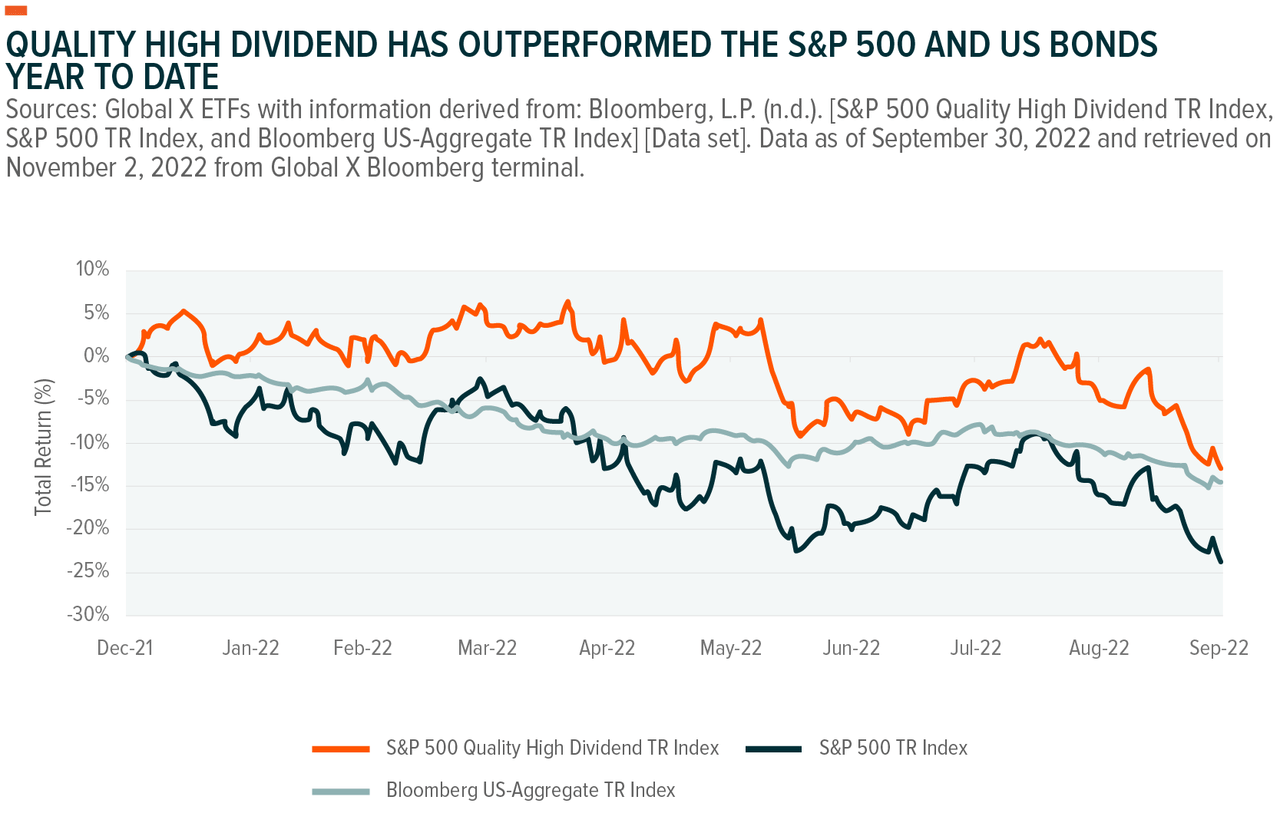
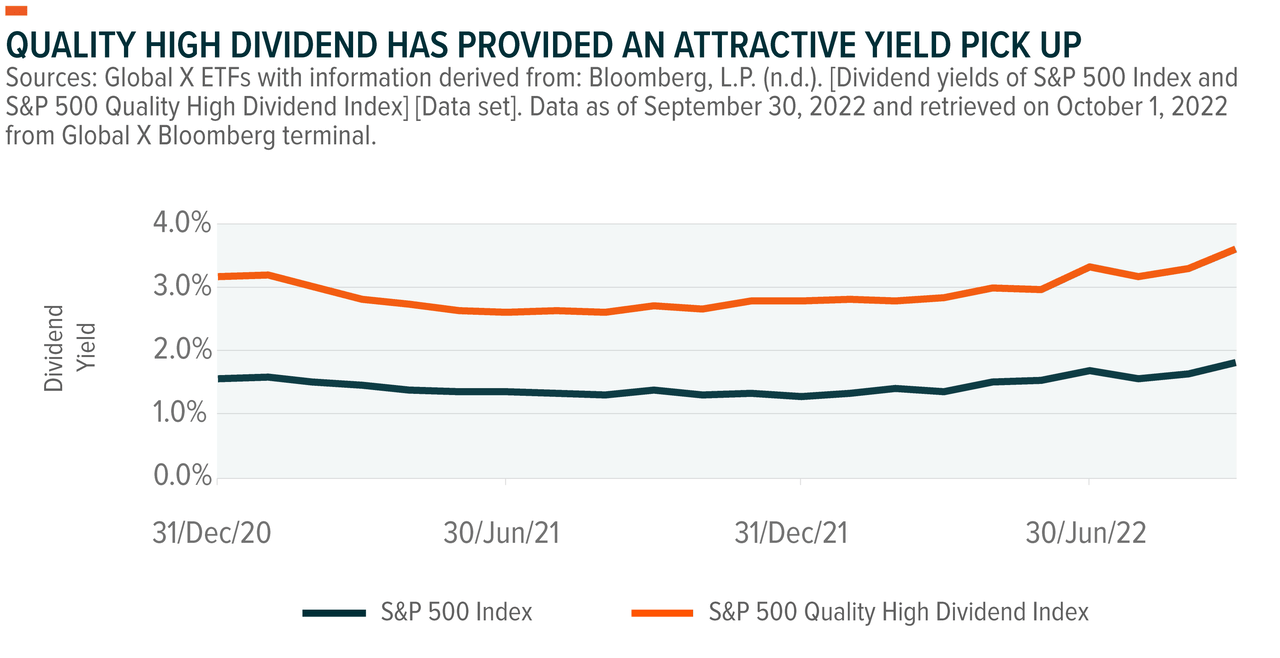
Since the index’s inception of April 23rd, 2018, the correlation to the S&P 500 is 0.908, which indicates a strong relationship between the two indexes. Despite the strong correlation, quality high dividend has materially outperformed the S&P 500 and a US bond index year to date.
Index returns are for illustrative purposes only and do not represent actual Fund performance. Index returns do not reflect any management fees, transaction costs or expenses. Indexes are unmanaged and one cannot invest directly in an index. Past performance does not guarantee future results. For QDIV performance, please click here.
Quality High Dividend Differs from Quality and High Dividend
S&P defines quality using well defined measurable characteristics based on financial variables, as this provides a quantifiable approach to portfolio construction, as opposed to one based on discretion or less consistent definitions, and has historically provided a resilient definition. The index construction methodology combines the quality characteristics tilt with a high yielding focus.
On its own, the quality tilt can lead to more expensive and lower dividend-yielding companies, while a high-yielding focus can result in more cyclically exposed companies.
For example, without a quality screen, a high dividend portfolio may have more exposure to resource companies that have high earnings and pay large dividends in certain years, but earn less and reduce dividends substantially in others.
But when combined, the result is a portfolio of companies comprising both the quality characteristics and a high-yielding focus. This blend effectively results in a third factor, differing from quality or high dividend factor portfolios.
MSCI notes that individual factors can perform cyclically depending on market conditions, and therefore using a combination of factors can potentially the smooth the performance of a portfolio.6 As the chart below shows, the sector weights by strategy are notably different.
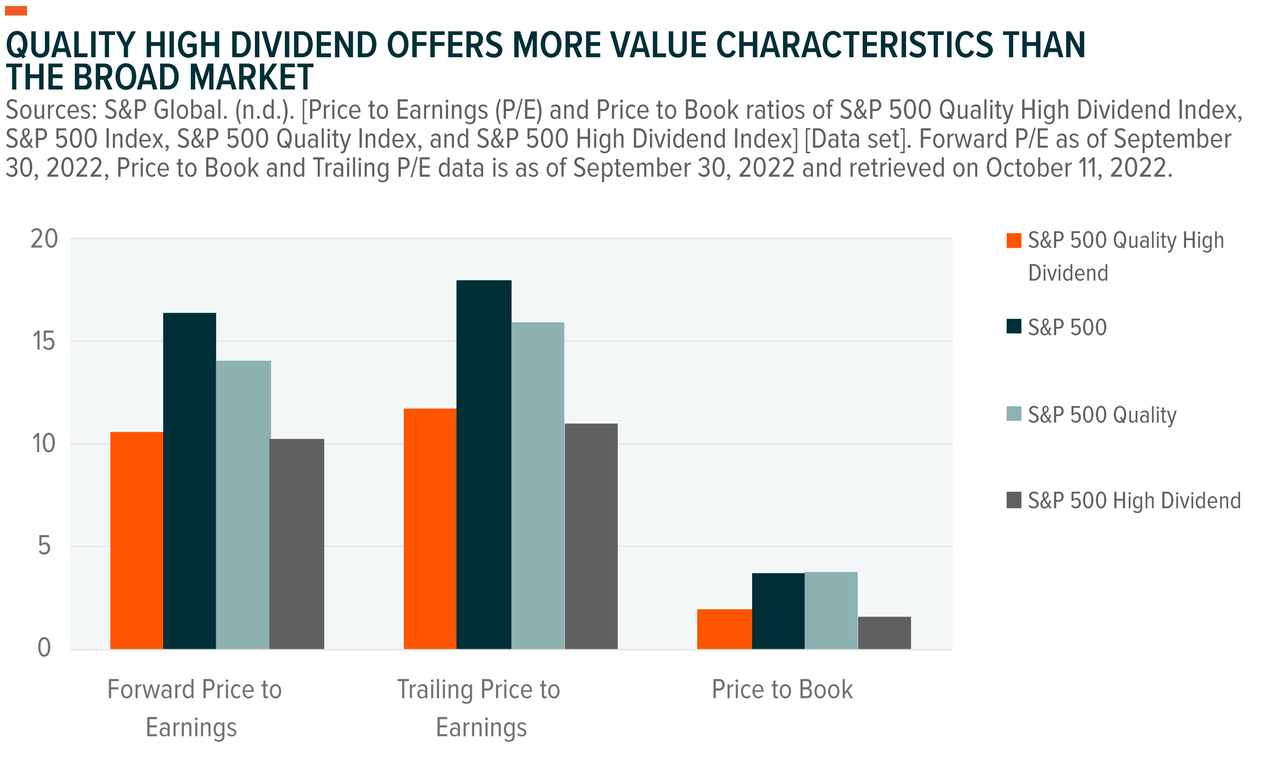
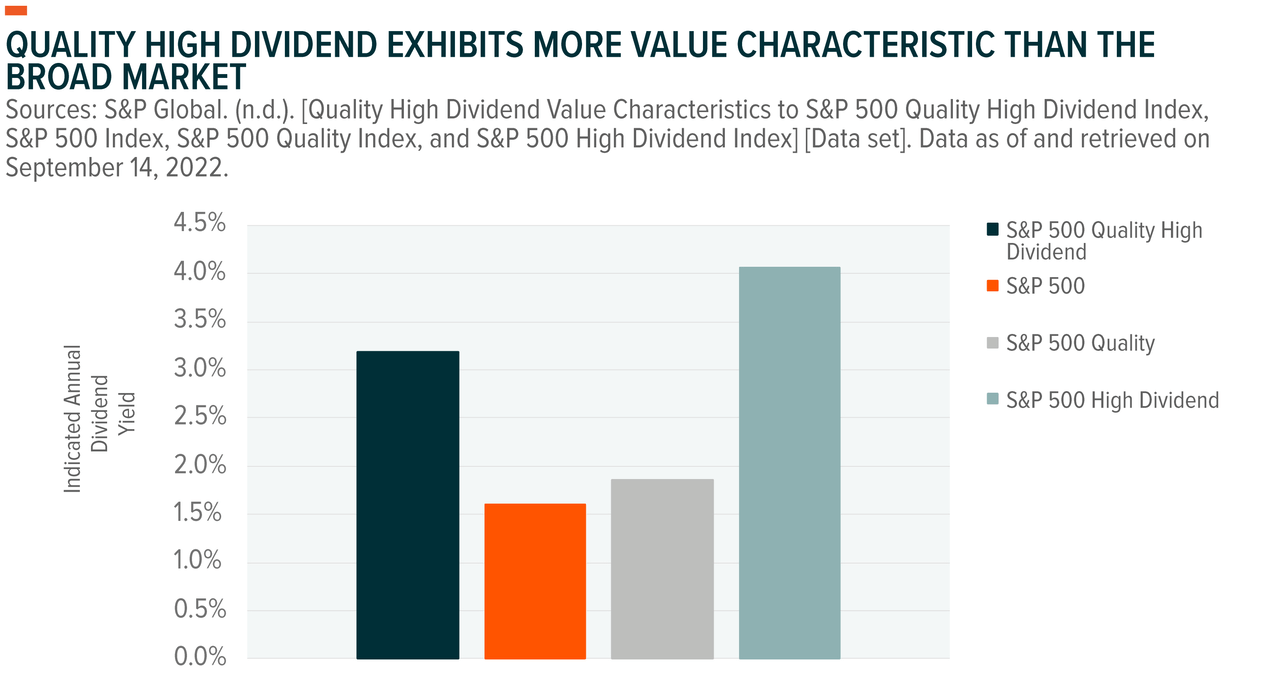
Additionally, the quality and high dividend combination can result in a tilt toward value characteristics such as lower price-to-earnings and price-to-book ratios than the broad S&P 500. Should equities de-rate, or fall to a lower earnings multiple, the value orientation may offer lower volatility relative to higher multiple portfolios due to the lower starting valuation.
Late Cycle Dynamics Can Favor Quality High Dividend Companies
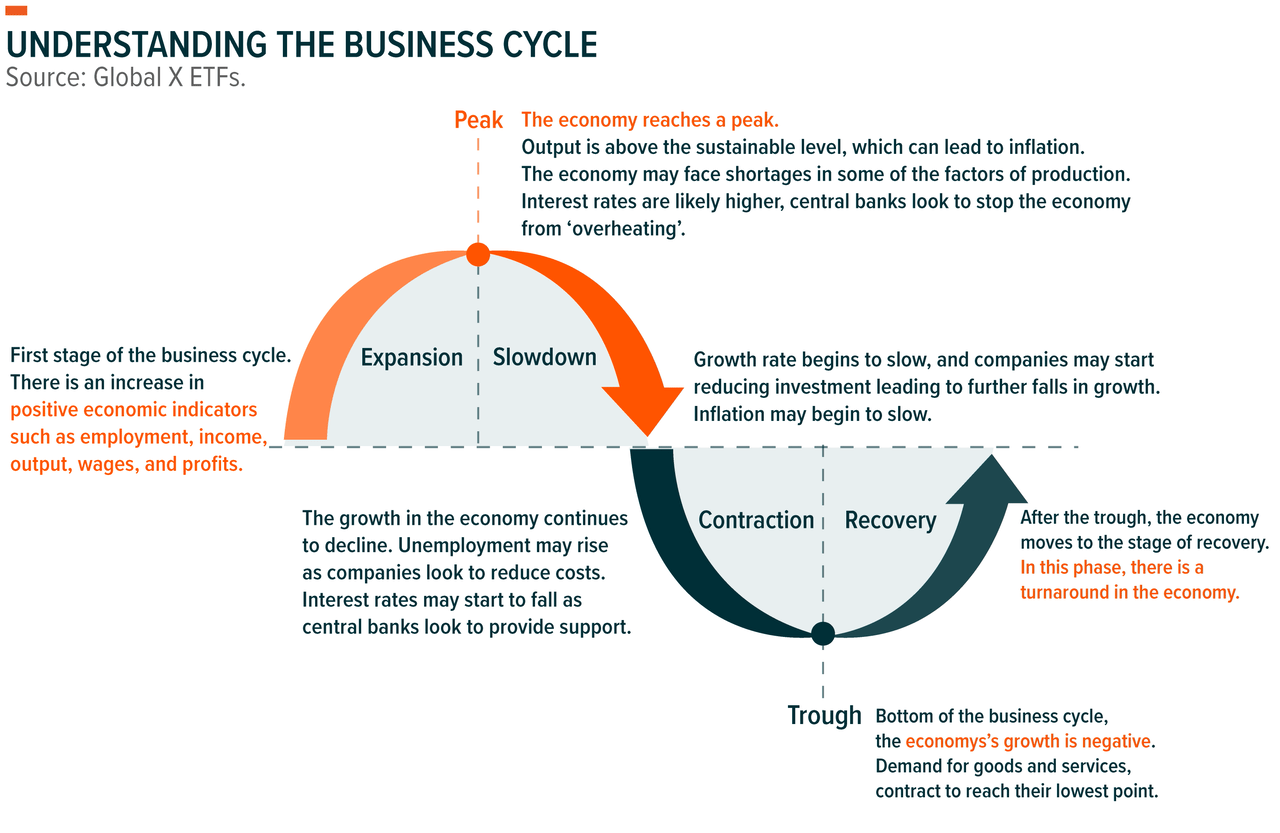
Business cycles do not always fit neatly in a box with all variables perfectly aligning to a specific stage of the cycle. However, based on the framework of key business and macroeconomic variables illustrated in the diagram below, the current period could be classified as in the later stages of the business cycle (i.e., the slowdown stage).
Inflation has been rising and is above the Federal Reserve’s (Fed) target. Interest rates have risen as a result. S&P 500 constituents’ profit margins reached a high of 13.1% in December 2021 (compared to a 20-year average of 8.1%) and may have peaked for this cycle as they have fallen to 11.76% as of 30 September. And economic growth is slowing, as measured by annualized GDP contracting in Q1 and Q2 2022.
As economic growth slows from peak levels and earnings growth subsequently follows, quality companies should be those that can maintain earnings and their financial health. By holding less debt and being profitable, these companies should be less exposed to rising interest payments and be less reliant on raising capital to continue pursuing investment opportunities.
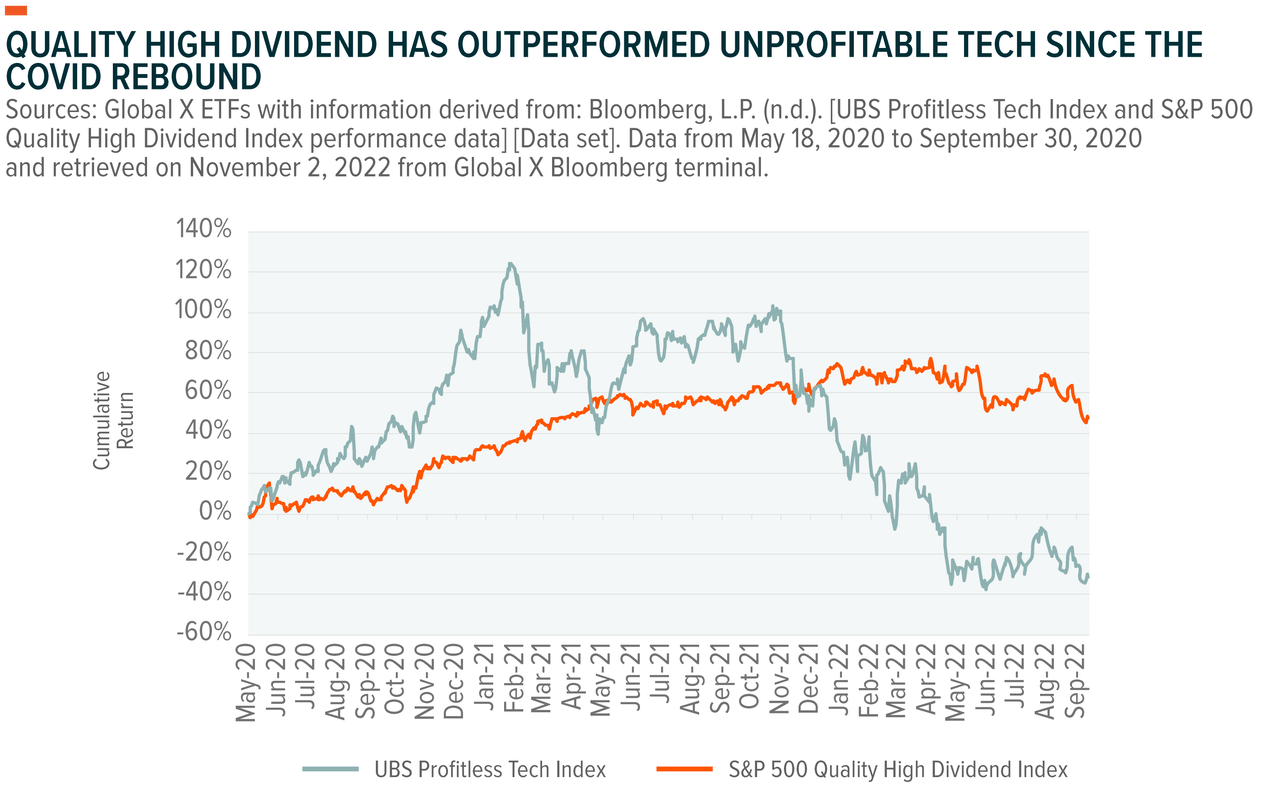
We can see an example of this in the performance of unprofitable tech companies compared to the S&P 500 Quality High Dividend Index from the COVID rebound through September 30, 2022.
Loose monetary policy measures boosted unprofitable names in 2020 and into the COVID rebound in early 2021. However, with the Fed raising interest rates significantly in 2022, quality high dividend has outperformed with investors moving toward stronger and more profitable companies.
Quality High Dividend Strategies May Offer a Degree of Downside Protection
Late cycle periods may feature stretches of flat returns or volatile returns as investor sentiment shifts. Historical performance data for quality high dividend against the broader S&P 500 is limited, but it can provide insight into when quality high dividend may outperform and to what extent.
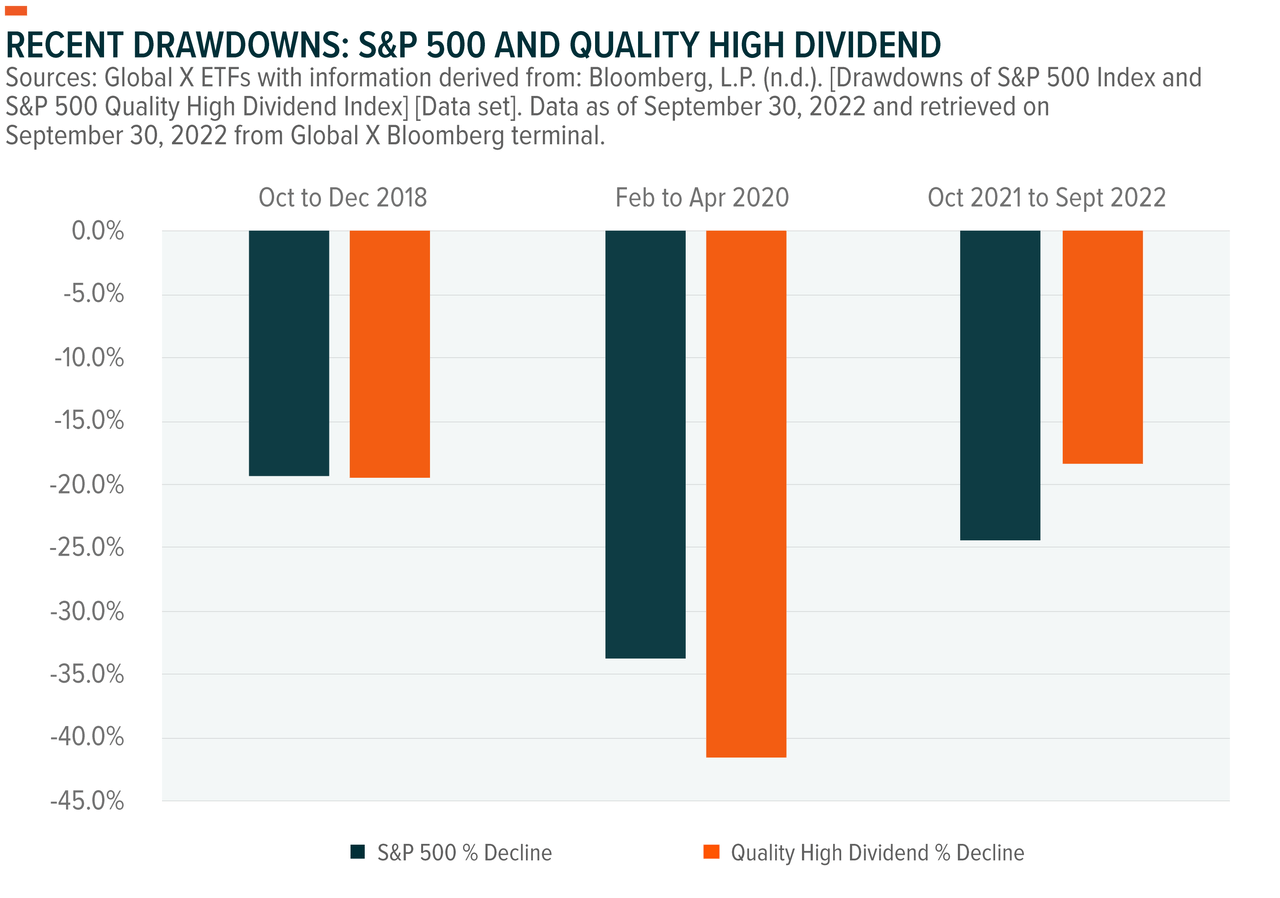
The chart below shows drawdowns from peak to trough, with the S&P 500 outperforming in the COVID selloff in 2020 and quality high dividend outperforming in the drawn-out selloff that began in late 2021.
A higher dividend yield may also improve relative performance during extended periods of flat or negative returns due to the relatively consistent positive nature of dividends, as total return is derived from the price return plus the dividends received during that period.
In rising interest rate periods, investors may deemphasize fixed income investments due to the direct negative impact of rising rates on fixed income prices and seek higher income-paying equities to fulfill income objectives.
In general, companies must make payments on debt that they issue, such as bond coupons. However, companies can reduce or delay the dividends that they pay without triggering a default.
This tactic can be useful in times of financial stress, but it affects the income that investors receive. Quality companies with more consistent earnings and stronger balance sheets may be better able to maintain dividend payments during these periods, but there is no guarantee they will do so.
Conclusion: A Potentially Attractive Combination for the Late Cycle
The use of factors as an investing strategy, and specifically via ETFs, is expected to increase, likely helped by this rising rate, high inflation environment which has led to negative returns from many equity indexes.7
Additionally, many investors have become somewhat concerned with the level of concentration from a handful of very large companies in equity indexes, according to Global X’s American Consumers and Macroeconomic Monetary Views Survey.8 Using the Global X S&P 500 Quality Dividend ETF should alleviate these concerns, as the ETF uses an equal weighted portfolio construction.
Many investors are searching for investments that can perform in this later stage of the business cycle. And in our view, a quality high dividend strategy can offer a diversified portfolio of potentially higher yielding and more financially resilient companies. But it can also perform relatively better than the broader market in late cycle periods, potentially making it a tactical medium-term play for certain investors.
Related ETFs
QDIV: The Global X S&P 500 Quality Dividend ETF invests in U.S. equity securities included in the S&P 500 Index that rank within the top 200 of the index’s universe by both quality score and dividend yield.
Click the fund name above to view the fund’s current holdings. Holdings subject to change. Current and future holdings subject to risk.
Footnotes1. Bender, J., Briand, R., Melas, D., & Subramanian, R. A. (2013, December). Foundations of factor investing. MSCI.2. Global X ETFs, data as of September 30, 2022.3. Bloomberg, L.P. (n.d.). [S&P 500 Index] [Data set]. Data as of September 30, 2022 and retrieved on November 2, 2022 from Global X Bloomberg terminal.4. Bloomberg, L.P. (n.d.). [Apple for the S&P 500; Johnson and Johnson for QDIV] [Data set]. Data as of September 30, 2022 and retrieved on October 11, 2022 from Global X Bloomberg terminal. As of 9/30/2022, John and Johnson represented 1.20% of QDIV.5. Bloomberg, L.P. (n.d.). [Total Debt to Total Assets measured as a percentage with data points monthly from December 31, 2020 (earliest available through Bloomberg) to September 30, 2022] [Data set]. Data retrieved on November 2, 2022 from Global X Bloomberg terminal.6. Bender, J., Briand, R., Melas, D., & Subramanian, R. A. (2013, December). Foundations of factor investing. MSCI.7. Axthelm, M., & Haghbin, M. (2021). Invesco global factor investing study. Invesco. Country Splash8. De, M. (2022, July 28). Global X ETFs survey: American consumers and macroeconomic monetary views. Global X. GLOSSARYIndicated Annual Dividend Yield: A forward looking measure that is calculated by multiplying the most recent dividend by the number of dividends issued each year and then divided by the current share price. Correlation: A measure that shows how two securities move in relation to each other. A correlation of 1 implies that the securities will exhibit the same price movements. A correlation of 0 means the securities demonstrate completely unrelated price movements. A negative 1 correlation implies that the securities move in same size and opposite directions from one another. Dividend Yield: A financial ratio that shows the percentage of company’s share price that it pays out in dividends each year. UBS Profitless Tech Index: The UBS Profitless Tech Basket tracks the performance of emerging high growth tech and tech-enabled companies which have yet to compete a full-year with positive earnings. The basket has been optimized for liquidity with initial weights capped at 4%, created on May 18, 2020. This material represents an assessment of the market environment at a specific point in time and is not intended to be a forecast of future events, or a guarantee of future results. This information should not be relied upon by the reader as research or investment advice regarding the fund or any stock in particular. Holdings are subject to change. Investing involves risk, including the possible loss of principal. There is no guarantee dividends will be paid. Companies may reduce or eliminate dividends at any time. Diversifying your portfolio does not ensure a profit or guarantee against a loss. Shares of ETFs are bought and sold at market price (not NAV) and are not individually redeemed from the Fund. Brokerage commissions will reduce returns. Carefully consider the funds’ investment objectives, risks, and charges and expenses before investing. This and other information can be found in the funds’ full or summary prospectuses, which may be obtained at globalxetfs.com. Please read the prospectus carefully before investing. Global X Management Company LLC serves as an advisor to Global X Funds. The Funds are distributed by SEI Investments Distribution Co. (SIDCO), which is not affiliated with Global X Management Company LLC or Mirae Asset Global Investments. Global X Funds are not sponsored, endorsed, issued, sold or promoted by Standard & Poors, nor does Standard & Poors make any representations regarding the advisability of investing in the Global X Funds. Neither SIDCO, Global X nor Mirae Asset Global Investments are affiliated with Standard & Poors. |
Editor’s Note: The summary bullets for this article were chosen by Seeking Alpha editors.
Be the first to comment