

JHVEPhoto
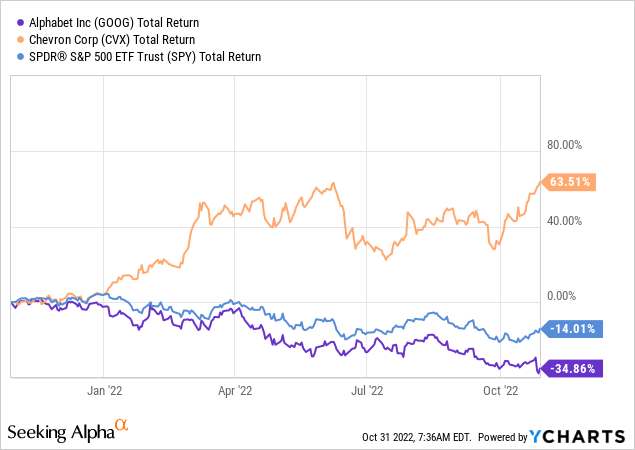
The 2022 bear-market has obviously taken a huge bite out of big-tech stocks. Google (NASDAQ:GOOG) (NASDAQ:GOOGL) is certainly no exception. Current market sentiment is lousy on practically all things technology related, while the exact opposite is true in the energy sector (see graphic below), which can seemingly do no wrong. That being the case, many investors might be surprised that Google, despite a supposed “miss” in Q3, actually generated $16.077 billion in free-cash-flow. Meantime, Chevron (CVX), the second largest U.S. based energy company, generated near record results and $12.3 billion in free-cash-flow – or $3.777 billion less FCF than Google. My point isn’t to denigrate Chevron – indeed, my followers know it has been my favorite international integrated major for years, and I own the stock – but just to point out that it is no time for investors to give up on technology, and certainly not Google.
Yes, I obviously know these are two totally different companies with two totally different businesses, but with the non-stop performance comparison of technology and energy stocks’ performance this year, I thought it would be interesting to directly compare the financial results of one of the best companies in each sector.
Earnings Comparison
First Google:
Alphabet’s (it will always be Google to me…) Q3 earnings report was considered a miss on both the top- and bottom lines. Total revenue of $69.09 billion was up only 6% yoy, partly due to strong foreign currency headwinds in which revenue would otherwise have been up 11%. Net income fell to $13.9 billion ($1.06/share) from a year-ago $18.94 billion ($1.40/share). Segment results are shown below:
Alphabet
The market seemed to focus on growth in headcount, which jumped to 186,779 employees from a year-ago 150,028. And the market should focus on the issue, after all GOOG’s operating expenses were $20.8 billion, up 26% yoy, primarily due to R&D and G&A expenses – which were driven in large part by growth in headcount. It is notable that 2,600 employees of the 12,765 new employees were added to the Google Cloud segment as part the Mandiant acquisition. Still, that leaves 10,000+ new employees during Q3 and – given the current environment – the market didn’t like that at all and the stock sold-off.
Indeed, GOOG’s operating margin declined from 32% a year ago to 25%, and while decelerating revenue certainly played a role, the 24% yoy increase in head-count was certainly a big drag on results.
That’s the bad news. The good news was that Google Cloud continued to post strong momentum with revenue of $6.9 billion (up 37.6% yoy). On the Q3 conference call, we learned that GC expanded relationships with Toyota, Prudential, Coinbase and AppLovin. Google Search revenue was not spectacular but it was solid ($39.5 billion, +4.3% yoy) and FX hedging gains were a very healthy $638 million, helping to mitigate the negative impact of the strong U.S. dollar.
GOOG ended Q3 with $116.26 billion of cash & cash equivalents, or an estimated $8.88/share in cash.
What might have been lost in the conversation was that Google was still able to generate $16.077 billion in free-cash-flow. That equates to 23.3% of total revenue and an estimated $1.23/share.
In the long-run, in addition to the obvious operating leverage in Search, GOOG has excellent upside potential in ML/AI (i.e. TensorFlow) and its Waymo autonomous driving unit. Note Intel (INTC) recently went public with a Mobileye share offering which was received very well by the market and achieved a valuation of nearly $17 billion.
Now Chevron:
In comparison in Q3, Chevron reported near record Q3 earnings that were a strong beat on both the top- and bottom lines. Revenue of $66.64 billion was up 49.0% yoy, while EPS came in at $5.78/share as compared to $3.19/share last year. Since most global oil & gas is traded in U.S. dollars, Chevron actually had a $624 million FX tailwind during Q3.
During Q3, Chevron generated $12.3 billion in free-cash-flow. That equates to 18.5% of total revenue ($66.6 billion) and an estimated $6.34/share.
To summarize:
| Q3 Results: | Revenue | FCF | % FCF/Revenue | FCF/share |
| $69.1 billion | $16.077 billion | 23.3% | $1.23 | |
| Chevron | $66.6 billion | $12.3 billion | 18.5% | $6.34 |
My first observation is that both of these companies are, obviously, very strong and profitable enterprises. And while the two companies’ revenue was fairly similar, Google’s margin – despite the relatively high oil & gas prices during the quarter that benefitted Chevron, and the fact that GOOG had FX headwinds while CVX had FX tailwinds – was still higher than Chevron’s. On a FCF per share basis, Chevron benefits from having a much lower average fully-diluted outstanding share count as compared to Google (1.94 billion versus 13.10 billion, respectively).
Shareholder Returns
Of course, the big difference between the two companies in terms of shareholder returns is that Google pays no dividend at all while Chevron pays a very healthy $5.68/share dividend (+6% yoy), which is good enough for a 3.2% yield.
On the other hand, Google spent $15.392 billion on share buybacks during the quarter, reducing its average number of full-diluted shares from 13.530 billion in Q3 of last year to 13.097 billion, or by 3.2%. GOOG had previously announced a $70 billion buyback plan in April.
Chevron spent $3.75 billion on share buybacks during Q3, which equated to ~1% of total shares.
In the current macro-economic environment, the market is obviously rewarding the excellent dividend income Chevron is providing for shareholders as opposed to Google’s massive over-emphasis on share buybacks.
Valuation
The following table summarizes the current valuation given each company by the market:
| Valuation Metric | TTM P/E | FWD P/E | Market-Cap |
| 18.8x | 20.0x | $1.25 trillion | |
| Chevron | 12.0x | 9.6x | $353.3 billion |
Obviously, the market is valuing Chevron at a far lower valuation level as compared to Google. That likely has much to do with the fact that Chevron operates in a very cyclical commodity market where full-cycle returns are not nearly as good as what was demonstrated in Q3 (a near record quarter), while Google has demonstrated a business model that is much more stable (and growing) throughout the economic cycles. In addition, while both companies face regulatory hurdles, Chevron is likely awarded a lower valuation given the global ESG headwinds and the transition to EVs and renewables and away from fossil fuels (or at least the desire to do so).
In addition, Chevron – being an oil & gas producer – has a relatively narrow moat with lots of competitors – both foreign (i.e. OPEC) and domestic. Google, on the other hand, dominates the global search market (with an 80%+ market share) while its Android operating system dominates the global smartphone market (70%+ market share) and brings new customers into its ecosystem as advertising & search continues to migrate from desktop to mobile. This strong moat differentiation between the two companies likely feeds into the valuation narrative as to the market gives GOOG such a much higher valuation as compared to Chevron (among other reasons).
Meantime, the dramatic sell-off in big-tech this year may well be a great opportunity for investors to gain exposure to the group at far more attractive entry points. At least one investment firm, Alliance Bernstein, agrees with me.
Summary & Conclusion
Despite a near all-time record Q3 for Chevron, and a “miss” by Google, GOOG still generated $3.7 billion more free-cash-flow than did CVX with significantly higher margin. Meantime, Google trades at a discount to the overall S&P500 (TTM P/E=20.3x) and is buying back a ton of stock. Chevron, on the other hand, is returning its free-cash-flow to shareholders via a strong dividend. However, note that CVX’s $5.68/share annual dividend obligation pales in comparison with the $6.34/share in FCF the company generated in Q3 alone. That being the case, Chevron’s management is significantly ramping-up its share buyback program going forward. That is something shareholders should be wary of, in my opinion. I say that considering that large O&G companies have a long history of over-emphasizing share buybacks during commodity price up-cycles (when share prices are high), versus down-cycles when buybacks are typically suspended and the share prices actually represent excellent value.
So we have two totally different stocks in two totally different industries, but both of which generate very strong free-cash-flow for their shareholders. I like both companies and own them both. However, currently Google appears to be the better buy in my opinion because the company delivers throughout market cycles, and because I think the company can very easily boost results going forward by simply slowing employee growth. Indeed, on the Q3 conference call referenced earlier, Google CFO Ruth Porat said:
In the fourth quarter, we expect headcount additions will slow to less than half the number added in Q3. Within this slower headcount growth, next year, we will continue hiring for critical roles, particularly focused on top engineering and technical talent.
That being the case, and all else being equal, GOOG’s operating expenses should improve dramatically as compared to Q3, and GOOG’s margin should start creeping back up.
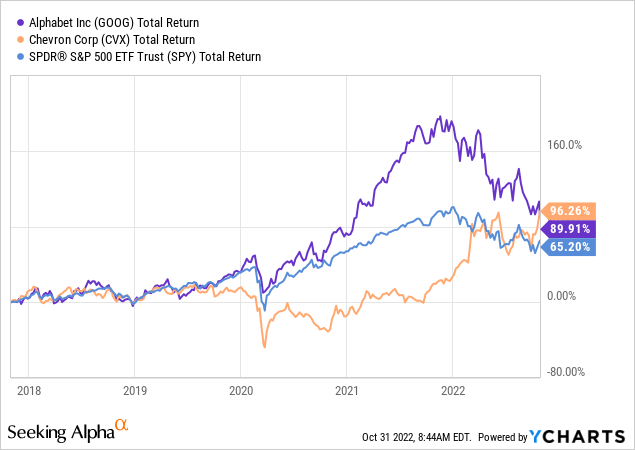
I’ll end with a 5-year total return chart comparing Google to Chevron and to the S&P500 as represented by the (SPY) ETF, and note that Chevron has just recently eclipsed Google in total returns, while both companies have significantly out-performed the broad S&P500:
Be the first to comment