

Guido Mieth/DigitalVision via Getty Images
At the beginning of the second quarter of 2022, the Basic Materials, Consumer Non-cyclicals, and Financials sectors earn an Attractive-or-better rating. Our sector ratings are based on the normalized aggregation of our stock ratings for every stock in each sector. Our stock ratings are based on five criteria that assess a firm’s business strength and valuation.
Investors looking for sector funds that hold quality stocks should look no further than the Basic Materials, Consumer Non-cyclicals, and Financials sectors. These sectors include some of the highest rated funds. Figures 4 through 7 provide more details. The primary driver behind an Attractive fund rating is good portfolio management, or good stock picking, with low total annual costs.
Attractive-or-better ratings do not always correlate with Attractive-or-better total annual costs. This fact underscores that (1) cheap funds can dupe investors and (2) investors should invest only in funds with good stocks and low fees.
See Figures 4 through 13 for a detailed breakdown of ratings distributions by sector.
Figure 1: Ratings for All Sectors
Sector Ratings 2Q22 (New Constructs, LLC)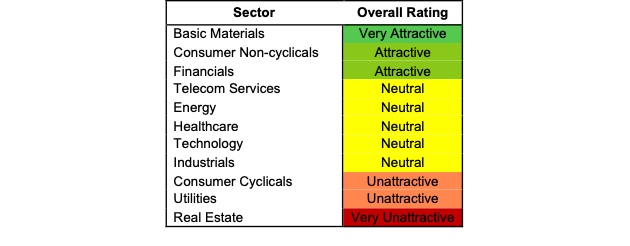
To earn an Attractive-or-better Predictive Rating, an ETF or mutual fund must have high-quality holdings and low costs. Only the top 30% of all ETFs and mutual funds earn our Attractive-or-better ratings.
VanEck Steel ETF (SLX) is the top-rated Basic Materials fund. It gets our Very Attractive rating by allocating over 80% of its value to Attractive-or-better-rated stocks.
Dunham Real Estate Stock Fund (DAREX) is the worst rated Real Estate fund. It gets our Very Unattractive rating by allocating over 73% of its value to Unattractive-or-worse-rated stocks. Getting low-quality stocks does not come cheap either as the fund charges investors annual costs of 4.17%.
Figure 2 shows the distribution of our Predictive Ratings for all sector ETFs and mutual funds.
Figure 2: Distribution of ETFs & Mutual Funds (Assets and Count) by Predictive Rating
Sector Ratings 2Q22 Stats (New Constructs, LLC)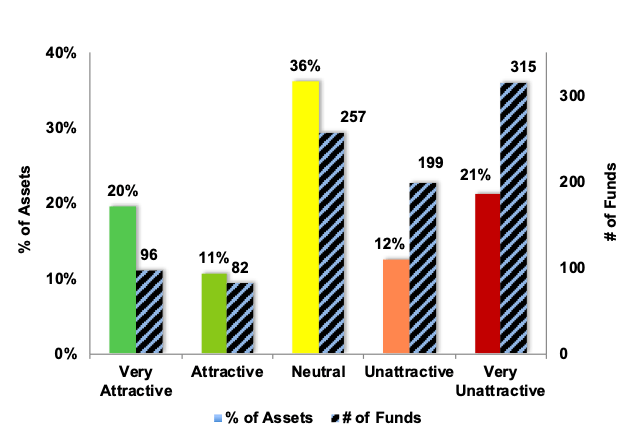
Figure 3 offers additional details on the quality of the sector funds. Note that the average total annual cost of Very Unattractive funds is almost six times that of Very Attractive funds.
Figure 3: Predictive Rating Distribution Stats
Sector Ratings 2Q22 Distribution Stats (New Constructs, LLC)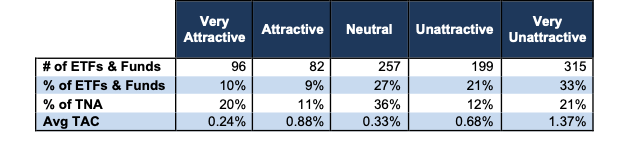
* Avg TAC = Weighted Average Total Annual Costs
This table shows that only the best of the best funds get our Very Attractive Rating: they must hold good stocks AND have low costs. Investors deserve to have the best of both and we are here to give it to them.
Ratings by Sector
Figure 4 presents a mapping of Very Attractive funds by sector. The chart shows the number of Very Attractive funds in each sector and the percentage of assets in each sector allocated Very Attractive-rated funds.
Figure 4: Very Attractive ETFs & Mutual Funds by Sector
Very Attractive Sector Ratings 2Q22 (New Constructs, LLC)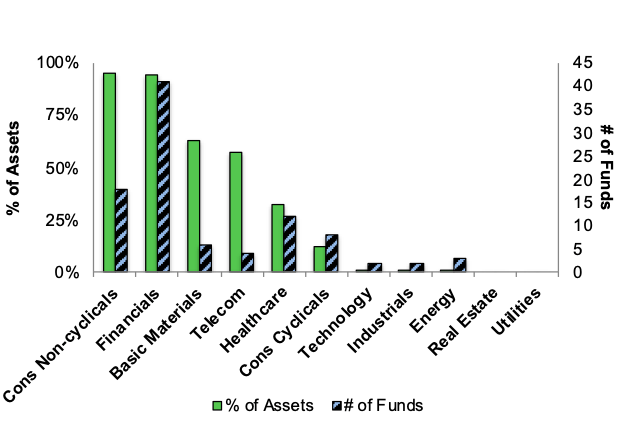
Figure 5 presents the data charted in Figure 4.
Figure 5: Very Attractive ETFs & Mutual Funds by Sector
Very Attractive Sector Ratings Stats 2Q22 (New Constructs, LLC)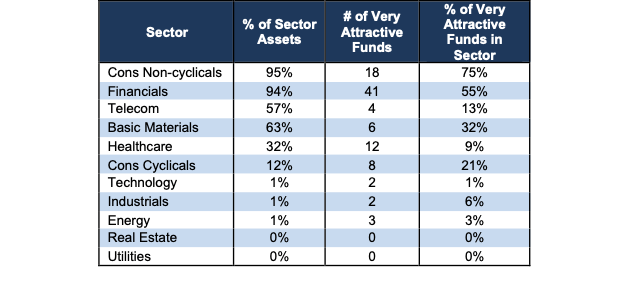
Figure 6 presents a mapping of Attractive funds by sector. The chart shows the number of Attractive funds in each sector and the percentage of assets in each sector allocated to Attractive-rated funds.
Figure 6: Attractive ETFs & Mutual Funds by Sector
Attractive Sector Ratings 2Q22 (New Constructs, LLC)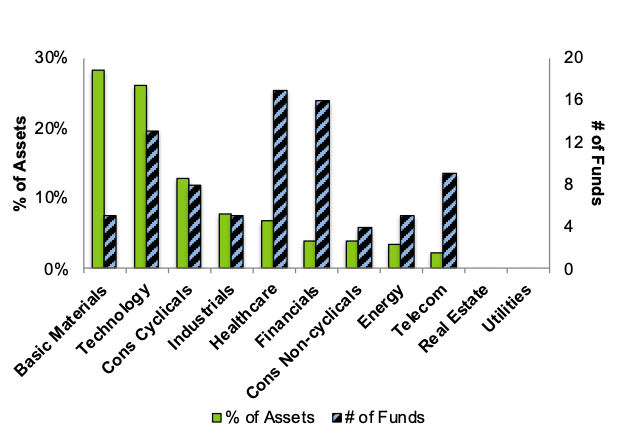
Figure 7 presents the data charted in Figure 6.
Figure 7: Attractive ETFs & Mutual Funds by Sector
Attractive Sector Ratings Stats 2Q22 (New Constructs, LLC)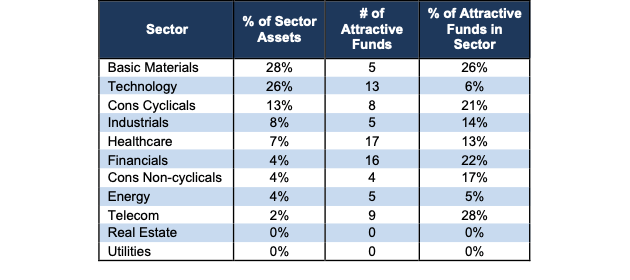
Figure 8 presents a mapping of Neutral funds by sector. The chart shows the number of Neutral funds in each sector and the percentage of assets in each sector allocated to Neutral-rated funds.
Figure 8: Neutral ETFs & Mutual Funds by Sector
Neutral Sector Ratings 2Q22 (New Constructs, LLC)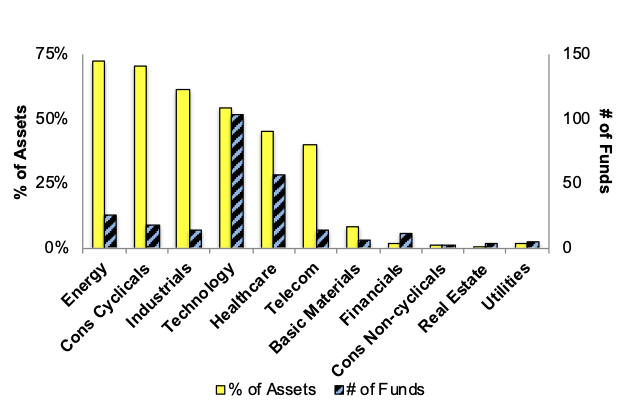
Figure 9 presents the data charted in Figure 8.
Figure 9: Neutral ETFs & Mutual Funds by Sector
Neutral Sector Ratings Stats 2Q22 (New Constructs, LLC)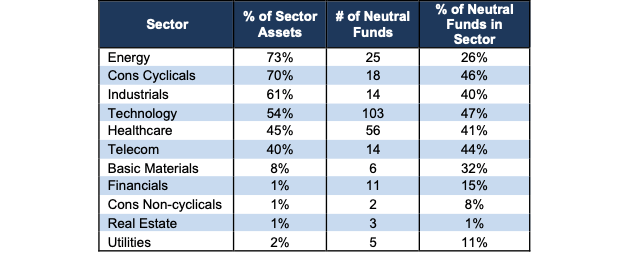
Figure 10 presents a mapping of Unattractive funds by sector. The chart shows the number of Unattractive funds in each sector and the percentage of assets in each sector allocated to Unattractive-rated funds.
The landscape of sector ETFs and mutual funds is littered with Unattractive funds. Investors in Utilities have put over 84% of their assets in Unattractive-rated funds.
Figure 10: Unattractive ETFs & Mutual Funds by Sector
Unattractive Sector Ratings 2Q22 (New Constructs, LLC)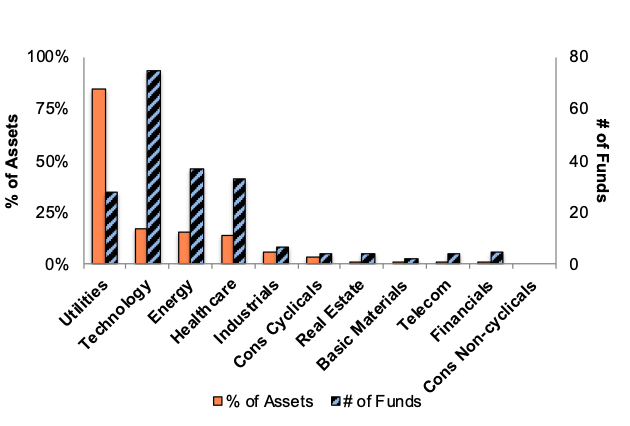
Figure 11 presents the data charted in Figure 10.
Figure 11: Unattractive ETFs & Mutual Funds by Sector
Unattractive Sector Ratings Stats 2Q22 (New Constructs, LLC)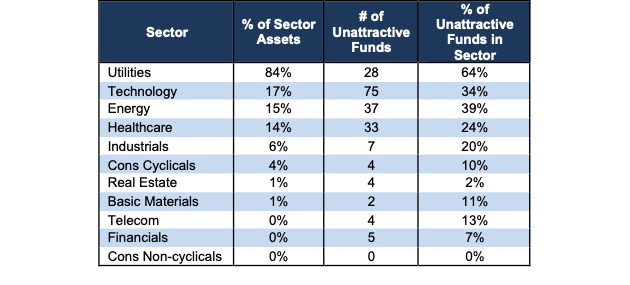
Figure 12 presents a mapping of Very Unattractive funds by sector. The chart shows the number of Very Unattractive funds in each sector and the percentage of assets in each sector allocated to Very Unattractive-rated funds.
Figure 12: Very Unattractive ETFs & Mutual Funds by Sector
Very Unattractive Sector Ratings 2Q22 (New Constructs, LLC)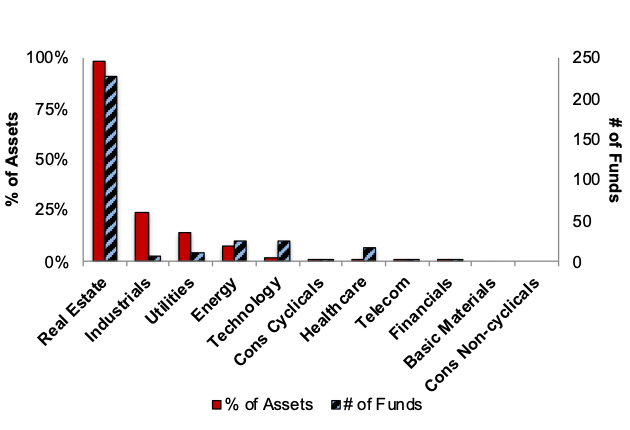
Figure 13 presents the data charted in Figure 12.
Figure 13: Very Unattractive ETFs & Mutual Funds by Sector
Very Unattractive Sector Ratings Stats 2Q22 (New Constructs, LLC)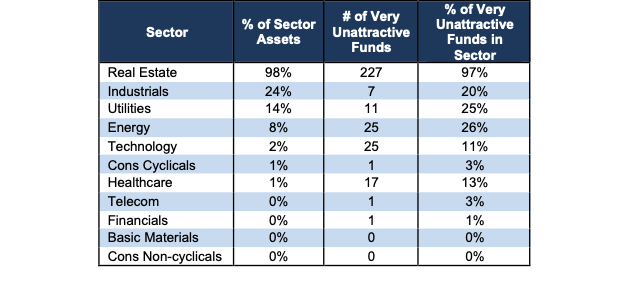
Be the first to comment