


TERADAT SANTIVIVUT
Investment Summary
After catching a strong bid in November Pulmonx Corporation (NASDAQ:LUNG) has repriced >112% off its 52-week lows. We now seek to examine the price action and make a practical assessment of its potential to extend further. Before proceeding to the analysis, we should recall LUNG endured a violent selloff over the 2+ years since listing, rating from highs of ~$70 to its FY22′ lows. Hence, it has a ways to go before reclaiming this downside.
Two major catalysts look to have underpinned the price evolution over this time:
- The Japanese approval of its Zephyr endobronchial valve to treat patients with severe chronic obstructive pulmonary disease (“COPD”) and emphysema.
- Accumulation of shares from Point72 Asset Management to a ~1.96mm ticket on their book.
Extensive review of the firm’s Zephyr valve can be found via additional analysis from Seeking Alpha co-authors on the stock’s quote page. Subsequently, I’ll present our observations and recommendations for positioning looking ahead. Net-net, we suggest LUNG is a hold until a break above $9.40 to signal a continuation of the uptrend.
LUNG advanced technical analysis
The catalysts mentioned above resulted in a large thrust where traders captured tremendous upside into the new year. Momentum has stalled somewhat and the question immediately turns to whether the rally can extend or not. After backing and filling into congestion since January it has since finished each session with a series of tight closes and there’s no real indication on which side has it for now.
Exhibit 1. LUNG repricing off 52-week lows [daily bars, log scale]

Data: Updata
Long-term buyers were present in the rally with the on-balance volume surging along with the price change, yet has curled over in recent sessions. Another uptick in the OBV would indicate longer-term buyers.
Exhibit 2. OBV shifting higher in tandem with price change

Data: Updata
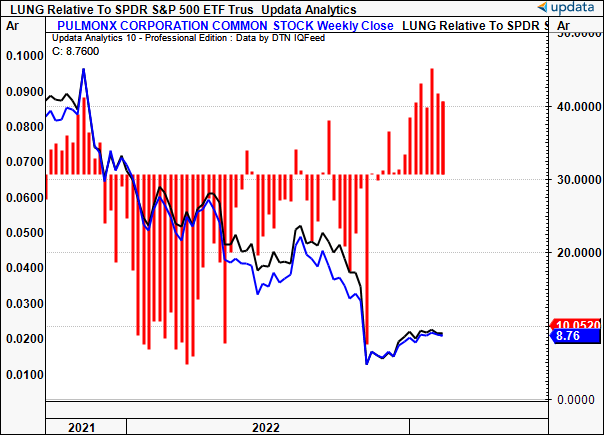
Supporting the upside, weekly inflows into LUNG equity has curled up off a period of substantial outflows. Part of the uptick is likely related to the Point72 accumulation and coincided with the reversal off lows in November. It hasn’t been enough to see the stock run up the page at a rate of change matching the downside, however. Moreover, inflows have softened in the last 2 weeks.
Exhibit 3. Weekly money flows into/out of LUNG equity
Data: Updata
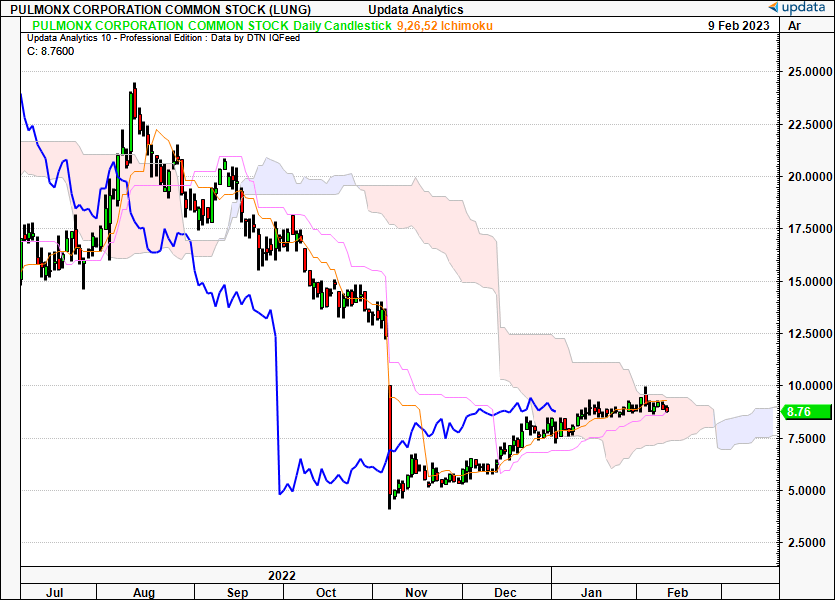
To answer the question posed above, we examined where we sit in the trend. Indeed, this requires a multiple timeframe analysis, looking to the weeks and months ahead. Examining the cloud charts on these time frames, the following observations can be made [first, with the daily chart]:
- LUNG crossed the cloud base in January with the lagging line in close pursuit, but it hasn’t crossed the cloud top. Moreover, the lagging line is firmly within the cloud and curling back over.
- The cloud itself crossed to the upside and we look to support at $8.90 by March.
- There’s not enough overwhelming evidence to indicate the trend is overly bullish at this point.
Exhibit 4. Neutral into the cloud, lagging line testing the base
Data: Updata
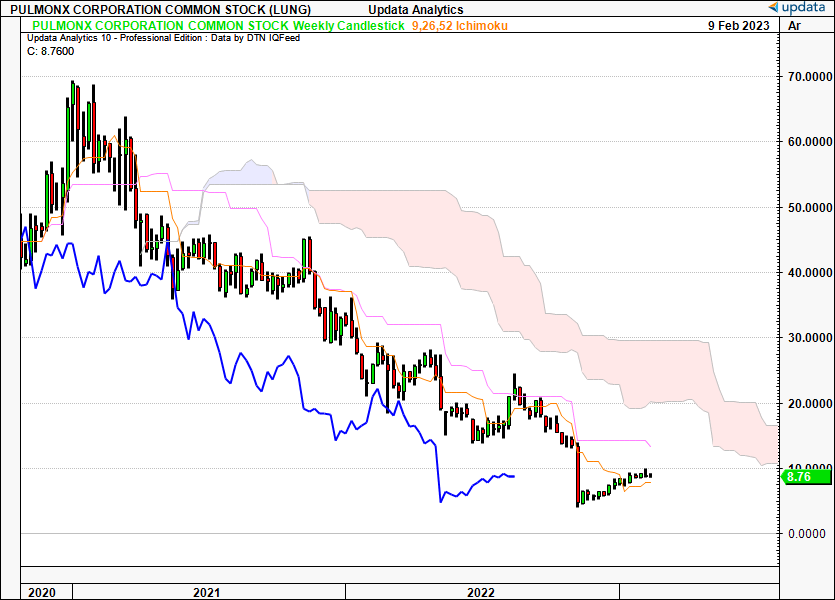
- Supporting this viewpoint, on the weekly chart, both the price line and lagging line are firmly below the cloud.
- This looks to the coming months, and we expect further resistance at ~$10 by July without a catalyst for reversal.
- We are bearish below the cloud on this setup.
Exhibit 5. Bearish below the cloud on weekly frame
Data: Updata
Market generated data for positioning
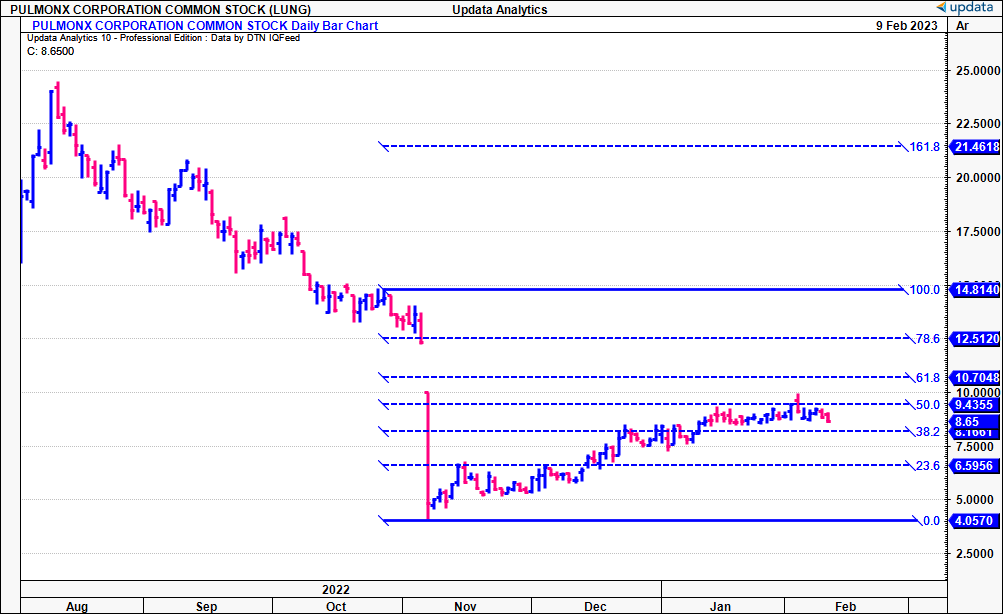
Tracing the fibs down from the October high [just before the large gap down] the stock is now testing a 50% of the retracement. As it entered congestion LUNG has held this range since January and needs to break above $9.40 for a continuation. If it does, we look to $10.70 then $14 as the next objectives. If it breaks lows, ~$8 and $6.60 are the targets ranges.
Exhibit 6. LUNG testing a 50% recovery of October–November retracement
Data: Updata
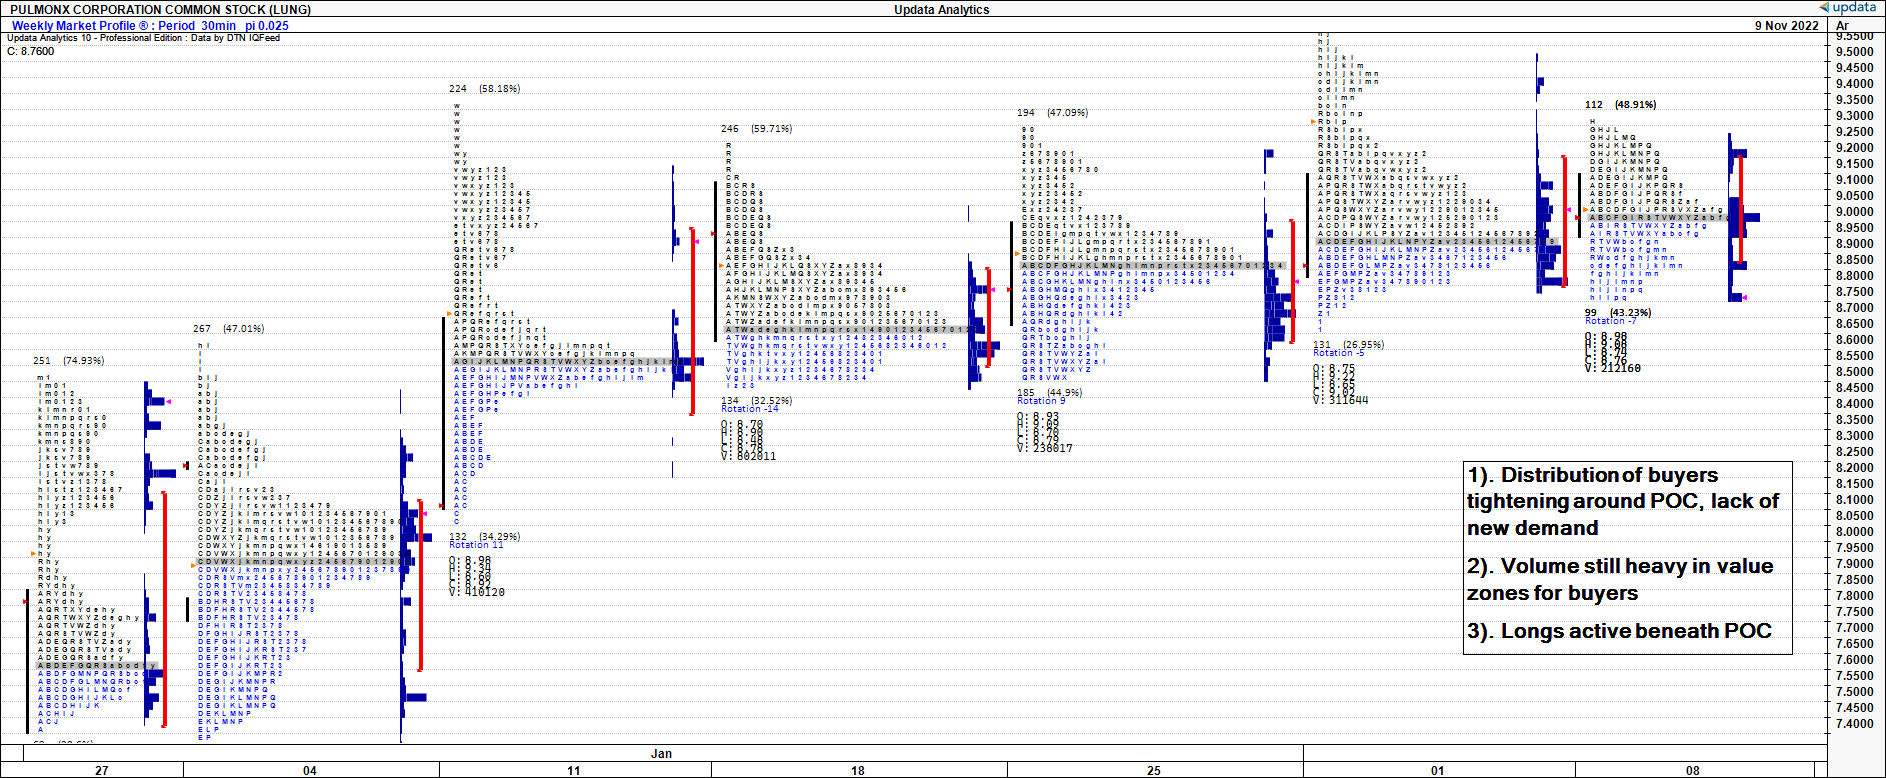
Turning to the weekly market profile, several observations are made on the activity of longs and shorts pushing up into the new year. The distribution of buyers is tightening around the point of control (“POC”), the mark where price spent the most amount of time each week. Especially into January, strategic buyers have thinned in number, suggesting a lack of new demand. Despite this, volume skew was still distributed toward the value zone for buyers [blue segments] whilst the value zone has held tight too. On this, there distribution of time-price opportunities has narrowed closer to the POC, narrowing the entry points.
Exhibit 7. Weekly market profile, longs active beneath POC, but demand tightening
Data: Updata
Switching to the monthly market profile, we get a deeper understanding of the price structure leading into this rally. The key months were certainly December and January, where demand was skewed heavily below the POC, illustrating how active investors were in reallocating on any price weakness. Long continued adding to positions, but many were stuck in February as the POC only ratcheted higher into January. Since, the Feb range has levelled in-line with the previous month, and the distribution of price opportunities is leptokurtic and biased above the POC. Both analyses instruct us that demand is thinning at key entry marks below the market’s estimate of fair value [i.e., the POC].
Exhibit 8. Monthly market profile, longs adding in December and January, February distribution tighter skew

Data: Updata
Subsequently, we have breadth in upside/downside targets looking at different frames. On the 60-minute chart, that looks out to the coming days, we look to upsides of $10.50. This is supported by previous targets thrown off in late FY22. We also have another upside to $14.25 on this frame.
Exhibit 9. Upsides to $10.50 on 60-minute frame

Data: Updata
On the daily frame, however, we have downsides to $7.75 after the $9.75 target fell within range. We used a 0.05×3 box reversal for greater sensitivity to the shorter-term volatility in order to pick up the potential reversals off LUNG’s congestion points. Nevertheless, the breadth suggests further sideways action on the chart ahead.
Exhibit 10. Downsides to $7.75 on daily chart

Data: Updata
In short
We’ve not gathered sufficient evidence that the risk/reward calculus from here is sufficient to drive adequate alpha from an at the market or limit entry from this analysis. We expect price to congest further sideways, in the absence of near term catalysts. In that respect, the upside risk is LUNG’s FY22 earnings that could reveal data or news that isn’t already in the price. Until we have this, however, we suggest a hold on LUNG stock, looking to enter on a continuation of the trend above the c.$9.50 mark.
Be the first to comment