

PhonlamaiPhoto
While there are a few signs that inflation across the globe is cooling down as central banks’ hawkish moves ultimately come to fruition, with demand gradually softening and price growth subsequently decelerating, investors might be entertaining a hope that after a merely calamitous year for expensive growth stocks, and especially for information technology, a massive rebound is just around the corner.
Alas, at this point, I am not a confirmed optimist yet, and when it comes to perennially overpriced IT, I would suggest that in case an investor seeks exposure to the sector at this point, high-quality moderately valued stocks still should be favored.
Some investors may justly remark here that the lower the size, the better the valuation profile, so small-caps-focused exchange-traded funds like the Invesco S&P SmallCap Information Technology ETF (NASDAQ:PSCT) may be worth considering as an option for passive exposure that does not require time-consuming research to uncover hidden tech value gems.
Though this hypothesis is partly right, I am of the opinion that PSCT’s focus on tech names selected from the S&P 600 index, a U.S. small-cap universe barometer, is not necessarily supportive of better valuation. Meanwhile, there is naturally a lot to be desired on the profitability side as names with lower market capitalizations typically have issues with margins, cash conversion, and capital efficiency.
So, neither a value nor a quality thesis could be constructed here, at least I would make no attempt as the data clearly suggest it could not be done. Now let me delve deeper and provide a better context.
PSCT has a 70-strong equity portfolio with the major ten holdings accounting for around 31.8%. Amongst the major industries represented are electronic equipment, instruments, and components (about 32%), semiconductors & semiconductor equipment (28.2%), and software (18.6%).
PSCT’s largest holding in the current version of the portfolio (most recently rebalanced in December 2022) is Fabrinet (FN), one of the leading global players in advanced precision optical/electronic/mechanical manufacturing services, with a plethora of products from transceivers and modulators to gas lasers.
Created by the author using data from Seeking Alpha and the fund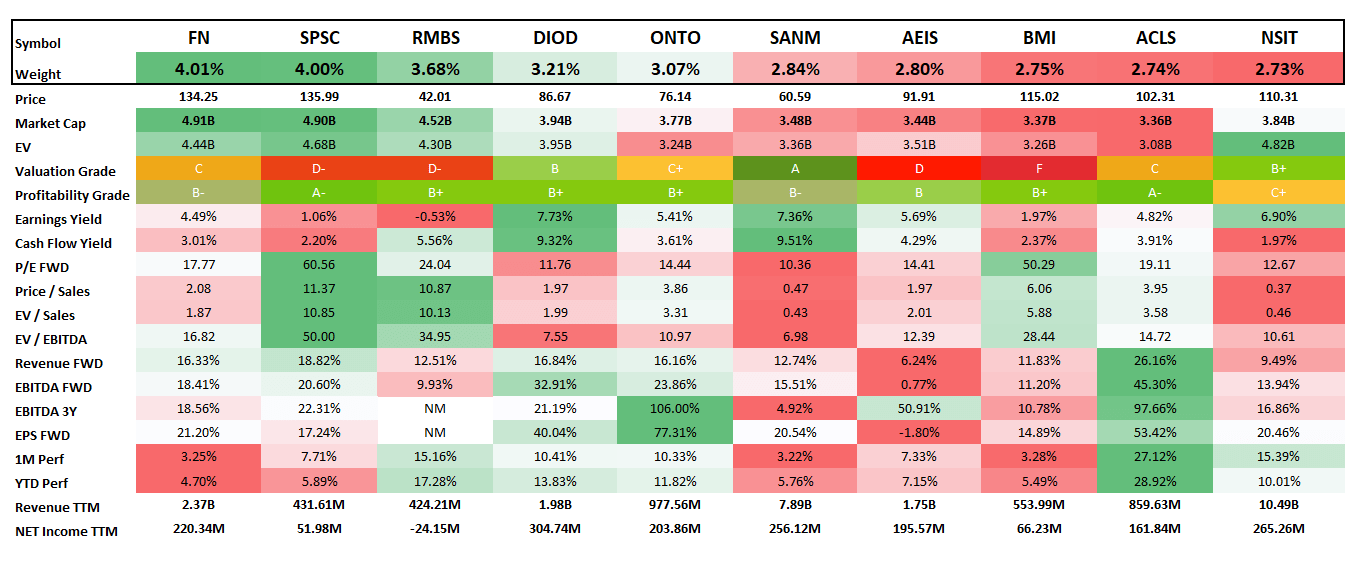
As a few of my dear readers might note here, FN is a mid-cap, with a $4.9 billion market value. In fact, Fabrinet is not the only stock in this basket that is technically not a small-cap (depending on a definition, assuming a small-cap should be valued at less than $2 billion). Upon closer inspection, we could find 26 stocks that belong in the mid-size league, together completely dominating the portfolio owing to their 62% weight. As a consequence, the weighted-average market capitalization stands at around $2.56 billion; a brief remark here is that the WA enterprise value is just about $100 million higher, indicating that most holdings have comfortable net debt levels, something of value in the higher interest rate era with a prospect of a recession in the mix; I will return to the discussion of quality, including resilience of financial position, shortly.
Anyway, PSCT’s holdings are fairly small, especially by the tech sector standards where mega-caps are aplenty (at least 20 names as of writing this article). Did that translate into a more appealing valuation? Hardly. At least, I have issues with creating a value thesis for an ETF which according to my calculations has a diminutive weighted-average earnings yield, less than 2%, or a staggering Price/Earnings of 51x, juxtaposed to 19.4x of the S&P 500. There is no denying that the EY could be skewed, and in this particular case, eleven stocks with negative yields, like Xperi (XPER), a software company with an EY of 126% below zero, did make a profound impact.
Perhaps we should look at the net operating cash flow yield instead? This metric is a solid substitution for a GAAP P/E since it removes the impact of depreciation & amortization on the accounting profit or loss and reflects how efficiently a company is managing its working capital, so I believe it makes sense to assess it. My calculations reveal the cash yield is 4.5%, which implies almost 22x P/Net CFO (Last Twelve Months); to contextualize, this is about 16% higher than the sector median. Next, the debt-adjusted earnings yield (EBITDA/EV), another solid metric mindful of borrowings, is only around 4%.
Nevertheless, there is an opinion that small-size IT companies have a Research & Development expenses issue, so their profit-based multiples would always look inflated. In this regard, sales-centered metrics should be more appropriate. Unfortunately, they also offer little solace. At least, I would not create a value thesis for a portfolio with an over 3x weighted-average Price/Sales (Enterprise Value is close).
Ultimately, a silver lining is that over 36% of the holdings earned at least a B- Quant Valuation grade, a result hard to find in the large-cap universe. One of the examples of meaningfully underpriced stocks in the PSCT portfolio is Photronics (PLAB), a photomask products manufacturer.
Seeking Alpha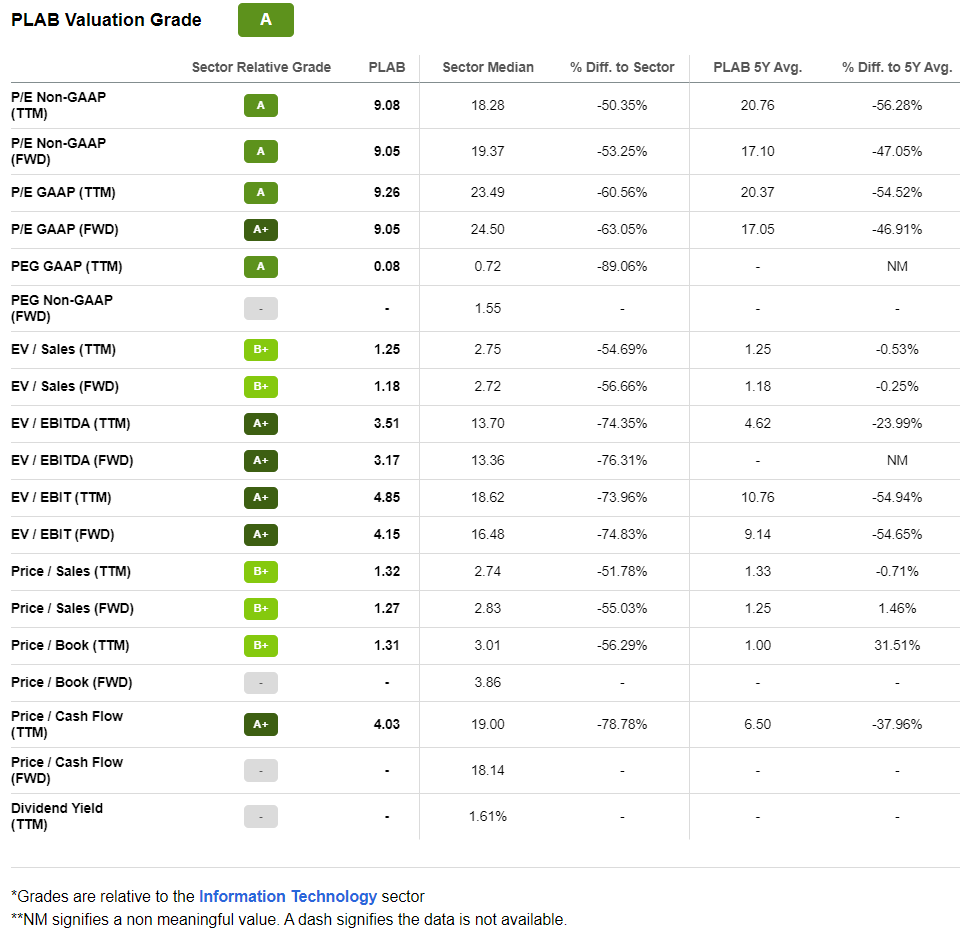
Be that as it may, over 27% are still priced for perfection (a D+ grade and worse), thus posing a meaningful risk not to ignore.
Do small caps have lackluster quality?
A fact not to overlook is that small-size companies in most cases have softer quality than their larger counterparts. And PSCT is obviously exposed to this issue too. There are a few major points worth touching upon:
- Over 19% of its holdings are unprofitable, while about 10.6% are cash-burning. 7% failed to deliver even a measly EBITDA.
- With a significant share of companies being EBITDA negative, the WA Return on Total Capital is around 8.3%, as per my calculations. This is fairly bleak.
- Only about 68% have a B- Quant Profitability grade or higher. To bring a bit more color, the iShares Core S&P 500 ETF (IVV) has more than 95% of net assets allocated to such stocks.
- Nevertheless, the financial position of most is adequate as ~74% of the companies have a Total Debt/EBITDA ratio of 3x or lower.
Final thoughts
PSCT is supposed to track the capped float-adjusted market-cap-weighted index consisting of the S&P 600 IT companies. The ETF has an adequate expense ratio of 29 bps.
An important note is that, according to the index provider, to qualify for the 600 cohort, a company
must have an unadjusted market cap of USD 850 million to USD 3.7 billion, and must have a float-adjusted market cap that is at least 50% of the unadjusted minimum market cap threshold.
So the presence of stocks with a market cap above $2 billion is not coincidental.
Last year, PSCT suffered amid a bear party on the Street, losing around 22.5% and thus underperforming IVV. Over the May 2010 – December 2022 period, it beat IVV, though failed to deliver a total return stronger than the Invesco QQQ ETF (QQQ) and Technology Select Sector SPDR ETF (XLK), which both are overweight mega-cap IT stocks.
| Portfolio | PSCT | QQQ | IVV | XLK |
| Initial Balance | $10,000 | $10,000 | $10,000 | $10,000 |
| Final Balance | $47,498 | $61,069 | $41,303 | $64,318 |
| CAGR | 13.09% | 15.36% | 11.85% | 15.83% |
| Stdev | 21.15% | 17.60% | 14.89% | 17.53% |
| Best Year | 45.44% | 48.40% | 32.30% | 49.86% |
| Worst Year | -22.50% | -32.58% | -18.16% | -27.73% |
| Max. Drawdown | -28.18% | -32.58% | -23.93% | -31.22% |
| Sharpe Ratio | 0.66 | 0.87 | 0.79 | 0.89 |
| Sortino Ratio | 1.09 | 1.43 | 1.23 | 1.49 |
| Market Correlation | 0.88 | 0.92 | 1 | 0.91 |
Created by the author using data from Portfolio Visualizer
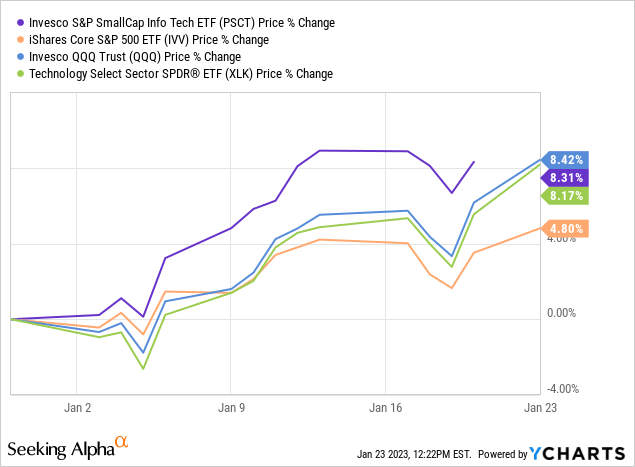
Nevertheless, it has been performing strongly this January thanks to the abating inflation narrative.
Summing up, this small-cap ETF has a questionable valuation manifested in an earnings yield below 2% together with Price/Sales of about 3x, not completely faultless quality, to say the least, yet there are a few robust growth stories in its portfolio. In fact, my calculations reveal it has robust weighted-average growth rates, including forward EBITDA (17.2%), Earnings per Share (19.4%), and revenue (11.4%). But owing to the soft quality and valuation issues, I find its factor exposure insufficient for a bullish thesis.
Be the first to comment