

designer491
In today’s relatively short article, I explain the reasons for which I’ve taken a speculative sized position in ProShares Short High Yield ETF (NYSEARCA:SJB). The reasons can be summarized as: (1) interest rates continue to rise, (2) there are many reasons to think that we could have a “risk off” event in the near future, yet high yield instruments don’t yet reflect that possibility and (3) higher rates can push marginal companies towards insolvency.
The Instrument
SJB is an inverse ETF that seeks to return -1X its underlying benchmark on any given day. The benchmark is the Markit iBoxx $ Liquid High Yield Index which is a US based, high yield index whose inclusion parameters are as follows (from the ProShares website):
Currently, the bonds eligible for inclusion in the Index include U.S. dollar-denominated, corporate bonds for sale in the United States that are issued by companies domiciled in the U.S., Bermuda, Canada, Cayman Islands, Western Europe or Japan; are rated sub-investment grade by Moody’s Investors Service, Inc., Fitch, Inc. or Standard and Poor’s Financial Services, LLC; are from issuers with at least $1 billion par outstanding; have at least $400 million of outstanding face value; and are between three and fifteen years to maturity. There is no limit to the number of issues in the Index. Index rebalances occur monthly.
As discussed again below, these inverse ETF’s, even when not leveraged, have a decay risk if over time there is high volatility without a substantial downward move in the underlying index, which is one reason why my position is only speculative sized. Also, the mechanism by which SJB establishes its positions is via swaps, so there is some potential for counter party risks.
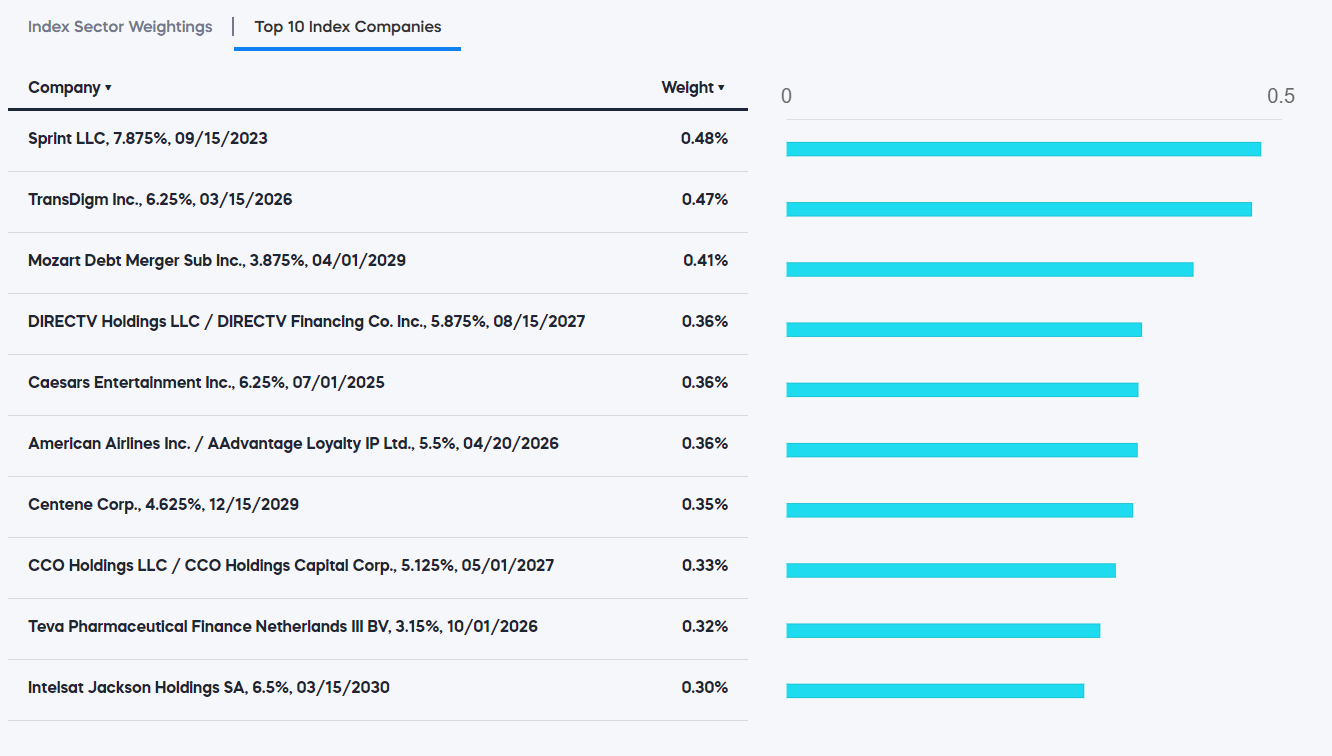
Holdings
The current index’s holdings by sector and by top instruments are shown in the next two graphics (data as of 9/30/2023). As can be seen in the second graphic, the largest holding represents less than 0.5% of the index, so it is a diversified index (i.e. it has no concentrated positions).
ProShares ProShares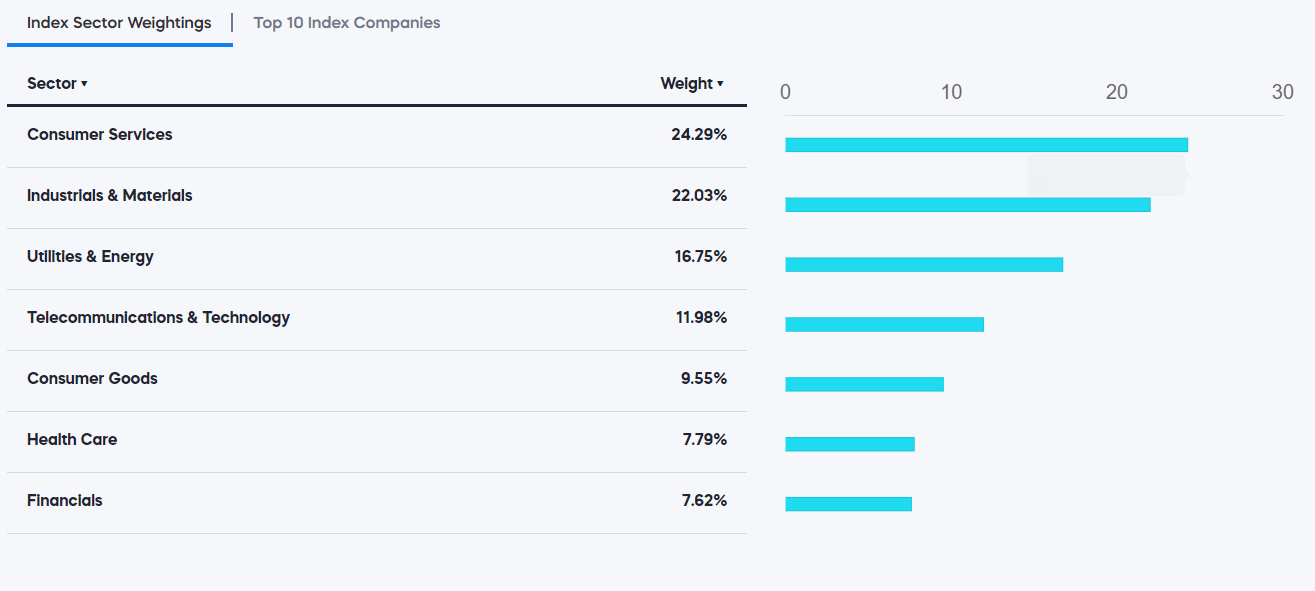
Summary Statistics
As shown in the next graphic, the index has 1194 holdings, with a weighted average maturity of about 5 1/2 years.
ProShares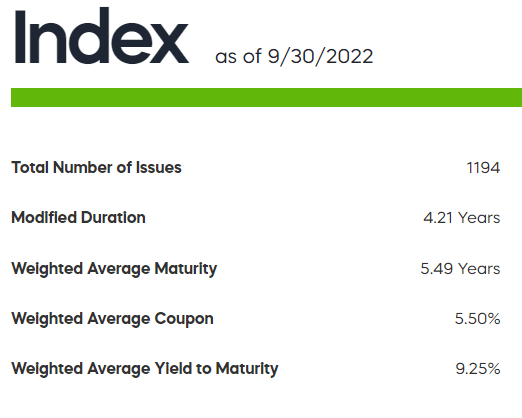
Now let’s turn to the three reasons to hold this instrument.
Interest Rate Environment
Although many are hoping for a “Fed Pivot” in 2023, there are reasons to think that rates may still have to go up next year. Consider first this statement from (non-voting) San Francisco Federal Reserve Bank President Mary Daly made on September 29th (with my emphasis):
“I’m quite comfortable” with policymaker projections published last week that show the majority see the Fed’s policy rate rising to 4%-4.5% this year and 4.5%-5% next year, Daly told reporters after an event at Boise State University. “It’s going to take restrictive policy for a duration of time to get clear and convincing evidence that inflation is getting back to 2% — so from my mind, that’s at least through next year.“
Most of us are familiar with the lack of fossil fuel supplies (driven by years of government policy) so there’s a good chance that fuel and electricity prices will remain stubbornly high despite rising rates.
Perhaps not as well known is the lag that’s built in to the housing/shelter component of inflation measures that could cause headline CPI numbers to continue coming in hot. Here’s one expert’s explanation of this phenomenon:
Dennis Shea, executive director of the J. Ronald Terwilliger Center for Housing Policy, explained that the CPI’s shelter measure combines rent (that is, what tenants pay their landlords) and owner’s equivalent rent (which is an estimate of what a homeowner forgoes by not renting an owner-occupied home to someone else). “Changes in inflation lag real time changes in housing costs because the CPI captures current rents paid, as opposed to advertised rents for newly vacant units, and leases and mortgages, as you know, typically last, a rental lease 12 months or more and mortgages, 15 or 30 years,” said Shea. “So we should, I think, continue to expect significant contribution of shelter costs to the CPI going forward.”
If inflation does remain high, due to supply and structural issues, such as those just mentioned, then rates may be going higher than most people currently expect. This is the first tailwind to the long SJB trade.
The Risk Off Trade
There are many global and macro reasons to worry about a major market meltdown; from energy prices spiking (10X) in Europe, to the Bank of Japan desperately trying to defend the Japanese yen from a further drop, to rampant inflation in the US and worldwide, to wars in Ukraine and potentially the far East.
Typically, when such events occur, the spread between high yield (aka junk bonds) and safer 10-year treasury note yields tends to widen significantly. The St. Louis Fed has helpful data from 1997 which illustrates this, but it was also true in the 1970’s through the 1990’s. Note in particular how the spreads widened substantially in 2001, 2008 and 2020. Yet today the spread is relatively low.
St Louis Fed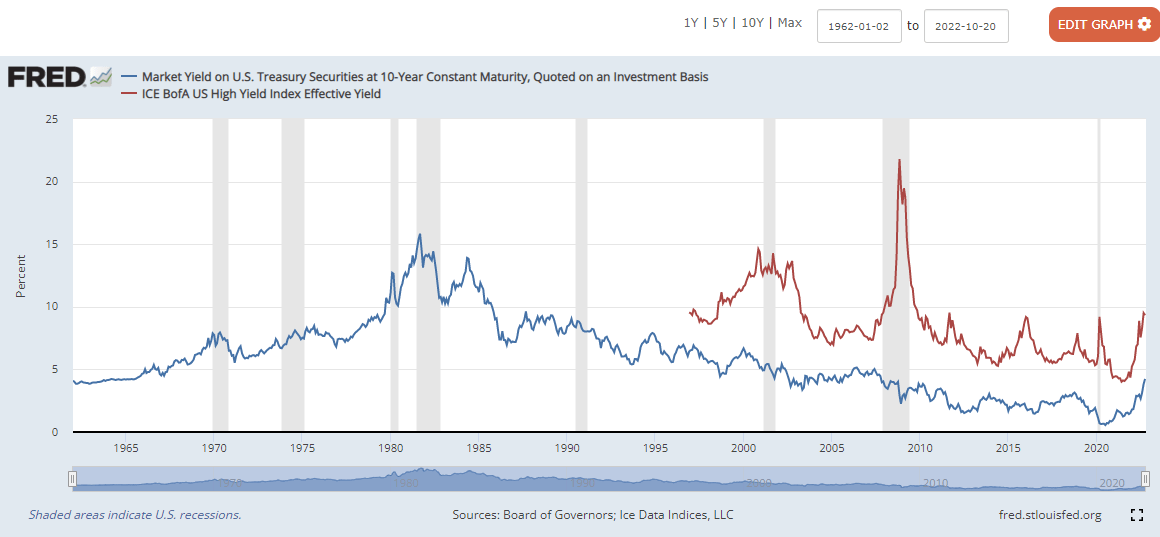
I think holding a short position in high yield bonds is a way to benefit from this tail risk if/when it occurs. But there’s a related aspect to this:
Higher Rates Can Push Marginally Solvent Companies Into Distress
By definition companies which are issuing high yield debt are considered by the market to be at higher risk for default. Yet for the approximately forty years between 1980 and 2020, rates were generally decreasing, which meant that companies could often refinance their higher yield debt to lower yields and thereby substantially improve their financial position and risk of insolvency. See next graphic.
St Louis FRED with Author’s Annotation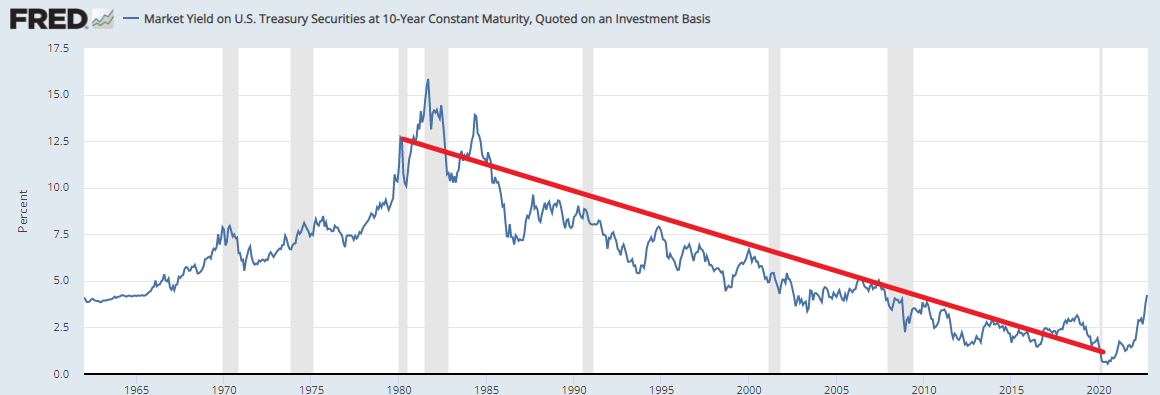
But if that trend of generally decreasing interest rates no longer obtains, then over-leveraged companies may not be able to refinance their way out of financial difficulties and we may see a new rash of insolvencies. In my opinion, high yield debt currently does not factor this very likely dynamic in, and hence it’s another strong reason to take a position in SJB.
Risks
There are several risks that exist with this trade:
- The Fed has become more political over time and hence it may pivot on rates even if the data doesn’t support it.
- SJB is an inverse ETF and thus it can suffer from “volatility decay” if the underlying index is volatile rather than just trending in the right direction. There are many discussions on the internet treating this issue, here’s one.
- Inflation abates much more quickly than expected.
- None of the potential macro risks cited above actually come to fruition.
Conclusion
I believe that the three factors discussed above; particularly the tail risk and the new interest rate environment which no longer gives struggling companies an easy out, combine to make a long SJB position desirable. However, considering the risks, I personally am only taking a speculative sized position in the trade.
Be the first to comment