

Bet_Noire/iStock via Getty Images
Investment Thesis
The ProShares S&P 500 Dividend Aristocrats ETF (BATS:NOBL) is a popular product with $9 billion in assets under management, and on the surface, it makes sense. Raising dividends for at least 25 consecutive years is no small feat, and it suggests companies can withstand any hostile market environment, including the current one. Also, keeping shareholders motivated by consistently increasing dividends provides a psychological boost that is tough to measure. Time in the market is more important than timing the market, so if dividend growth investing helps you remember that, all the better.
The issue with NOBL is that it treats all constituents the same. As you may know, NOBL follows an equal-weighted Index, but this article will show why a market-cap-weighted method would be better. Furthermore, I feel there are too many slow-growth and overvalued stocks weighing the Index down. Therefore, while the Dividend Aristocrats are great in theory, you’re much better off being selective with them. As I hope to convince you, there’s no reason to pay 0.35% in annual fees just for a relatively low-quality portfolio.
ETF Overview
Strategy and Methodology
NOBL tracks the performance of the S&P 500 Dividend Aristocrats ETF, selecting S&P 500 companies that have increased regular cash dividends per share for 25 consecutive years, a float-adjusted market capitalization of at least $3 billion, and a three-month average daily trading volume of at least $5 million. Spin-offs assume the dividend track record of the parent company.
The Index is reconstitutes in January and rebalances quarterly to equal weight. Finally, the Index must have a minimum of 40 constituents and caps sector exposures at 30% to ensure diversification. In my observation, these constraints aren’t applicable today but could be should we enter a prolonged recession where companies are forced to pause or cut dividend payments.
Sector Exposures and Holdings By Industry
The comparators I will use today are the SPDR S&P 500 ETF (SPY) and the Vanguard Dividend Appreciation ETF (VIG). According to Morningstar, all three ETFs are in the Large Core category, and since VIG also focuses on increasing dividends, it’s a reasonable and cheap alternative to NOBL.
Morningstar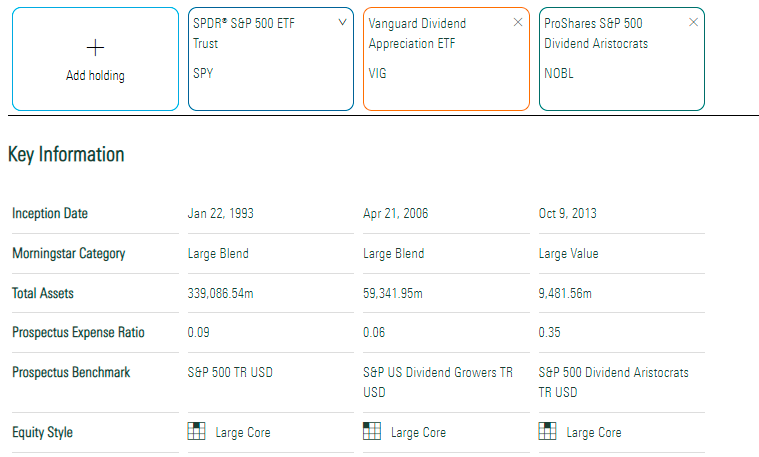
Compared to SPY and VIG, NOBL is substantially overweight Consumer Staples (21.24%), Industrials (18.75%), and Materials (13.40%) but substantially underweights Technology (4.81%). The latter is a key reason NOBL outperformed SPY this year by about 6.5% YTD.
Morningstar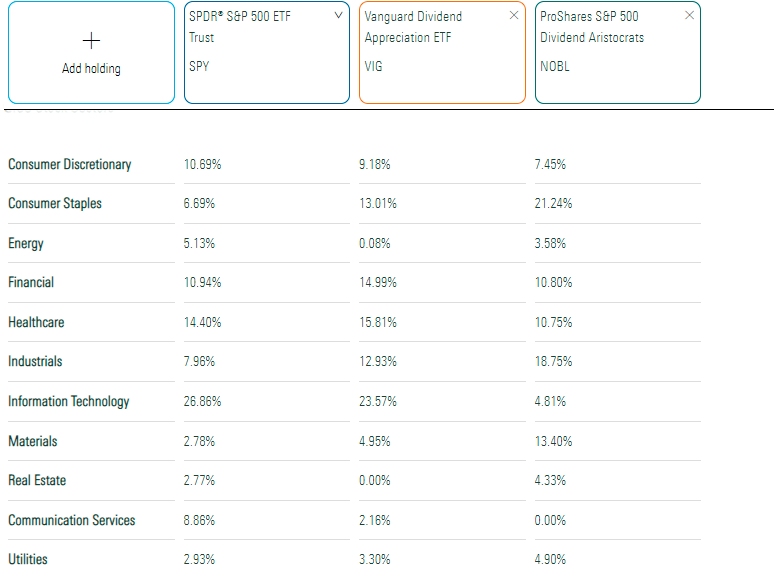
Rather than list NOBL’s top ten holdings, I’ve organized the top three holdings for each of its top 20 industries. This view covers roughly 60% of the ETF.
The Sunday Investor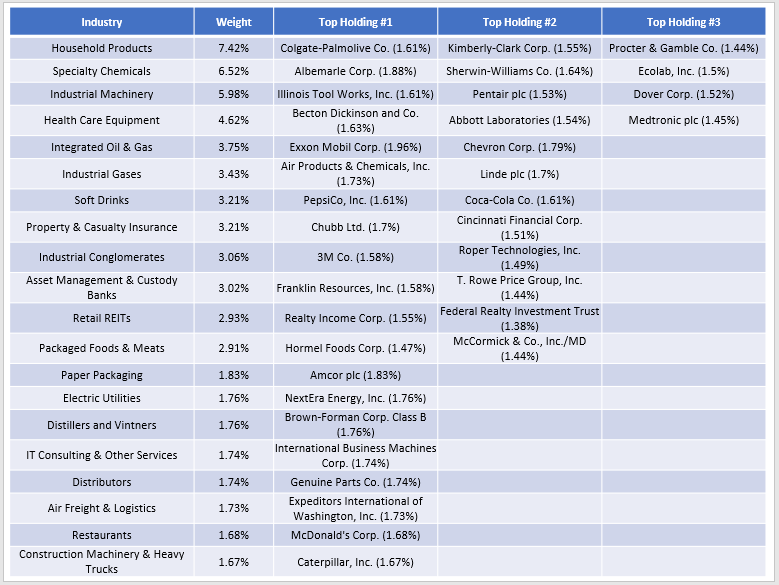
As shown, NOBL’s top industry is Household Products, which includes Colgate-Palmolive (CL), Kimberly-Clark (KMB), and Procter & Gamble (PG). Specialty Chemicals and Industrial Gases cover most of NOBL’s Materials exposure, and stocks like Albemarle (ALB) and Linde (LIN) have held up reasonably well over the last year.
There are 64 holdings in total, so the average weight per constituent is 1.56%. You can assume stocks with a weighting greater than this have outperformed since the last rebalancing in April and vice versa.
Performance History
NOBL was only the 44th best-performing dividend ETF out of 65 from November to May. I mostly attribute that to it being light on Energy and Utilities, so it doesn’t have my ideal level of diversification.
Since its October 2013 launch, NOBL has lagged SPY by an annualized 1.01% with slightly higher volatility. Against VIG, it outperformed by 0.06% despite a higher expense ratio (0.35% vs. 0.06%), but risk-adjusted returns (Sharpe and Sortino Ratio) were slightly worse.
Portfolio Visualizer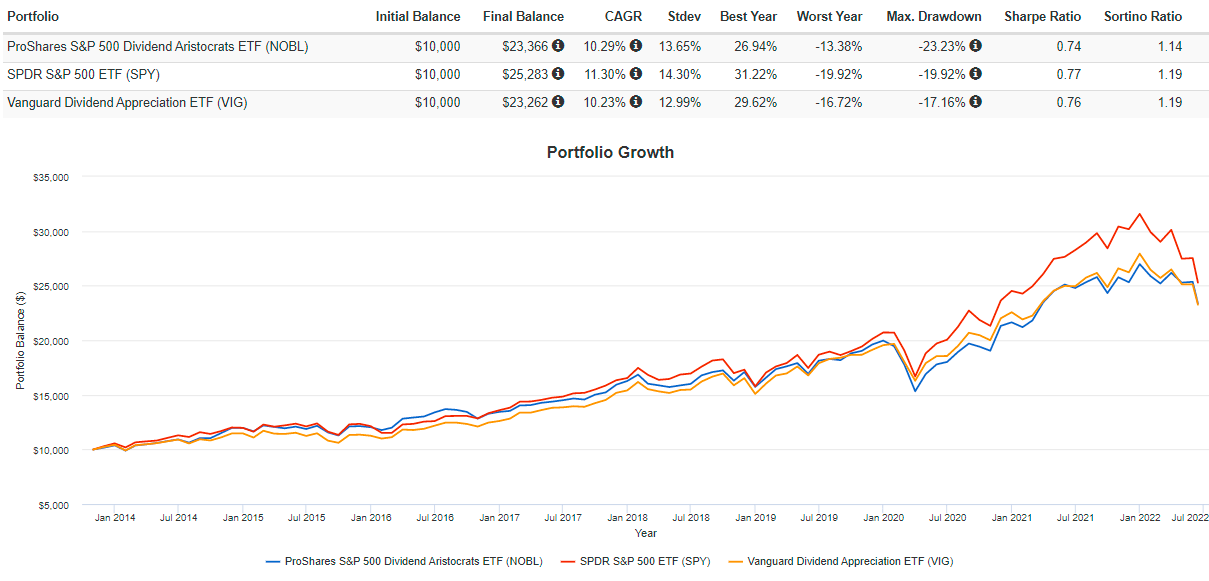
However, despite the higher standard deviation, the Dividend Aristocrats are generally safer in market drawdowns. Q1 2020 was the exception when the market favored technology stocks, but NOBL outperformed during nearly all of the market’s most significant drawdowns since its inception.
The Sunday Investor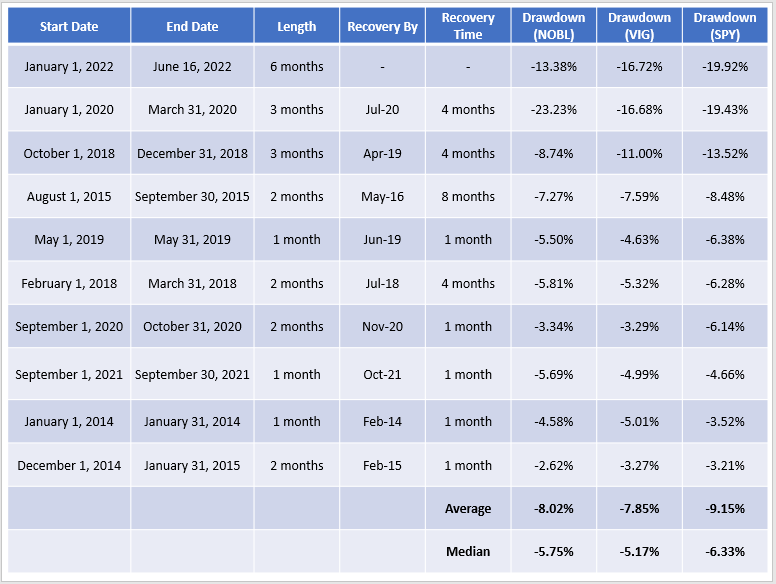
SPY is experiencing its worst drawdown since NOBL launched, falling 19.43% YTD through June 15, 2022. As mentioned, NOBL has outperformed by about 6.5% during this period, but the median drawdown of 5.75% is only 0.58% better than SPY. That’s not much of an advantage given its lower quality, which I will discuss next.
ETF Analysis
Fundamentals
First, I want to describe NOBL’s place in the large-cap dividend ETF space. I did this recently with the Schwab U.S. Dividend Equity ETF (SCHD), which provides some perspective for current and prospective shareholders. The following chart ranks NOBL on selected fundamental metrics relative to 23 other large-cap dividend ETFs, with a lower ranking indicating a better score.
The Sunday Investor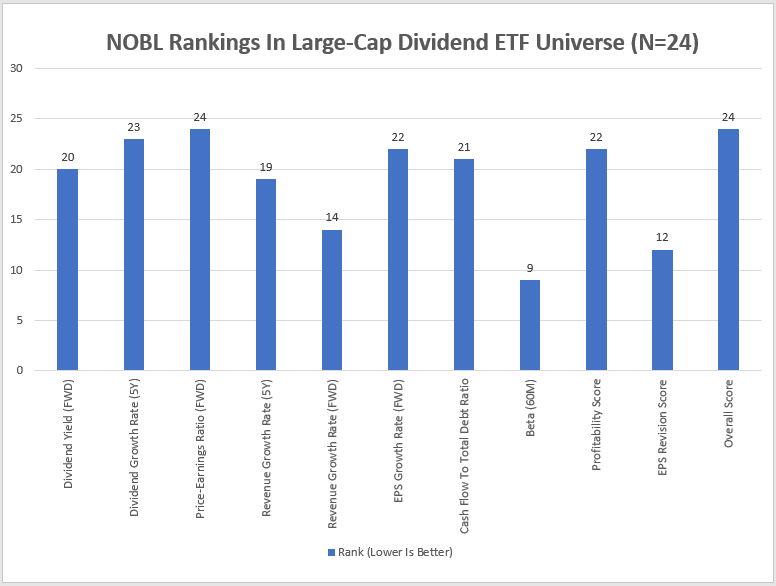
Judging by this chart, NOBL scores poorly on most metrics, including dividend yield and growth, forward price-earnings ratio, forward EPS growth, cash to total debt, and profitability. It ranks ninth-best on volatility based on its 0.93 five-year beta; thankfully, that’s been one of the significant factors driving performance this year. However, when that changes, there aren’t many areas that suggest strong outperformance.
Let’s look closer at NOBL’s fundamentals relative to VIG and SPY. The following table highlights selected metrics for NOBL’s top 20 industries, with summaries for each fund in the final rows.
The Sunday Investor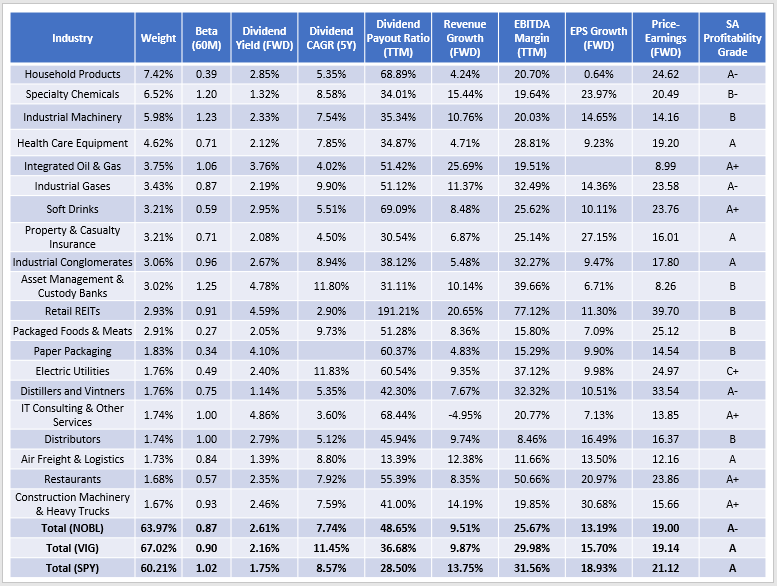
A few observations:
NOBL’s 2.61% gross dividend yield is 0.45% better than VIG’s, but its expense ratio is 0.29% more, so the net yield difference is negligible. Also, NOBL’s constituents have a much lower five-year dividend growth rate (7.74% vs. 11.45%), so while the Dividend Aristocrats have an excellent track record of increasing dividends, the increases are usually relatively small. I don’t see it as appropriate for income or dividend growth investors, given the alternatives.
2. Very few industries have a double-digit dividend growth rate, which is the norm in VIG and the Schwab U.S. Dividend Equity ETF (SCHD), reviewed here. One reason is that the Dividend Aristocrats generally don’t have the sales growth, earnings growth, or high enough EBITDA margins to support big dividend increases. Take Household Products as an example. All holdings have single-digit or negative forward revenue and EPS growth rates, so it’s not reasonable to expect dividends to increase faster than they already are.
Seeking Alpha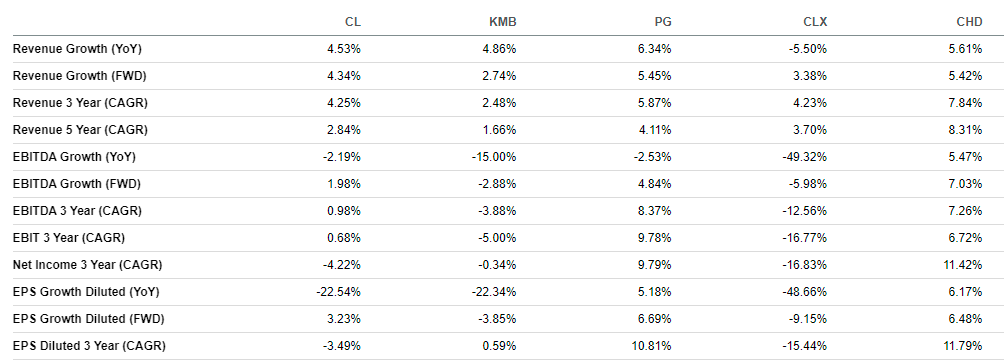
3. NOBL isn’t the ideal growth choice, either, since its forward revenue and EPS growth rates are below VIG. From a valuation perspective, each trades at about 19x forward earnings, and VIG’s holdings are more profitable as measured by Seeking Alpha’s Profitability Grade (A vs. A-).
4. Overall, NOBL doesn’t have an advantage over VIG on most of these metrics. Its five-year beta is slightly lower, suggesting more downside protection, but other than that, I don’t see it recovering as quickly as other dividend ETFs.
5. SPY has a forward price-earnings ratio that’s only two points higher than NOBL but has a lot more growth potential with higher EBITDA margins. Since I don’t think NOBL is worth buying for the yield or dividend growth, I consider SPY a better alternative today.
Eight Is Enough: Finding The Best Dividend Aristocrats
While buying all the Dividend Aristocrats through NOBL isn’t recommended, there are eight that score well on numerous metrics, including valuation, growth, and profitability. These stocks also have above-average momentum, and analysts are generally bullish on them, as indicated by Seeking Alpha’s EPS Revision Grade.
The Sunday Investor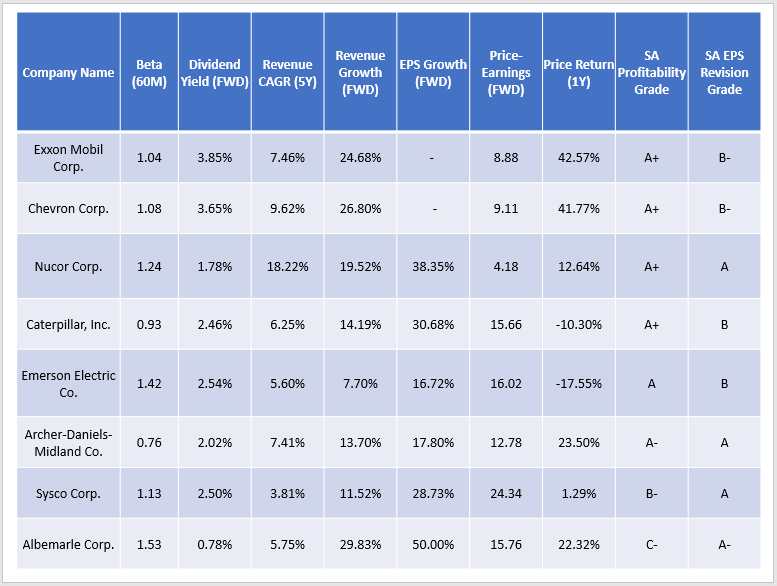
At the top of the list are Exxon Mobil (XOM) and Chevron (CVX), which are excellent defenders against the economy’s biggest threat right now: inflation. It will take a couple of quarters for higher interest rates to work their way through the economy and meaningfully reduce demand, so overweighting this sector is prudent. They also offer an above-average yield.
In contrast, Sysco (SYY) looks like a nice growth opportunity should the Federal Reserve manage to avoid a deep recession. The company is well-known for its cost efficiencies, and as pandemic restrictions become a thing of the past, sales to high-margin local restaurants should continue to increase. The stock’s forward price-earnings ratio is slightly elevated at 24.34. Still, they beat on earnings last quarter by 28% and is one of only five Dividend Aristocrats to earn an “A” EPS Revision Grade from Seeking Alpha.
Seeking Alpha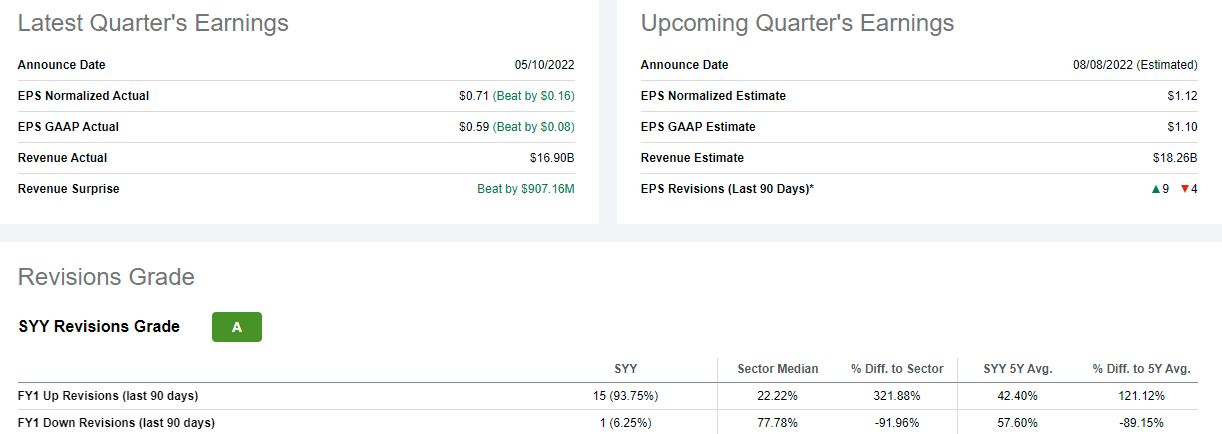
Investment Recommendation
The ProShares S&P 500 Dividend Aristocrats ETF is a relatively popular product with about $9 billion in assets under management, but I suspect that’s primarily a function of great marketing. Although increasing dividends for 25 consecutive years is impressive, I think it distracts from the factors that drive returns. I prefer looking at factors like dividend yield and growth, revenue and earnings per share growth, volatility, valuation, and debt management abilities. NOBL has outperformed the S&P 500 Index this year primarily because of its lower volatility, but it’s crucial to remember it scores poorly everywhere else. Even VIG, which I recently critiqued, scores better.
In summary, don’t pay 0.35% in fees for a relatively low-quality fund. There are superior dividend ETFs for a fraction of the cost that hold more all-weather stocks. You also have the option of just purchasing them selectively for no management fee, and I hope you’ll take some time to explore the eight I mentioned in more detail. Thank you for reading.
Be the first to comment