

NicoElNino
In our report titled Preparing for the 2020s dated August 3, 2022, we drew comparisons to the 1920s, arguing that initial enthusiasm for the post COVID-19 boom to resemble the 1920s was too premature. We showed that before the roaring 1920s commenced, the economy suffered a serious bout of inflation that was snuffed out by a deep recession in 1920-21. Upon economic recovery, the 1920s economy was then characterized by passive government, low inflation, and strong productivity.
Following the COVID-19 pandemic the economy is now experiencing the highest inflation in forty years, and a monetary authority which is hell bent on snuffing it out via a tight credit policy. This is raising the risk of recession with some like us believing it is already in progress and likely to extend into 2023. Others believe the real recession will not hit until sometime in 2023. Regardless, the real issue is that once cyclical excesses are cleansed, is the economy of the 2020s capable of exhibiting characteristics of the 1920s?
Our answer is a tentative affirmative depending on two phenomena. One is a return of a passive government. This we argue would take the form of two-party rule, as the economy seems to have operated quite well over time under this form. The more important condition for prosperity is a revival of productivity growth. This is crucial in holding down inflation, which in turn would be a springboard for faster economic growth.
The original mandate of the Federal Reserve was to prevent financial panics and bubbles. The current mandate is to achieve maximum employment and price stability. On average the economy of the 1920s registered a 4% jobless rate, 5% real GDP growth, and an annualized decline of 1.5% in the consumer price index. The equity market appreciated significantly and near the end of the decade, to prevent what it perceived as a bubble, the Federal Reserve doubled its’ discount rate. This was the prelude to the stock market crash in October 1929. Were the Fed to be fortunate enough to oversee such an economic backdrop in the 2020s, under its current mandate it would have no reason to adjust monetary policy toward restraint.
Economic growth is primarily a function of the growth of the labor force and the productivity of the labor force. Productivity is a key ingredient in achieving price stability. In the 1920s productivity rose by an average 5.4% yearly in the manufacturing economy and 2.3% yearly in the overall economy as shown on Table I attached. The economy was largely manufacturing based during that period and there was a relative reduction in the supply of labor. During the first part of the century the bulk of paid work was performed by males. The flu pandemic of 1918-19 was particularly devastating for males, and it was mostly males who fought and died in World War I. The COVID-19 pandemic did not distinguish by gender. Females comprise a much larger segment of the labor force now, and so the relative supply of labor was similarly constrained. In 2019 the civilian labor force totaled 163.5 million and was growing 0.9% yearly. In 2020 the labor force declined by 1.75% and has yet to fully recover.
The slowing of labor force growth and participation is being accentuated by a long secular downtrend in the average workweek. During the industrial revolution a ten-hour seven day workweek was common. After the Civil War the Aldrich report estimated the workweek in manufacturing went from 69 hours in 1850 to 60 hours by 1890 and by 1910 it had fallen to 57.3 hours. Just prior to the onset of World War II the workweek averaged 37.6 hours.
This downtrend occurred in tandem with a decline in child labor. The Keating Owen Child Labor Act of 1916 banned children under age 14 from factory work. It was struck down by the Supreme Court, but by 1920 many states passed laws banning child labor. The 1920s was also a decade of reduced immigration. Over 1.0 million people immigrated to the U.S. annually prior to the first World War. The war disrupted the inflow and in 1921 and 1924 legislation imposed strict quotas on new entrants.
If these restrictions had occurred in a vacuum, economic growth would have been sharply constrained. But the 1920s was a decade of significant innovation which was prompted by electrification and the internal combustion engine. These impacted every sector of the economy and sharply boosted productivity. The 5.4% average annual rise in productivity over the course of the decade was instrumental in the decade’s record of noninflationary economic growth.
Like the beginning of the 1920s, the economy of the 2020s is facing constraints in the labor supply. As noted, COVID-19 has been an important factor, restrictions on immigration are also playing a role. While illegal border crossings grab loads of headlines, there is a broad consensus in the business community that restrictions on visas and legal processes are creating labor shortages. The ability of business to benefit from low wage foreign labor also seems past its peak as deglobalization is beginning to take hold in response to supply chain disruptions and political tensions.
China is a principal target of western efforts to deglobalize. And yet China itself is facing a dwindling supply of cheap labor due to demographics and a growing preference among younger cohorts for service industry jobs versus manufacturing. As an offset, China is attempting to rapidly automate. The International Federation of Robotics estimates that shipments of industrial robots to China rose by 45% from the previous year and accounted for roughly half of all installations of heavy-duty robots.
Deglobalization can be a two-edged sword if handled properly. On the one hand the substitution of low wage labor with high wage labor could be inflationary. But a rising price of labor relative to capital could be a spur to innovation and productivity, and thus end up being deflationary. Indeed, an August 2022 Wall Street Journal article ‘U.S. Companies on Pace to Bring Home Record Number of Overseas Jobs’, addressed this topic. The article quoted Harry Moser, founder and president of Reshoring Initiative as saying companies must automate to offset the higher cost of labor domestically. And according to the Association for Advancing Automation, North American companies ordered a record 11, 595 robots worth $646 million in the first quarter of this year.
There is no data series for robotic equipment activity. However, included in the government national income accounts under gross private domestic investment (GPDI) is a category titled information processing equipment and software (IPES). The series seems representative of automation broadly defined. Data is quarterly beginning in 2002 and is shown as Chart I attached. For perspective real GPDI rose by about 70% over the period while IPES spending rose by over 400%. Unlike GPDI which experienced dips, IPES was not negatively impacted by events like the oil collapse of 2015-16 or the Boeing 737 Max crashes of 2018. But the pandemic induced economy meltdown showed a dip. While it is not certain, our intuition is that IPES investment is benefiting from the accelerated depreciation provisions in the 2017 tax cut legislation.
For the economy’s productivity rate to even remotely resemble the record of the 1920s, it will have to affect the service sector. Unlike that earlier period, the economy is significantly more tilted to the service sector. As shown on Chart II attached, the number of goods producing employees has grown from about 11 million in 1939 to about 21 million currently. The number of service industry employees has risen from about 19 million in 1937 to about 131 million currently. As this shift in the labor supply has occurred, the final consumption of goods versus services has not changed materially. Nominal goods consumption has risen about 7% yearly on average since the end of World War II while service industry consumption has risen by slightly more than 7% yearly.
Of course, productivity is more exactly measured in the goods sector because the comparison is between widgets and manhours. There is no such comparison in the service sector. Thus, as service industry activity grew, manufacturing productivity easily outpaced the economy wide growth rate as shown on Table I. And as is evident from the table, the shift toward services has coincided with a downward drift in economy wide productivity growth over time.
Robots and automation could thus be very important in boosting the efficiency of the service sector and the entire economy. Of course, predicting the path of productivity improvement is difficult, particularly because it is about the future. However, there is a growing list of anecdotal evidence that is encouraging. In late August CNBC published a report titled “Panera Bread tests artificial intelligence technology…” which noted that the company is using Open City’s voice-ordering technology that interacts with customers when they pull up to the drive-thru speaker. McDonald’s is also working to automate its drive-thru lane, announcing a partnership last year with IBM to work toward that goal.
In late August a New York Times report noted that Blank Street Coffee has a business model using automation to take orders. Its stores would typically operate with only two employees per shift versus the nine employees per shift at a typical Starbucks.
Fast food establishments now have a major incentive to adopt automation as California’s governor signed the Fast Food Accountability and Standards Recovery Act. It establishes a 10 member Fast Food Sector Council that is tasked with establishing standards on minimum wages, maximum working hours, training, and other working conditions applicable to industry workers. It is expected to impose a $22 per hour minimum wage among other standards. The Society for Human Resource Management has warned that this will very likely speed up the use of technological efficiencies and innovations in drive through ordering and kitchen equipment.
As a further strike at the fast-food industry, in early September the New York Times reported that federal regulators have proposed a rule that would make more companies legally liable for labor law violations committed by their contractors and franchisees. Under the proposed rule which governs when a company is considered a so-called joint employer, the National Labor Relations Board could hold a company like McDonalds liable if one of its franchisees fired workers who tried to unionize, even if the parent company exercised only indirect control over the workers.
A potentially significant productivity improvement could result from the introduction of autonomous or self-driving vehicles. Before self-driving cars become a reality it is likely that the technology will be deployed on commercial vehicles such as trucks and delivery vans. These typically follow predetermined routes as opposed to operating in different areas and road conditions. One self-driving truck could operate 24 hours per day, seven days per week and thus could replace 4 or 5 human drivers. A self-driving truck needs to be refueled, but it never takes a meal or rest break; it never gets ill; and it never goes on strike or takes a vacation.
Finally, however one views the recently enacted $50 billion CHIPS Act, it is certain that as a result the supply of semiconductors will increase, especially since recipients of federal largess are expected to get additional funding from private and state and local sources. Not all semiconductors go into artificial intelligence technology processing equipment and software. But greater availability of semiconductors should lower research and development costs and hasten the advancement of new and existing technological equipment.
There are some tentative conclusions that can be drawn from this historical sketch and the road ahead. First, we noted at the outset that an important element of the 1920s boom was a passive government combined with a series of tax reductions and business friendly policy. In our previous report on Preparing for the 2020s we suggested that political gridlock would be the equivalent in the current period and merely making permanent the 2017 tax reduction would be the equivalent of a tax cut.
From the anecdotal reports we have cited, one might conclude that the current direction is toward more active government involvement in the private sector. Perhaps, but perversely some of the barriers currently being erected would increase the incentive for affected businesses to take steps to limit their exposure. The result is likely to reduce headcounts in affected industries but also to introduce new efficiencies. As a result, we would expect spending on IPES to continue increasing its share of overall GPDI as Chart III attached shows it has been doing. This we think will show up in an improvement in the economy’s overall productivity growth rate. It will not match the torrid rate of the 1920s, but just a one percentage point increase in the economy’s abysmal productivity performance of the last ten years would get us back to the record of the 1990s. This is a formidable goal but not an impossible one by any means.
The Federal Reserve is operating on the assumption that the economy’s trend growth rate is slightly below 2% annually. The Fed continually overestimated the magnitude of the recovery from the 2008-09 financial crisis. The Fed continually overestimated the inflation rate over the past ten years, and in the post pandemic period to date the Fed has underestimated both growth and inflation. We think this abysmal record stands a good chance of being repeated over the coming ten years, especially if productivity growth recovers. Such an outcome would be a positive for all.
|
Table I Growth Rate Annual % Output/Hour for Selected Periods |
|||
|
Manufacturing |
Private Nonfarm Economy |
||
|
1901-1919 |
1.71 |
||
|
1919-1929 |
5.45 |
2.27 |
|
|
1929-1941 |
2.61 |
2.35 |
|
|
1941-1948 |
0.2 |
1.71 |
|
|
1949-1973 |
2.51 |
2.88 |
|
|
1973-1989 |
2.42 |
1.34 |
|
|
1989-2000 |
3.56 |
1.92 |
|
|
2001-2010 |
3.57 |
2.39 |
|
|
2011-2019 |
-0.06 |
0.92 |
|
|
2011-2020 |
-0.58 |
1.07 |
|
|
2020-2021 |
1.18 |
1.86 |
|
Source: Prepared by Author with data from BLS and Bureau of the Census
Chart I
Chart I IPES, Billions of Chained 2012 Dollars (BEA)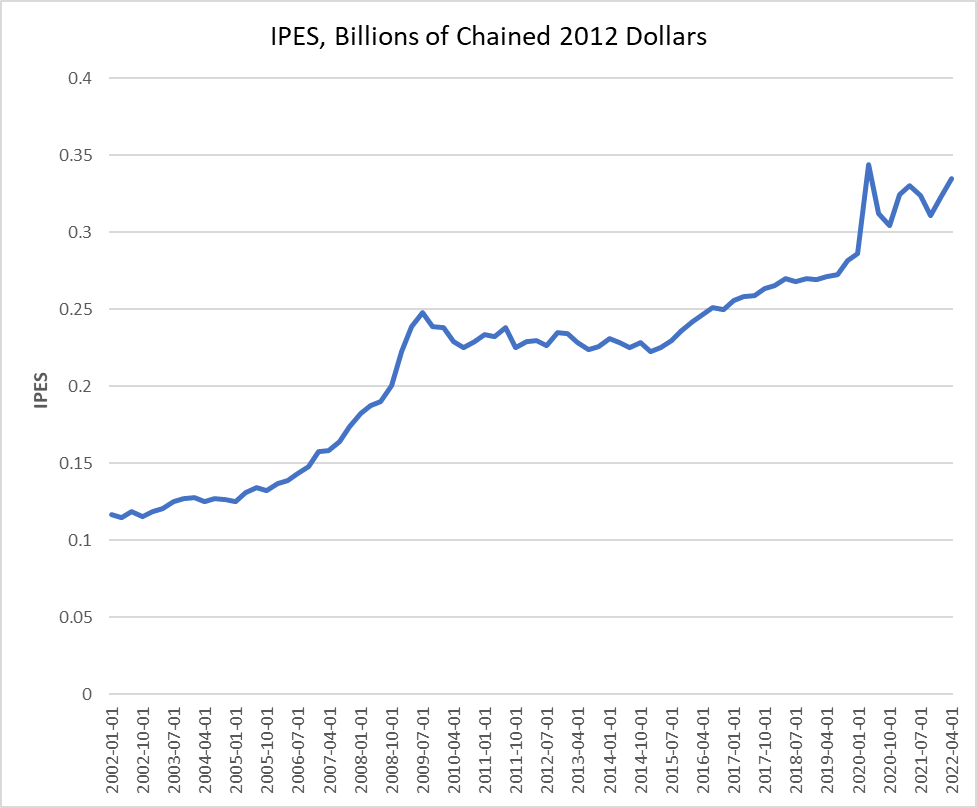
Chart II
All Employees thousands Goods Producing, Service-Providing (BLS)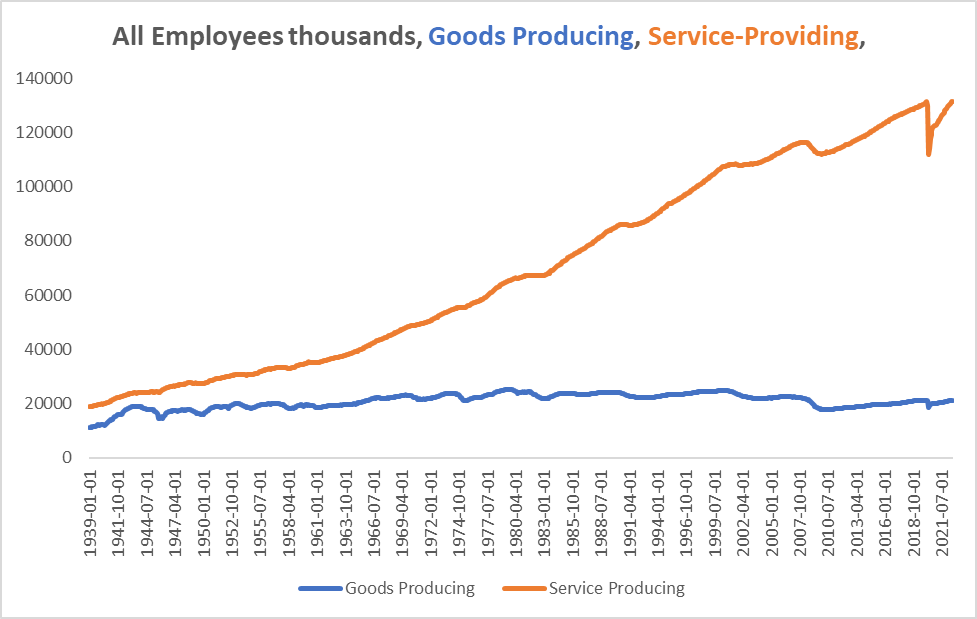
Chart III
IPES as a share of GPDI (BEA) All Employees thousand Goods Producing, Service-Providing (BLS)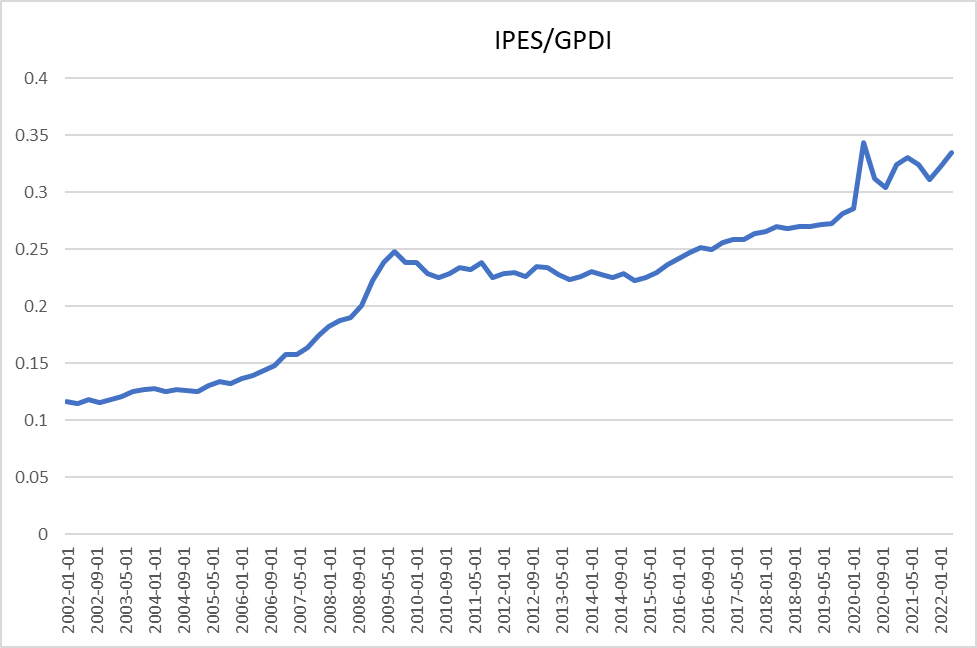
Please note that this article was written by Dr. Vincent J. Malanga and Dr. Lance Brofman with sponsorship by BEACH INVESTMENT COUNSEL, INC. and is used with the permission of both.
Be the first to comment