

Dilok Klaisataporn
Target (NYSE:TGT) has been a strong consumer staple sector general merchandise and grocery retailer. I purchased my first shares in 2019 with a nice low price that gave it ~4% dividend yield at the time. It did surprisingly well through covid, 2021 and 2022. I own a core position of TGT stock that was trimmed in 2021 when it became overvalued up into the $200 range with a 1.5% yield. However, it is now experiencing headwinds with high inventory levels along with declining earnings which are causing price volatility. Firstly I wish to review a few company facts and statistics before getting into the “nuts and bolts” of future dividend growth, earnings and price projections.
Target
TGT is a consumer staple sector general retail and grocery merchandiser company established in 1902 and headquartered in Minneapolis, MN.
The following are a few statistics:
-
$79.1 Billion market capitalization.
-
S&P credit rating of “A”.
-
72% dividend earnings payout ratio, rising quite high recently from 23.3%.
-
55.5% long-term debt/capital.
It has had its share of poor management and controversy, with an entry January 2013 into the Canadian retail market . It successfully lost $1 billion in the first year and with the potential for further losses it decided to close doors and leave Canada in January 2015, after only 2 years. The price also was hurt by a strange controversial 2018 bathroom policy, which is now long forgotten, but at the time caused much bad publicity for management and the company. All of this caused the price to take a huge downturn and it became a great value speculation quality company to own and I purchased my shares.
Earnings and Risks
The chart below from “Stock Analysis on NET” shows it having $13.92 billion in inventory to start 2022.
Target starting 2022 inventory (Stock Analysis on Net. Feb 2023)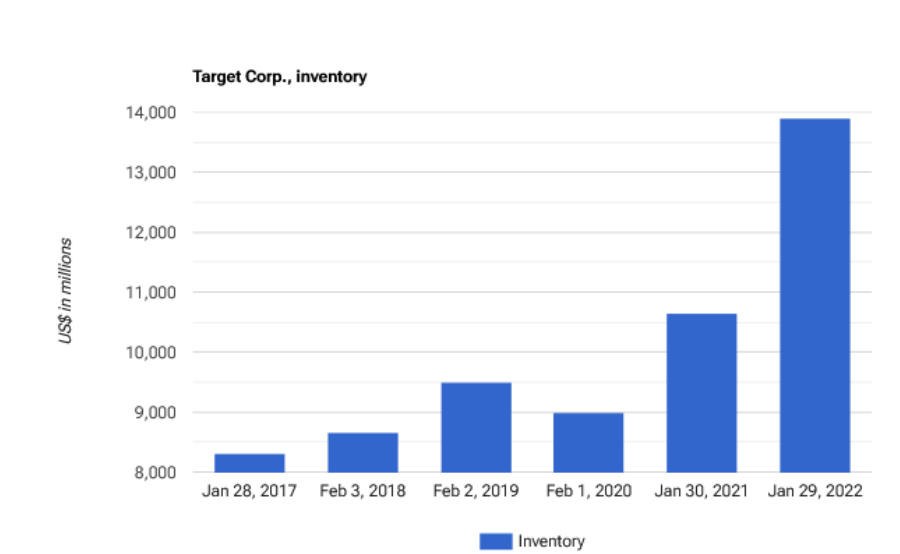
Value Line has stated inventory rose even higher to ~$17 Billion to end 2022. Target then promoted a “ 50% Clearance Run” markdown on clothes, shoes, toys and jewelry to incentivize gift card use on the items to clear shelves for fresh products heading into spring and the coming summer seasons. Target management showed poor product selection which resulted in less foot traffic and consumer spending. The damage was done as earnings were very low to end fiscal 2022 coming in at ~$5.50/ share. 2023 headwinds could also put a damper on earnings with suggestions of a possible 2023 recession and continued rising interest rates.
Analyst Pricing
Morningstar and Value Line analyst prices are from a premium paid subscription I obtain through a library source.
The following abbreviations are used in the chart that follows:
Curr Pr/Sh = Current price per share
M* FV = Morningstar fair value
M* Buy = Morningstar lowest and very inexpensive price to buy
VL = Value Line safety score: 1 is the safest/ best and 5 would be very unsafe. 3 is very average.
VL Mid PT = Value Line 18-month future price target or Mid 2024
YF PT = Yahoo Finance 1-year future price target
CFRA = TD Ameritrade broker analyst price target
52 wk Low = current 52-week price low
52 wk High = current 52-week price high
|
Stock |
Curr |
VL |
VL |
M* |
M* |
YF |
CFRA |
52 wk |
52 wk |
|
Ticker |
Pr/Sh |
18mo |
FV |
Buy |
PT |
PT |
Low |
High |
|
|
(TGT) |
171.1 |
3 |
187 |
177 |
123.9 |
176.46 |
162 |
$137.16 |
$254.87 |
FAST Graphs – FG
FG shows in one picture graph earnings statistics, price, dividend attractiveness, and much more. The FAST part of FG, just in case you were wondering, stands for: Fundamental Analyzer Software Tool. It was developed and introduced by Chuck Carnevale, a writer at SA. I have had a paid subscription for many years that I use often with great success.
The following colors/lines on the chart represent the following:
Black line = price
White line = dividend
Orange line = Graham average of usually 15 P/E “price/earnings” for most stocks.
Blue line = Normal P/E
Dashed or dotted lines are estimates only.
Green Area represents earnings.
Statistics by year are noted for high and low prices at the top of each chart in black, with earnings and dividends at the bottom of it. The % shown is for the change from year to year for earnings. An E following any number means it is an estimate.
Shown below is a 7-year chart representing the last 5 years along with 2 years of future estimates (dotted lines).
Target Feb 11, 2023 Price & earnings (FASTgraph Chuck Carnevale)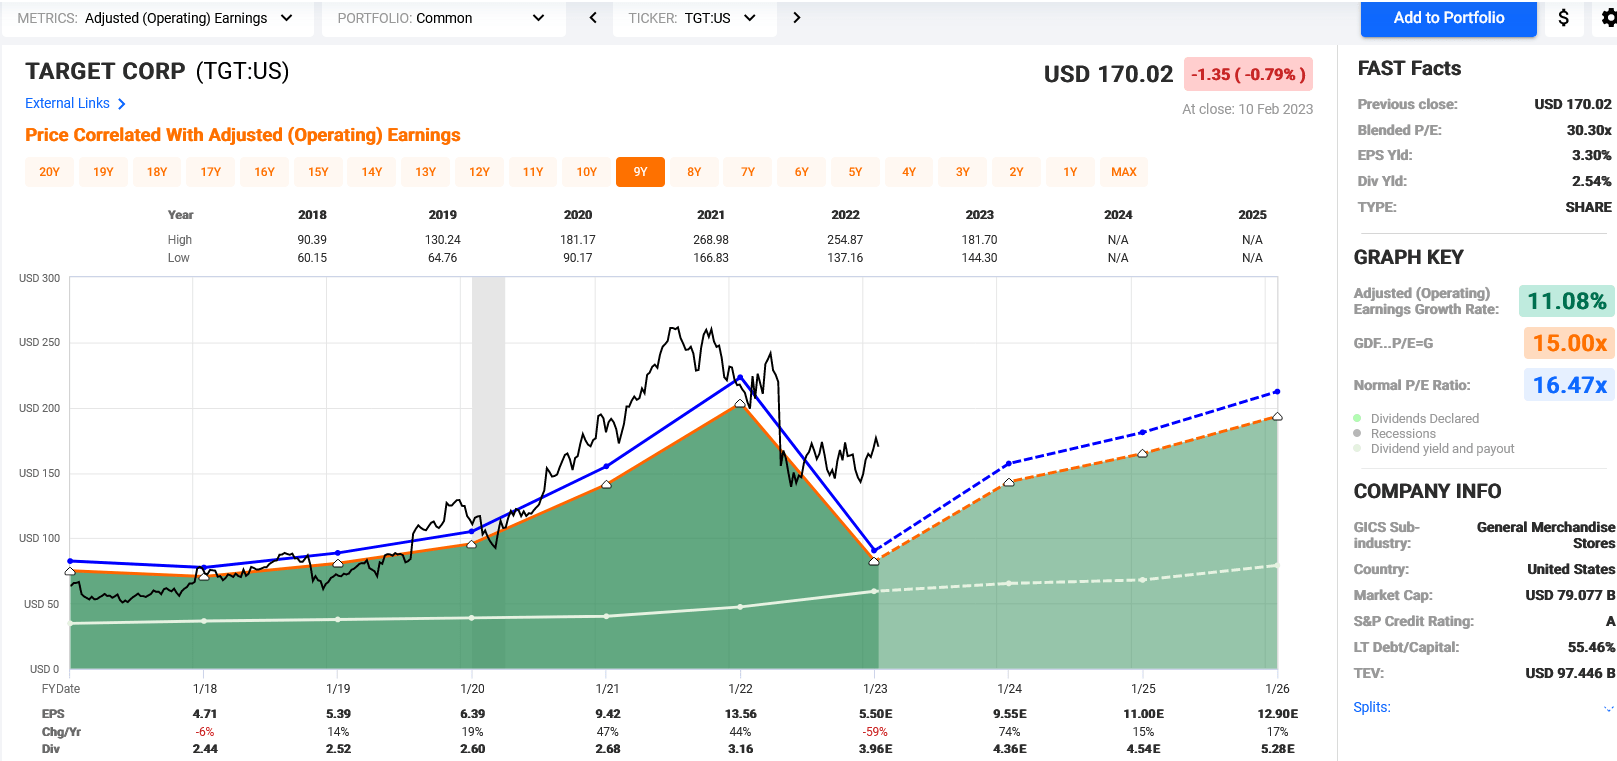
Earnings and Price
Target ends its fiscal year at the end of January, which differs from most other companies that end in December each year. Please note that when reading the chart statistics.
The current price of $171.37 shows it sells at a 30.7x P/E on earnings of $5.50 as shown for the end of 2022. It would be a 12.6x P/E if the 2021 earnings of $13.56 are used. Now, that is a huge difference in earnings and some of that is already factored into the current price, which can be seen in the black price line dip. That dip is readily apparent in the chart for earnings too! It did hit a low price of ~$139 in June 2022. The chart below from Yahoo Finance shows it missed earnings for the last 3 quarters reported. The pressures on obtaining inventory and picking what customers wanted offered a challenge to many retail managers in 2021/22. The price is now fluctuating, see-sawing/ deciding which way to go as it awaits the next earnings report coming February 27th.
Target Earnings Report 2022 targets (Yahoo Finance Feb 11, 2023)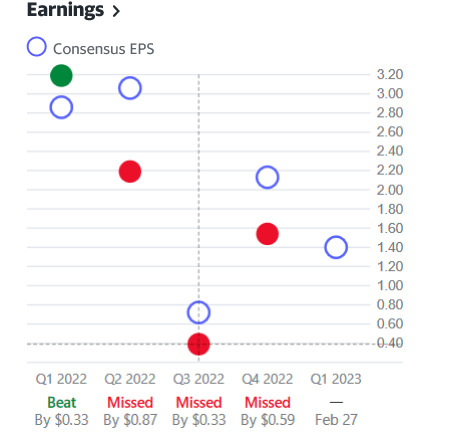
The miss of actual revenue is listed as a decline of -59% is easily noted in the chart with the only $5.50 of earnings/ share for 2022. The normal blue line P/E of 17.6x would equate to a price of $96.80 using those $5.50 earnings. That is where the price would be if it followed the chart and would mean more price erosion coming for Target and the M* buy price of $129 might even be too high. It would seem earnings growth for 2024 of 74% might be driving the price to stay where it is today near $170. The estimated earnings should rebound to ~$9.50 if all goes well in 2023. If so, 17.6x that $9.50 = ~$167, but to me 15x = $142.50; where I believe it can land. Value Line analysts also suggest margins have slipped to single digits which could continue into 2024.
A positive note is that management is continuing share repurchases and has developed some alternative revenue systems. Those include being in a 3rd party marketplace, Roundel shopping media and its own credit card with profit sharing. These are small steps but are definitely positive.
The end of this month should perhaps bring some interesting needed earnings answers to get to a right and fair price for Target.
Dividend Growth
55 years of rising dividends makes Target a quality dividend company in a portfolio.
The 5-year DGR is 10.5% and the last 2 years have been amazing at 26%.
Below shows the quarterly pay date and amount to arrive at the actual $3.96 paid in 2022, which was a 20% dividend raise itself.
Target dividend performance 2022 (FASTgraph Feb 11, 2023)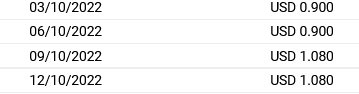
It has declared a continuation of the $1.08 for March and most likely it will announce the same for June. The next raise would be September. FASTgraph estimates show $4.36 to be paid for 2023, which would mean a raise to $1.10 to get there which would be a 1.9% raise. It’s a raise and not a very big one, so it is very Important to note it is not the 26% of the 2 prior years. If 2024 FG shows a correct estimate, my math makes it ~4% raise. The reality is there will be tepid low raises for a few years to come, but Target will still continue to give them and remain an aristocrat champion.
Summary/Conclusion/Recommendation
Target stays in RIG as a core holding, and I will look forward to adding some when the price is commensurate with what I believe to be fair and what the future dividend might be. The next earnings report at the end of February should bring the price back down, but then this market is unpredictable. The price did hit in the low 140s already in 2022 and should do so again. Lower earnings from 2022 and estimates could reveal more weakness, but should also bring some hope for 2023. The quality of a safe dividend is there, but a lower price at or near what M* suggests is what I truly would like, but under $140 is where I will be watching it very closely to add to my core position.
Please see the bullet point at the beginning of the article to read about my Rose’s Income Garden “RIG” portfolio of 80 stocks found at The Macro Trading Factory service. There is a funds portfolio also found there managed by The Macro Trader.
Happy Investing to All!
Be the first to comment