


sitox
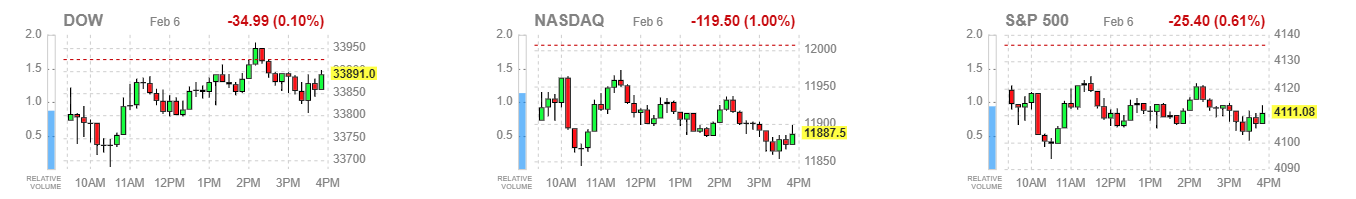
In my view, it is short-sighted to deduce that the 517,000 jobs created in January will drive wages higher and put upward pressure on inflation when measurements for both declined in the same month. Regardless, Atlanta Fed President Raphael Bostic announced yesterday on cue that the jobs number “would translate into us raising interest rates more than I have projected right now.” Like Pavlov’s dogs, investors ran for the exits for a second day in a row, as interest rates rose and stocks fell, but the losses were concentrated in the more rate-sensitive technology sector. I wouldn’t be surprised if we see a far less dovish tone from Chairman Powell when he speaks today, as the Fed wants to keep a lid on investor enthusiasm until it feels we are further down the road of disinflation. That doesn’t mean that interest rates are going any higher for any longer than they were before the jobs number, but Fed rhetoric is designed to make us think they are in an effort to keep inflation expectations in check.
Finviz
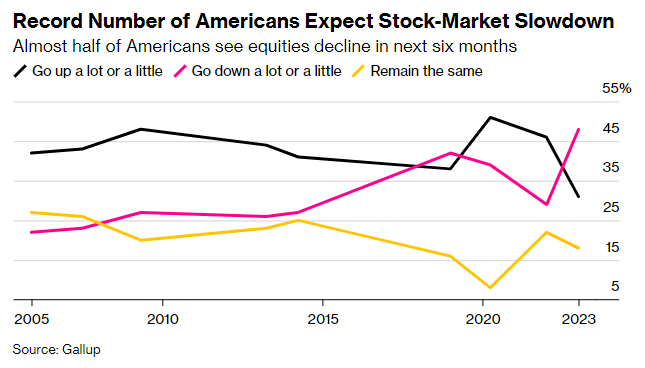
We are in need of a pause or a pullback in the major market averages, and last week’s strong jobs number, followed by the embarrassingly predictable hawkish rhetoric, is the perfect excuse to see it happen. Yet I think that will set the stage for stocks to continue climbing the wall of worry that seems to be growing taller by the day. In an annual Gallup poll conducted from January 2-22, a record number of Americans expect the stock market to fall, and a majority see an increase in the rate of inflation. That is music to this contrarian’s ears, because it should serve as fuel in the future for the uptrend in risk assets.
Bloomberg
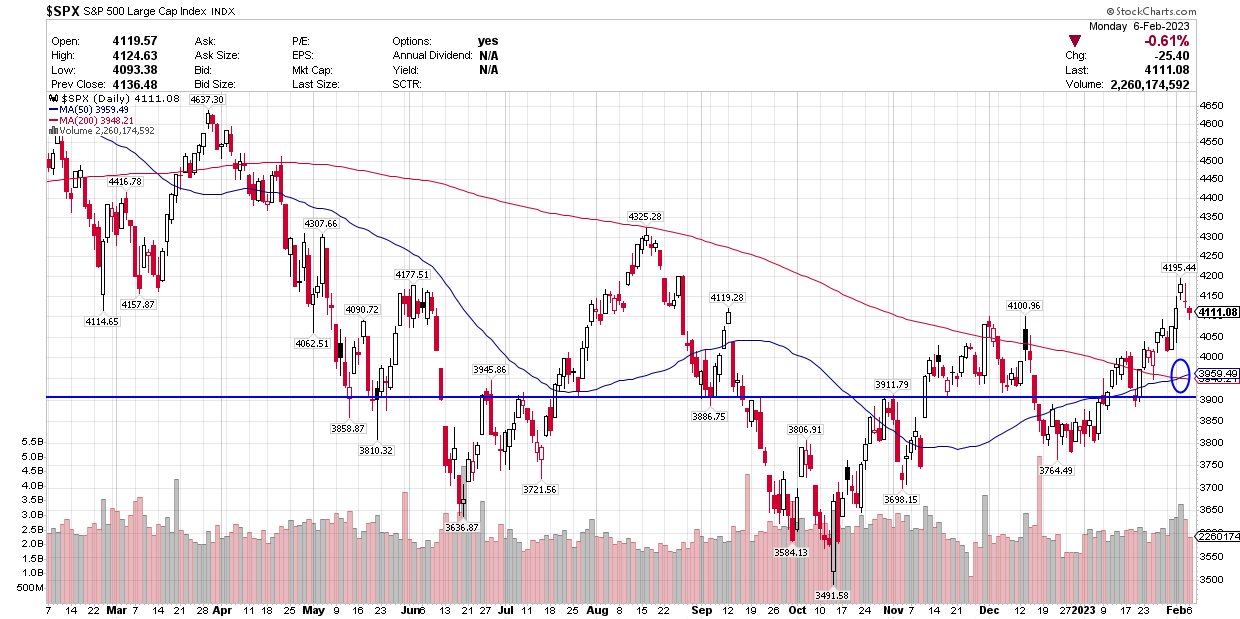
As for the pullback everyone is counting on, I think a 7% decline from last week’s peak of nearly 4,200 is reasonable. That would put the S&P 500 at approximately 3,900, which is a dip I think would be aggressively bought. I am not using valuations, which are a horrible timing tool, to arrive at that target. Instead, I am using a combination of technical analysis and the trigger point for several of the momentum indicators I discussed in January. From a technical standpoint, the S&P 500 index completed a Golden Cross last week at approximately 3,950, which is a long-term signal, but should have some short-term support relevance. That is where the rising 50-day moving average crossed above the 200-day moving average.
Stockcharts
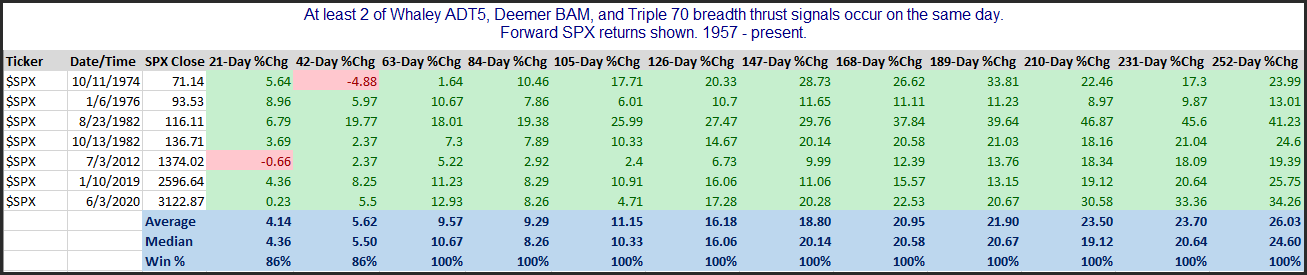
A more important level comes into play at 3,983, which is where three different breadth indicators registered buy signals at the same time on January 12 for the first time on record going back to the birth of the S&P 500 index in 1957. I have discussed Walter Deemer’s Breakaway Momentum signal in this report more than once, and it joined Wayne Whaley’s Advance Decline Thrust and Quantifiable Edges Triple 70, which I will not detail in this report. The relevance is that on the seven prior occasions when two of these have been triggered on the same day the forward monthly returns, shown in the chart below, are very compelling. The index was higher six out of seven times in the one and two month periods after the trigger, but that increased to 100% of the time from the third month on. Is this time different? Perhaps, but I think 3,983 will serve as a magnet of sorts as we move forward. It looks like we will have a positive return one month our from the trigger, which falls on Friday.
QuantifiableEdges
Therefore, I am looking at a range of 3,950 to 3,983 as somewhat of a magnet, which will not necessarily be invalidated if we temporarily dip below that range to as low as 3,900. I can see that happening over the coming month, as a pullback to refresh a market with a modestly upward bias.
Be the first to comment