


Bet_Noire
Another Prediction (Again)
I know that some readers have a hard time with me making market calls. It might be perplexing as to why I continue. I write these weekly analyses to chronicle my thoughts of last week and then look ahead for what’s coming weeks and sometimes months. It is beneficial to me as a trader to weigh the different trends, new data, and even the charts to map out the dimensions of the market movements. The benefits are obvious when I’m correct, even when events stop conforming to my outline. It helps me recognize a deviation, so I can change tactics and take advantage of new data or beat a hasty retreat. I don’t do this to display my predictive powers.
I would like to stress that the market fall may not necessarily happen this week. Furthermore, this may not be the “big one”. I seem to be ringing the same bell, but this notion rings true this week as it did last week. The market seems to be overconfident that inflation is over. If not over, then it has peaked and Powell will surely pivot by the next FOMC meeting in September. Perhaps the market is counting on the coming election in November to put a damper on further rate raises. There is some precedent for not raising going into an election. However, this is a midterm election, and the Biden administration already gave a go-ahead for the Fed to raise.
The key really is whether the Fed would be justified in raising. It would mean that there would have to be data that show higher prices. Right now, prices have cooperated, but not all the numbers are even just enough to bend the statistics in the right direction, well just as easily we can see a blip of several numbers to the upside. That and any sudden movement of the price of WTI, or NatGas, as well as the 10-year treasury, would move to 3%, and you will see a good dive in the indexes. Even the chart is broadcasting vulnerability to the downside.
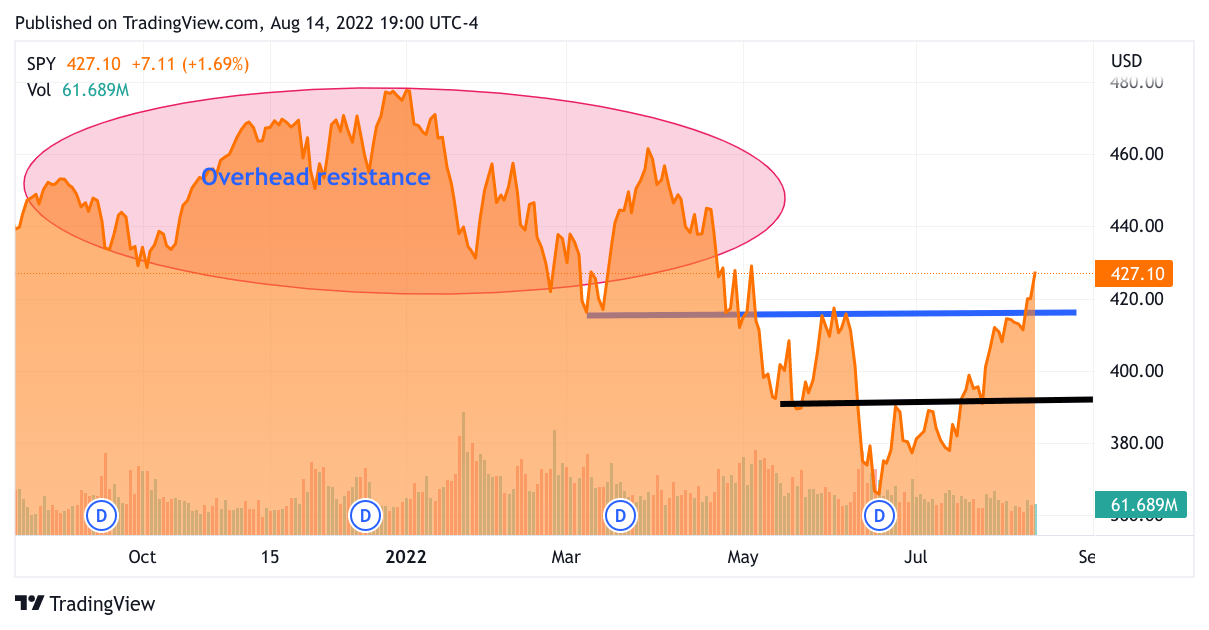
So what would that look like? The chart can tell a story, let’s see.
Tradingview
The above is a one-year chart of the S&P 500 ETF (SPY). The numbers are a bit off from the actual S&P 500 which closed at 2781. The basic pattern is correct, the S&P leaped 130 points last week. You can see that last finger on the right of the chart, a gentler slope would show a more sustainable trajectory. The oval on the upper left that I labeled “overhead resistance” will offer a barrier that will demand a great deal of buying enthusiasm to overcome. What do I mean by overhead resistance? Very simply, the buyers of May have been stuck there for about 4 months and many are anxious to get back to even. So the closer the index moves to these stranded shares, those stranded buyers will be selling. Moreover, there are plenty of early buyers of this rally that got in under 3900 or lower and would be tempted to sell and capture their profits. More sellers would come out of the woodwork the moment the rally seems to be losing its bullish energy. So what is the catalyst to make that happen? The FOMC minutes will be released on Wednesday at 2 PM. This would be a good opportunity for market participants to gauge the Fed’s bona fides as an inflation fighter. Maybe some will rethink the vaunted “Fed Pivot” which entails the Fed to be lowering interest rates by early 2023. I don’t think that will be the catalyst to take the S&P 500 significantly, perhaps we will give up the gains of last week.
The good news is that there is a relatively narrow window for a steep selloff.
The window for a sell-off this year is fairly narrow. The record for election-year rallies is actually quite strong, so September and October are where the bear can strike. So the scenario of a rise in interest rates for September is already set in stone. A rise in October would have to come with some signaling from the Fed. Still, it seems that the economy has been taking rate rises in stride. What might not be as clear is the rise in interest rate effect has a delay before it bites. Also, the Fed piled up some strong rises, with an unprecedented in recent history two 0.75% raises in a row. I think that by October we will see the effects of an economy that will be sputtering, probably zero to 1% growth. That will be enough to press the indexes down to previous lows, perhaps right to 3650. I am not even adding the effect of a resurgent price of WTI Oil. Recall that the SPR – Strategic Oil Reserve distribution will end in October. The price of oil will likely take that into account in October. You can keep your eyes peeled for “backwardation” in prices. This means that oil futures that the price of the following month is higher than the “Front Month”, which foretells higher prices. Right now, we see pricing for September as the front month, so look for the October future if it is higher now. The cash price for oil is about to go higher. This Friday for about 10 minutes I saw backwardation, perhaps it was my imagination. I know I will be looking for that again. As far as this week having a selloff, I have one more thing that I found very eye-opening at the end of last week, and that was the VIX. The VIX has been trading under 20! It has been months since the VIX was that low. On the one hand, as the VIX moves down, it shows that the market is feeling very positive. The other way of looking at it is that the market is getting complacent.
So let me wrap this up for you regarding this week
I believe that the market has made assumptions about the direction of the Fed that is just not accurate. Market participants are very sensitive to the interest rate. Even a little thrust just out of random fluctuation for the 10-year inching toward 3% could cause a strong sell-off. Wednesday at 2 pm, the Fed minutes of last month will be published. I am fairly confident that market participants will be taken down a notch regarding the Fed “Pivot”. So Wednesday can give us a preview of what will happen sometime next month or perhaps October. What to do?
My Trades
I am being mindful of cash right now, according to the simple rules of the Cash Management Discipline. Right now, I am maintaining about 15%, in order to start a new position, I will sell part of other positions to pay for it. My goal is to build up 30% going into the fall to prepare for the possibility of that sharp sell-off. The next step is hedging, right now, I am leaning against the VIX, via UVXY. This week, I will be studying the best way to short the Nasdaq 100.
In addition to Haleon (HLN) equity, I went long HLN Calls for February 23 at a $7.5 strike
I started a position in Akamai (AKAM), I think AKAM would be a great addition to Oracle (ORCL). AKAM has relatively new initiatives in cybersecurity and cloud computing that will reignite growth.
I added to my Axcelis (ACLS) position. ACLS is making chip equipment for ion implantation to modify silicon substrates to enhance performance.
I substantially added to my Bluebird Bio (BLUE) this week. I often mention that I avoid biotech names. I like the newsflow and price action of BLUE.
I started a position in KLA Tencor (KLAC), a major provider of semiconductor manufacturing equipment.
I started a position in CSX Corp (CSX). CSX is a railroad company. If CSX sells off, I will add to it, though I expect it to hold up well to selling.
I opened a position in Taiwan Semiconductor (TSM) while Nancy Pelosi was in Taipei and China was furiously saber-rattling, and that affected the stock. It is now recovering, creating a bit of alpha right now.
I started a position in WolfSpeed (WOLF). I have WOLF in my long-term account. Now I am creating a position in my slow money trading account.
The main change in my trading practice right now is that I am building cash and formulating a hedging approach to prepare for the possibility of a market selloff on Wednesday.
Be the first to comment