

RHJ/iStock via Getty Images Own Processing
Precious metals royalty and streaming companies represent a very interesting sub-industry of the precious metals mining industry. They provide some leverage to the growing metals prices, similar to the typical mining companies; however, they are less risky in comparison to them. Their incomes are derived from royalty and streaming agreements. Under a metal streaming agreement, the streaming company provides an upfront payment to acquire the right to future deliveries of a predefined percentage of metal production of a mining operation.
The streaming company also pays some ongoing payments that are usually well below the market price of the metal. They can be set as a fixed sum (e.g., $300/toz gold) or as a percentage (e.g., 20% of the prevailing gold price), or a combination of both (e.g., the lower of a) $300/toz gold and b) 20% of the prevailing gold price). The royalties usually apply to a small fraction of the mining project production (usually 1-3%), and they are not connected with ongoing payments. They can have various forms, but the most common is a small percentage of the net smelter return (“NSR”). The NSR is calculated as revenues from the sale of the mined products minus transportation and refining costs.
To better track the overall performance of the whole sub-industry, I created a capitalization-weighted index (the Precious Metals Royalty and Streaming Index) consisting of 11 companies (in June 2020, expanded to 15). Later, based on the inquiries of readers, I also introduced an equal-weighted version of the index. Until March 2021, both indices included the same companies and were calculated back to January 2019.
However, some major changes occurred in April 2021. Due to the boom of the royalty and streaming industry and the emergence of many new companies, the indices experienced two major changes. First of all, the market capitalization-weighted index was modified to include only the 5 biggest companies: Franco-Nevada (FNV), Wheaton Precious Metals (WPM), Royal Gold (RGLD), Osisko Gold Royalties (OR), and Sandstorm Gold (SAND). The combined weight of these 5 companies on the old index was around 95%, therefore, the small companies had only a negligible impact on their performance. The values of the index were re-calculated back to January 2019, and between January 2019 and March 2021, the difference in the overall performance of the old and the new index was only 2.29 percentage points. The second change is related to the equally weighted index that was expanded to 20 companies.
The previous editions of the monthly report can be found here: May 2019, June 2019, July 2019, August 2019, September 2019, October 2019, November 2019, December 2019, January 2020, February 2020, March 2020, April 2020, May 2020, June 2020, July 2020, August 2020, September 2020, October 2020, November 2020, December 2020, January 2021, February 2021, March 2021, April 2021, May 2021, June 2021, July 2021, August 2021, September 2021, October 2021, November 2021, December 2021.
Own Processing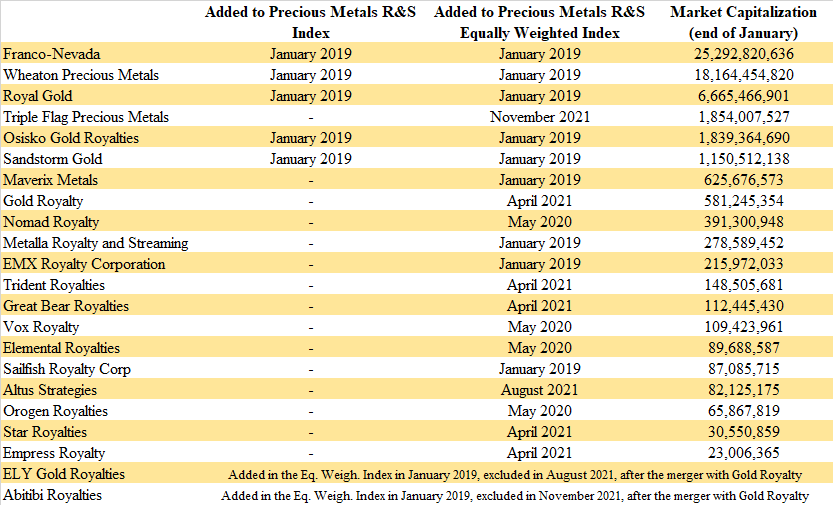
The precious metals R&S industry remains dominated by Franco-Nevada, Wheaton Precious Metals, and Royal Gold, and this won’t change anytime soon. However, some movements occurred in the ranking just below the top three. As Triple Flag Precious Metals (OTCPK:TRFPF) outperformed Osisko Gold Royalties (or better said, Osisko underperformed Triple Flag), Triple Flag became the fourth biggest precious metals R&S company by market capitalization. At the bottom of the ranking remain Star Royalties (OTCQX:STRFF) and Empress Royalty (OTCQB:EMPYF), with market capitalizations of $30.6 million and $23 million respectively.
Own Processing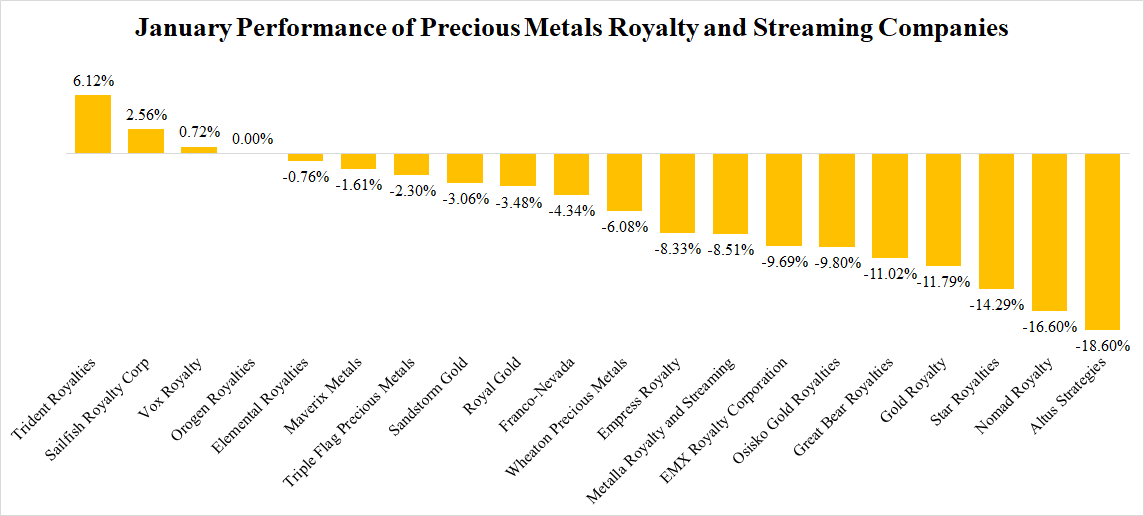
Only three out of the twenty companies experienced share price growth, and one company remained flat in January. All the remaining 16 companies ended the month in red numbers. The best performance was recorded by Trident Royalties (OTCPK:TDTRF). Its share price grew by more than 6% when investors appreciated the first revenues generated by the recently acquired portfolio of offtake agreements, as well as a very interesting acquisition of another lithium royalty. On the other hand, the biggest decline in share price, by nearly 19%, experienced Altus Strategies (OTCQX:ALTUF). Surprisingly, the losses were recorded over the last days of January, after Altus released some quite good drill results from one of its projects. Nomad Royalty (NSR) experienced a 17% decline, initiated by the C$42.5 million bought deal financing. Star Royalties declined by 14%, which is quite surprising, as it made another two acquisitions further expanding its green portfolio, and the carbon credit prices hit new record highs.
Own Processing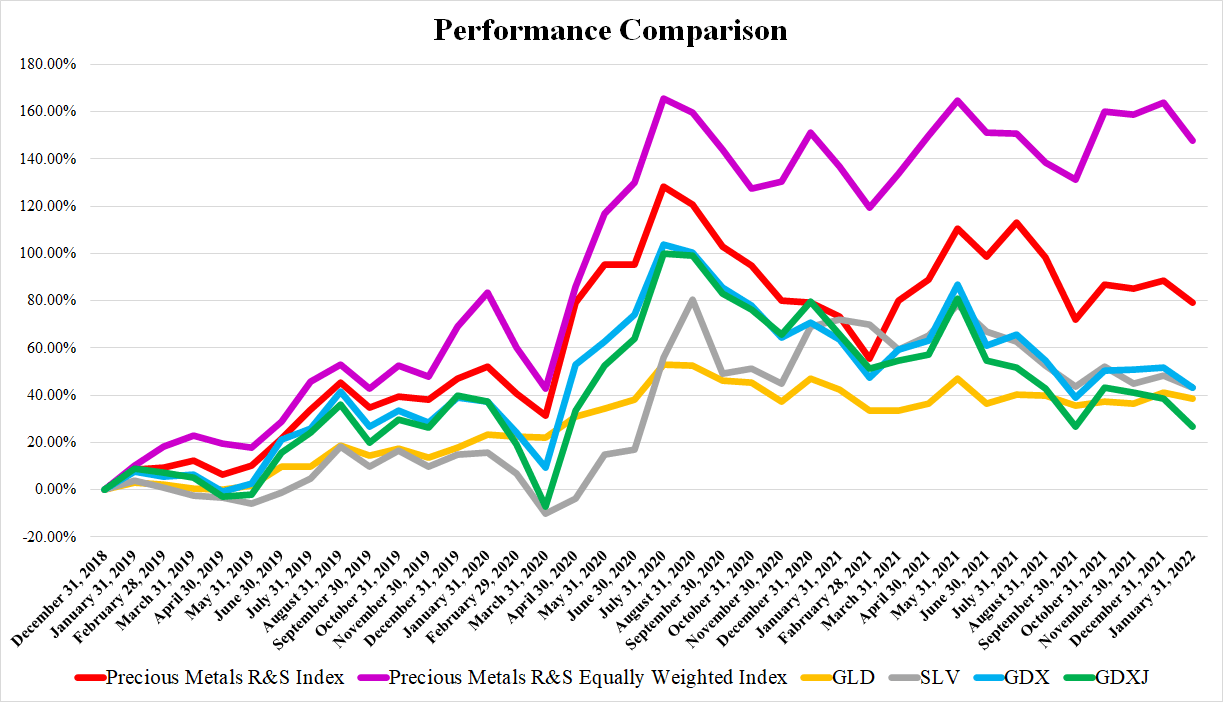
The month of January didn’t end up well for the precious metals royalty & streaming companies, and for the precious metals mining industry as a whole. The gold price represented by the SPDR Gold Trust ETF (GLD) declined by 1.68%, and the share price of the iShares Silver Trust ETF (SLV) declined by 3.3%. The share price of the VanEck Vectors Gold Miners ETF (GDX) decreased by 5.62%, and shares of the VanEck Vectors Junior Gold Miners ETF (GDXJ) lost as much as 8.59% of their value. The R&S companies didn’t do much better. The Precious Metals R&S Index recorded 5.01% and the Precious Metals R&S Equally Weighted Index even 6.04% losses.
Correlations and Volatility
In comparison to December, the average correlation of the R&S companies with GLD, GDX, and GDXJ increased, while the correlation with SLV and SPY decreased. Especially Wheaton Precious Metals, Royal Gold, Osisko Gold Royalties, and Sandstorm Gold maintain a very high positive correlation with GDX and GDXJ, close to 0.9 and above. On the other hand, Trident Royalties, Altus Strategies, and Orogen Royalties showed a weak negative correlation or weak positive correlation with GLD, SLV, GDX, GDXJ, and also SPY. It shows that the bigger players remain more affected by the broader market developments, while the small players feel more impacts from other factors.
Own Processing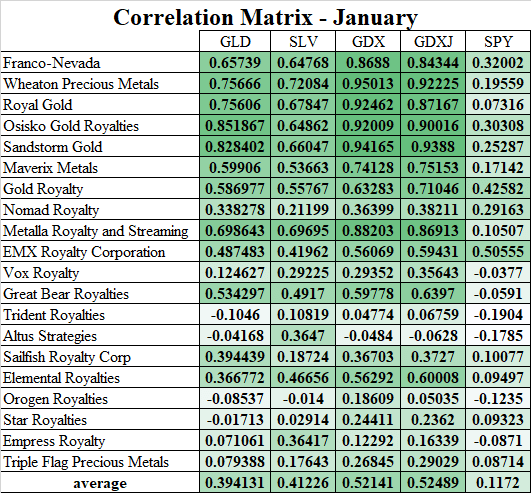
The chart below shows the comparison of January volatilities of individual R&S companies, measured as an average of absolute values of daily stock returns for the period. There are not as extreme values as in December when Altus Strategies and Empress Royalty experienced volatility of 8.13% and 4.99% respectively. Also the average volatility decreased slightly. While in December, the average for the 20 R&S companies equaled 2.66%, in January, the value decreased to 2.54%. As usual, the lowest volatilities were recorded by the big players, like Royal Gold, Franco-Nevada, or Wheaton Precious Metals. And quite surprisingly, also by Sailfish (OTCQX:SROYF) and Orogen (OTCQX:OGNRF).
Own Processing
The Valuation Metrics
There are numerous valuation metrics that can be used to compare the current market valuation of different companies and that can help to determine which one of them offers better value. However, every one of them has its plusses and minuses. Therefore, the charts below compare the valuation of the precious metals R&S companies using four different valuation metrics. Namely, price-to-revenues ratio, price-to-operating cash flow ratio, and price-to-earnings ratio. For each indicator, there are two alternatives, one is based on annualized Q3 data and the second one on TTM data. The annualized data from the latest quarter should better reflect the growth of the company. On the other hand, they cannot capture the seasonal fluctuations in production and financial results. The price-to-book ratio value is calculated using the Q3 data. Of course, the charts contain only companies where the ratios are reasonable (negative values were excluded).
Source: Own processing, using data of Seeking Alpha and Yahoo Finance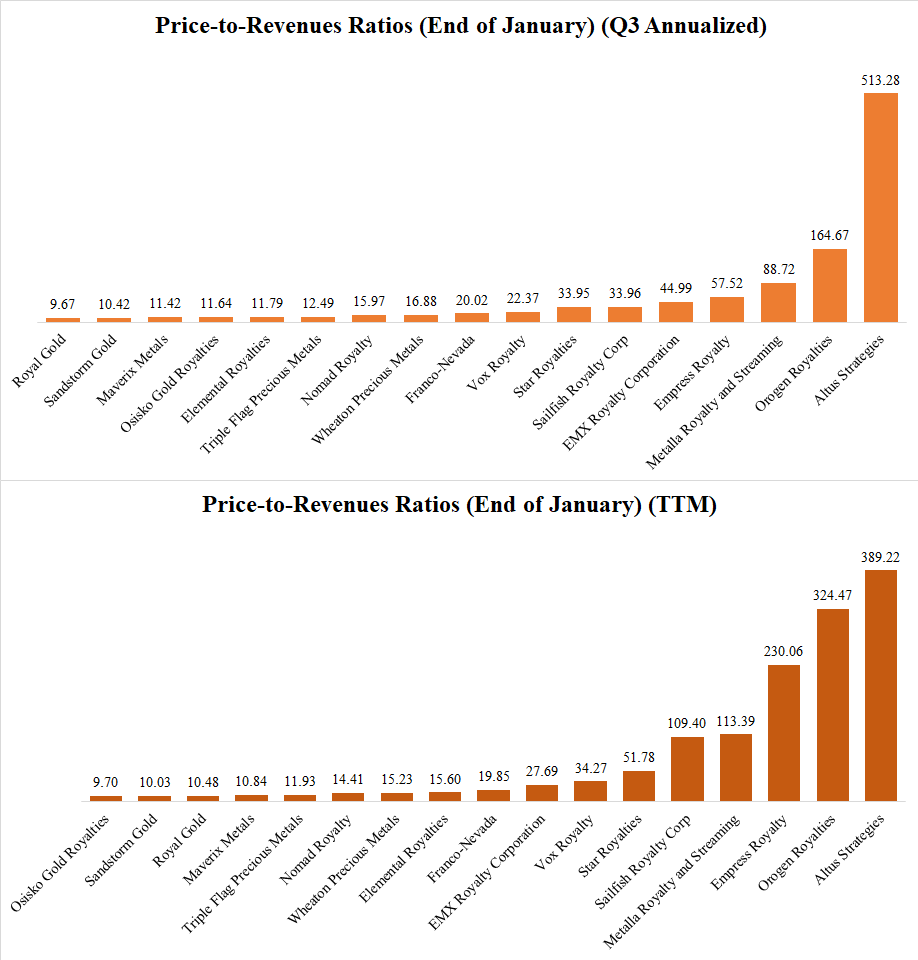
In terms of the annualized Q3 results, the lowest price-to-revenues ratio has Royal Gold, which is the only company with a single-digit value. Slightly above the 10-mark is Sandstorm Gold, followed by Maverix Metals (MMX) and Osisko Gold Royalties. On the other hand, the highest ratio, more than 513, can be seen at Altus Strategies that reported revenues of only $40,000 in Q3. On a TTM basis, the lowest price-to-revenues ratio maintains Osisko Royalties (9.7), followed by Sandstorm Gold (10.03), and Royal Gold (10.48).
Source: Own processing, using data of Seeking Alpha and Yahoo Finance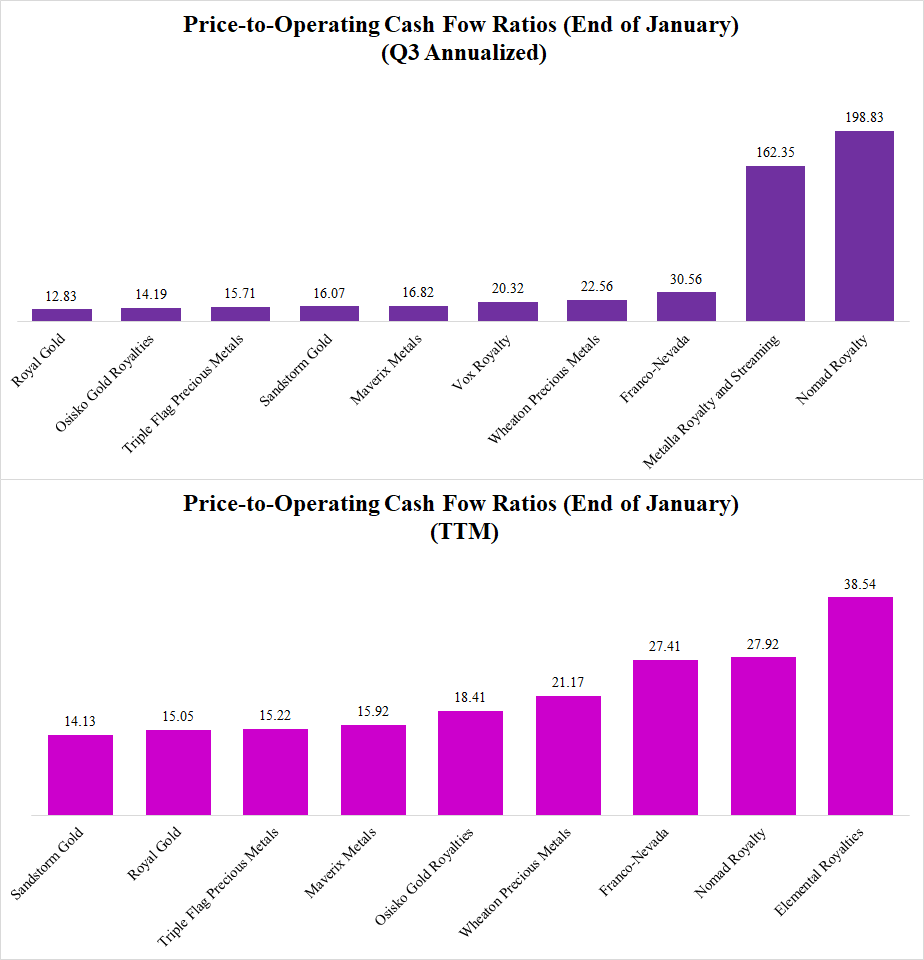
Royal Gold is the cheapest out of the tracked companies also when looking at the annualized Q3 operating cash flows and the price-to-operating cash flow ratio. Royal Gold stands at 12.83, followed by Osisko Gold Royalties (14.19) and Triple Flag Precious Metals (15.71). The highest values, well above 100, even approaching 200, can be seen at Metalla (MTA) and Nomad. When looking at the TTM operating cash flows, the lowest price-to-operating cash flow ratio has Sandstorm Gold (14.13), followed by Royal Gold (15.05) and Triple Flag Precious Metals (15.22).
Source: Own processing, using data of Seeking Alpha and Yahoo Finance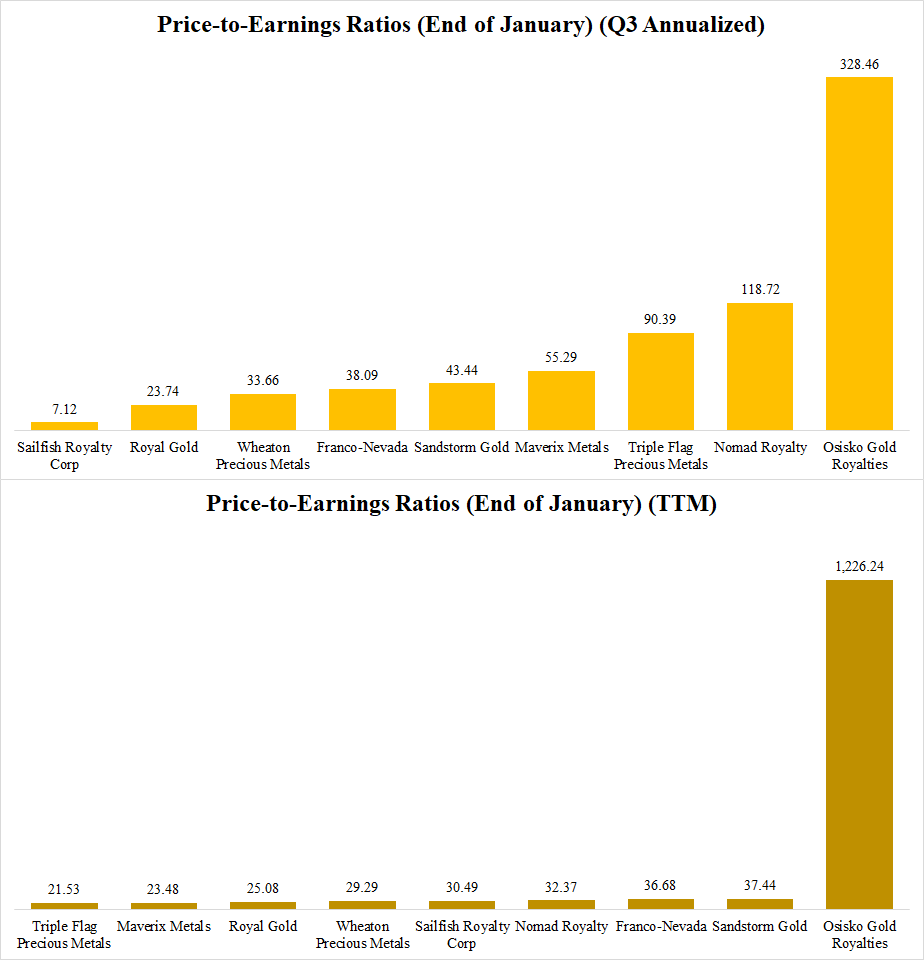
The lowest annualized price-to-earnings ratio, only 7.12, has Sailfish Royalty. However, its Q3 net income was inflated by the sale of the Tocanzintinho royalty. Not including Sailfish, the lowest P/E ratio by far has Royal Gold (23.74), followed by Wheaton Precious Metals (33.66) and Franco-Nevada (38.09). As can be seen, Sailfish’s TTM P/E ratio is 30.49. In this case, the lowest value can be seen at Triple Flag (21.53), Maverix Metals (23.48), and Royal Gold (25.08). Osisko Gold Royalties has the highest P/E ratio on the annualized, as well as the TTM basis. The reason is the big net loss in Q2 (-$11.9 million), and the low net income in Q3 ($1.4 million).
Source: Own processing, using data of Seeking Alpha and Yahoo Finance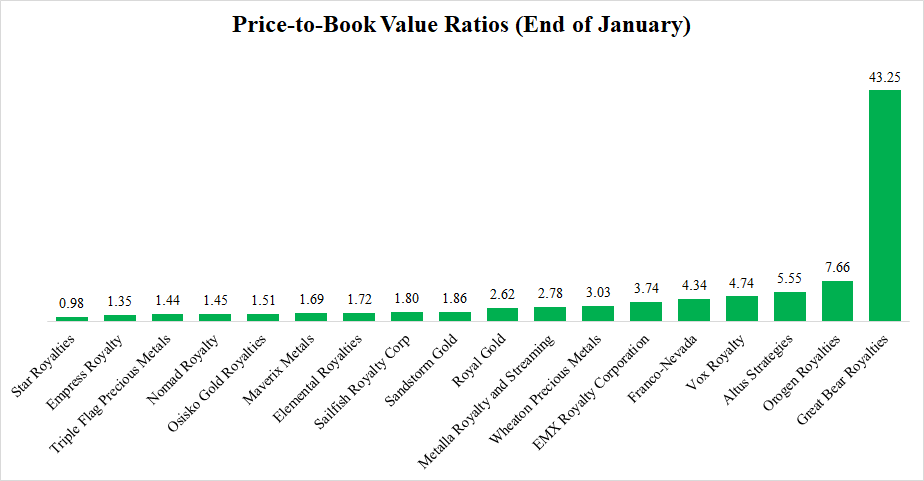
The lowest price-to-book ratio has Star Royalties. As of January 31, it was slightly below 1. Star is followed by Empress Royalty (1.35), and Triple Flag Precious Metals (1.44). On the other hand, the highest price-to-book ratio, as high as 43.25, has Great Bear Royalties. This should change after the maiden resource estimate for the Dixie project is announced, however, its timing is questionable due to the ongoing acquisition of Great Bear Resources (OTCQX:GTBDF) by Kinross (KGC).
To aggregate the data provided by the four abovementioned valuation metrics, I applied a simple scoring method, where points are attributed to each company in reverse order. It means that a company with the lowest price-to-revenues ratio receives 20 points, a company with the second-lowest price-to-revenues ratio receives 19 points, etc. In the case of the price-to-revenues, price-to-operating cash flow, and price-to-earnings ratios, an average of points obtained for the annualized and TTM version is calculated. Subsequently, points received for each of the four valuation metrics are summed up and multiplied by a coefficient of 1.25, so that the maximum value of points that can be obtained equals 100. The chart below shows the results of this method for companies with at least 3 non-negative metrics (for example Empress Royalty is not included, as it has negative price-to-operating cash flow, as well as the price-to-earnings ratio, which means that it has only 2 non-negative metrics).
Source: Own processing, using data of Seeking Alpha and Yahoo Finance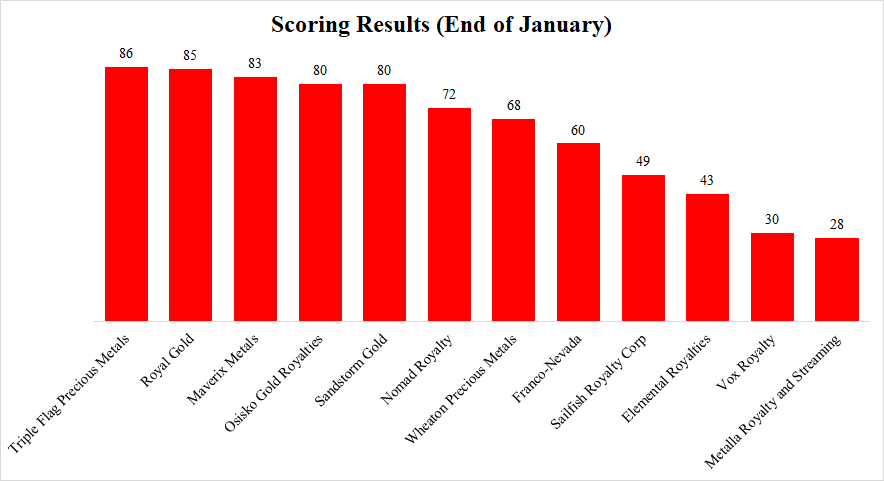
Similar to November and December, the highest score reached Triple Flag. However, in comparison to December, it experienced a decline from 88 to 86 points. Royal Gold follows with 85 points (compared to 84 points in December). The 80-point mark was reached also by Maverix Metals, Osisko Gold Royalties, and Sandstorm Gold. On the other hand, out of the 12 companies that made it to the final ranking, the lowest score recorded Vox Royalty (OTCQX:VOXCF) (30) and Metalla (28). But both companies recorded a 1-point gain compared to December.
Dividends
In January, the list of dividend-paying precious metals R&S companies grew to 10. The initial dividend was declared by Gold Royalty (GROY). However, its quarterly dividend equals only $0.01, which means a dividend yield of only 0.92% at the current share price. It is the lowest dividend yield out of the 10 dividend-paying companies. The highest dividend yield, nearly 4.2%, offers Sailfish Royalty.
Own Processing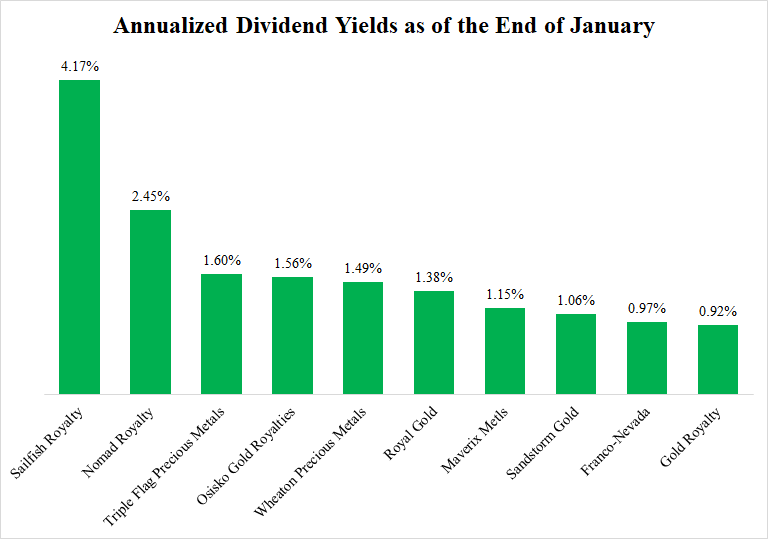
As many as 5 companies paid dividends in January. Right now, there are no dividend payments scheduled for February. However, Franco-Nevada and Gold Royalty set their dividend payment dates on March 31.
Own Processing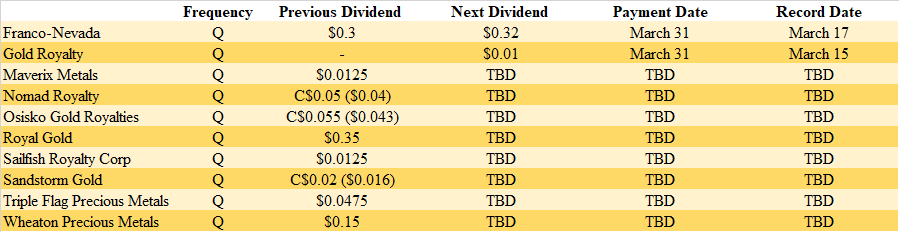
The January News
The number of new deals, as well as their size, declined in comparison to December. However, some companies made very interesting acquisitions. Especially Trident’s acquisition of an indirect 1.5% Gross Royalty over the Sonora Lithium Project in Mexico, and Vox’s acquisition of the royalty on Sibanye’s Limpopo project look really good.
Franco-Nevada (FNV) increased its quarterly dividend from $0.3 to $0.32. It equals $1.28 per annum, and at the current share price, the annualized dividend yield equals 1%. The dividend will be paid on March 31, to shareholders of record as of March 17. The company also announced that it will release its Q4 financial results on March 9.
Wheaton Precious Metals (WPM) made a $175.5 million acquisition of a 50% gold and 75% silver stream on Adventure Mining’s Curipamba project. After 150,000 toz gold is delivered, the gold stream will be reduced to 33%. After 4.6 million toz silver is delivered, the silver stream will be reduced to 50%. The ongoing payments will equal 18% of the prevailing gold and silver spot prices. But after the value of delivered gold and silver minus the sum of ongoing payments climbs to match the value of the upfront payment, the ongoing payments will increase to 22% of the prevailing gold and silver prices. A detailed analysis of this deal can be found here.
Royal Gold (RGLD) announced that it sold 45,600 toz gold, 715,100 toz silver, and 1,300 tonnes copper, or 61,700 toz of gold equivalent in Q4. It means a 4% decline compared to the previous quarter. Royal Gold will release its Q4 financial results on February 16.
Triple Flag Precious Metals (OTCPK:TRFPF) reported that its Q4 sales amounted to 20,605 toz of gold equivalent. The total 2021 sales amounted to 83,602 toz of gold equivalent, which is above the guidance of 80,000-83,000 toz. Compared to 2020, the attributable production grew by nearly 33%. Triple Flag will release its Q4 financial results on February 22.
Osisko Gold Royalties (OR) recorded attributable production of 19,830 toz of gold equivalent in Q4 2021. It is slightly less than in Q3 (20,032 toz of gold equivalent). The total 2021 attributable production equaled 80,000 toz of gold equivalent. Osisko will release its Q4 financial results on February 24.
On January 25, Osisko announced an up to $40 million acquisition of an up to 5% gold stream on the high-grade Trixie gold mine. This deal is a part of Osisko Development’s acquisition of Tintic Consolidated Metals, the operator of Trixie. Trixie is a small mining operation with very high gold grades. There are plans for its expansion to 100,000 toz gold per year, however, a resource estimate has yet to be released. A detailed analysis of this deal can be found here.
Sandstorm Gold (SAND) announced that its Q4 sales equaled 16,600 toz of gold equivalent and the overall 2021 sales equaled 67,500 toz of gold equivalent, which represents a significant improvement compared to the sales of 52,176 toz of gold equivalent recorded in 2020, and 63,829 toz of gold equivalent recorded in 2019.
Gold Royalty (GROY) commenced the formal offer to acquire Elemental Royalties. The offer should be valid until April 27. However, Elemental is still resisting and its management keeps on stressing the shareholders not to accept the offer.
The company also announced an inaugural dividend of $0.01 per quarter.* The first payment is due on March 31, to shareholders of record as of March 15. At the current share price, the dividend yield equals 0.92%.
On January 24, Gold Royalty announced that it entered an agreement for a secured revolving facility of $10 million, with an accordion feature providing another $15 million.
Nomad Royalty (NSR) made a C$42.5 million ($33.4 million) equity financing consisting of 4.675 million shares issued at a price of C$9.1 ($7.14). The proceeds should help to fund the recently announced acquisitions of the Greenstone and Platreef streams.
EMX Royalties (EMX) was pretty active especially towards the end of January. On January 4, EMX announced the discovery of several gold and cobalt exploration targets on its Mt. Steadman and Yarrol projects. Some of the targets are still open for expansion. Further geochemical sampling programs followed by an initial drill campaign are projected for the two Australian projects this year.
On January 25, EMX announced an extension of the $44 million Sprott credit facility to December 31, 2024, and an amendment of the voluntary prepayment rights.
On January 26, EMX optioned the Robber Gulch project to Ridgeline Exploration Corporation. Ridgeline will have the right to acquire 100% of the property by paying $750,000 over the 5-year option period, issuing 150,000 shares for EMX over the next 2 years, and expending $650,000 on exploration over the next 5 years. EMX will retain a 3.25% NSR royalty of which, Ridgeline will have an option to repurchase 1% for $1.5 million, and 0.5% for $2 million. Ridgeline will also make milestone payments of $0.25 million, $0.5 million, and $1 million, upon the completion of PEA, PFS, and FS.
And on January 27, EMX announced the suspension of filing of Notice of Arbitration to Zijin Mining Group Ltd. The reason is that the companies are in negotiations with an aim to find a “mutually acceptable resolution”. Unfortunately, no additional information has been provided yet.
Trident Royalties (OTCPK:TDTRF) completed the acquisition of the gold offtake streams portfolio announced in December. Moreover, its recently acquired portfolio of offtake agreements generated the first revenues, when Trident acquired 1,858 toz gold that was later sold with a margin of $30.68/toz, generating cash flows of $57,001.
On January 27, Trident announced a very interesting $26 million acquisition of an indirect 1.5% Gross Royalty over the Sonora Lithium Project in Mexico. At the current lithium prices, the royalty should generate approximately $14.4 million per year during Stage 1 and $28.9 million per year over Stage 2 operations. The mine construction should be completed in Q4 2023.
Vox Royalty (OTCQX:VOXCF) announced a very interesting acquisition too. It will pay C$10.4 million for two royalties (a 1% Gross Receipt Royalty and a 0.704% Gross Receipt Royalty) together covering Sibanye Stillwater’s (SBSW) Limpopo project, with a past-producing PGM mine, and measured, indicated, and inferred resources of 36 million toz of platinum, palladium, rhodium, and gold. Sibanye is evaluating the development options and it is believed that the mine will be put back in production over the next 5 years.
Elemental Royalties (OTCQX:ELEMF) announced that it expects the Q4 revenues from its Karlawinda royalty to amount to $1.1 million. Moreover, Elemental’s Board of Directors recommended the shareholders to reject Gold Royalties’ takeover offer.
Orogen Royalties (OTCQX:OGNRF) optioned its Si2 gold project to K2 Gold Corporation (OTCQB:KTGDF). K2 will be able to acquire 100% of the project by paying Orogen $2.5 million, spending on the property $2.5 million over the next 5 years, and granting orogen a 2% NSR royalty on the property.
The company also provided an update regarding its project generating activities. In 2021, its partners funded $3.2 million and drilled 6,350 meters. The income from share and cash payments and management fees amounted to $1.9 million. Orogen expects 7 partner-funded drill campaigns in 2022.
And on January 31, Orogen announced that Brian Massey will become the CEO of its spinout company that will hold the Ball Creek copper-porphyry project. Massey was Vice President of Investor Relations, for BHP, and it has also experiences from Rio Tinto (RIO) and Turquoise Hill Resources (TRQ).
Altus Strategies (OTCQX:ALTUF) announced an amendment to its JV agreement with Marvel Gold (OTCPK:GRXMF). The JV will include the Tabakorole gold project and two contiguous gold licenses now. Marvel will hold a 70% interest in the JV that can be increased to 80% by sole funding the definitive feasibility study. Altus holds the remaining 30% of the JV and a 2.5% NSR royalty on the properties. Marvel has an option to repurchase 1.5% NSR royalty for up to $15 million.
The company also released some very good drill results from its 100%-owned Diba & Lakanfla gold project. The best intersections include 8.74 g/t gold over 7 meters, 4.76 g/t gold over 12 meters, or 1.16 g/t gold over 29 meters.
Star Royalties (OTCQX:STRFF) announced the acquisition of a 2.5% gross revenue royalty on Diesel Displacement Technology Company named MOBISMART. The royalty applies to all current and future revenues, and potential business divestment revenues. Green Star pays C$300,000 for the royalty, however, MOBISMART will have an option to repurchase it for C$10 million. The royalty has a term of 15 years.
Star also paid C$600,000 to increase its gross revenue royalty on carbon offset credits from Elizabeth Metis Settlement Forest from 13.5% to 40.5%.
Empress Royalty (OTCQB:EMPYF) paid $1 million to increase its royalty on the Manica gold project from 2.25% to 3.375%. Empress also confirmed that Manica is on track to commence production in Q2.
The February Outlook
The stock market stopped falling and started growing again. Also the gold price recovered slightly and returned above $1,800/toz. If the recent trend prevails, also the R&S companies should do well. Besides the broader market conditions, the earnings season may impact some of the companies. For now, Royal Gold, Triple Flag, and Osisko have earnings releases scheduled for February.
Editor’s Note: This article covers one or more microcap stocks. Please be aware of the risks associated with these stocks.
Be the first to comment