

marekuliasz/iStock Editorial via Getty Images
Article coproduced with Dividend Sensei.
This bear market has been a great example of how the market can surprise even investment veterans. It’s been both historic and completely predictable.
We’ve seen some of the largest monthly slides in history, including a 13% market decline in April.
In the year’s first half, the 20% S&P decline was the 11th worst in history. According to Goldman Sachs, the annualized inflation-adjusted returns were the worst in 150 years.
And the bond bear market we saw this year was the worst since 1788, a truly historic time of fear for fixed income investors.
Yet throughout all this chaos, corporate earnings kept growing, and we created 2.6 million jobs. Consumers kept spending, and great businesses kept doing what they always do, adapting and overcoming challenges.
The peak decline in the S&P is 24%, which is perfectly average for non-recessionary bear markets. If we get a recession the blue-chip consensus is that we bottom at -30% to -40%, again perfectly average.
No company in history has made investors money because nothing bad happened, but despite something bad always happening.
It’s always and forever a market of stocks, not a stock market. Great businesses with proven track records of growing income and wealth have been beaten down to absurd levels, many already pricing in a recession.
Today we wanted to highlight Polaris Inc. (NYSE:PII), a hyper-growth Ultra SWAN (sleep well at night) dividend aristocrat offering exceptional long-term investing potential.
Let me show you four reasons why Polaris can not only potentially triple your money in the next five years but possibly help you achieve life-changing returns that can help you retire in safety and splendor.
Reason One: Polaris Is The Complete Hyper-Growth Aristocrat Package
Here is the bottom line on Polaris.
Reasons To Potentially Buy PII Today
-
91% quality low-risk 13/13 Ultra SWAN dividend champion
-
the 79th highest quality company on the Master List (84th percentile)
-
90% dividend safety score
-
27-year dividend growth streak
-
2.2% very safe yield
-
0.5% average recession dividend cut risk
-
1.5% severe recession dividend cut risk
-
35% historically undervalued (potential very strong buy, rounds to an Ultra Value Buffett-style “fat pitch” buy)
-
Fair Value: $178.96 (16.9 PE)
-
11.1X forward earnings vs. 16.6X to 18X historical
-
8.1X cash-adjusted earnings = anti-bubble hyper-growth aristocrat
-
Effective A- stable outlook credit rating = 2.5% 30-year bankruptcy risk = strongest balance sheet in corporate America
-
61st industry percentile risk management consensus = above-average, low risk
-
11% to 18% CAGR margin-of-error growth consensus range
-
15.0% CAGR median growth consensus
-
5-year consensus total return potential: 19% to 26% CAGR
-
base-case 5-year consensus return potential: 22% CAGR (5X more than the S&P consensus)
-
consensus 12-month total return forecast: 9%
-
Fundamentally Justified 12-Month Returns: 55% CAGR.
Polaris Might Have Priced In A Mild Recession Already
PII bottomed at about -30% in late April and has refused to go any lower, even as the market kept falling.
FAST Graphs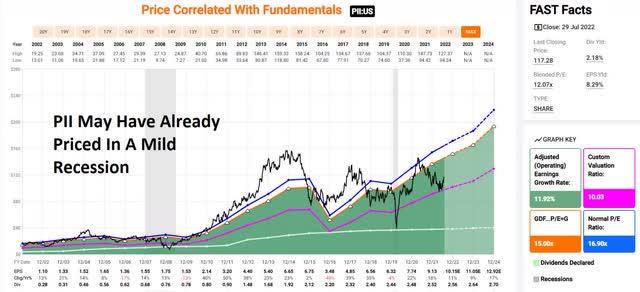
PII bottomed at 10X earnings in late April and has refused to go lower even as the market kept falling. Barring a severe recession, that might have been the final bottom. 11X earnings now, 8.1X cash-adjusted earnings.
-
EPS growth 0% in the Great Recession
-
EPS growth +22% in the Pandemic
-
+11% average EPS growth during the 2 worst recessions in US history
-
not as cyclical a business as you might think.
This might be a good choice for anyone who wants Ultra SWAN aristocrat quality with hyper-growth potential and doesn’t want to catch a falling knife.
PII Rolling Returns Since October 1987
PII’s average 15-year rolling return of 18% is similar to the anticipated 17.2% long-term analyst consensus.
-
Management’s LT total guidance is 12.2+%.
From bear market lows, PII is capable of as much as 28.5% returns for the next 15 years and 33% for the next 10 years.
-
17X over 10 years
-
43X over 15 years
PII Medium-Term Growth Consensus
|
Metric |
2020 Growth |
2021 Growth |
2022 Growth Consensus |
2023 Growth Consensus |
2024 Growth Consensus |
|
Sales |
3% |
16% |
8% |
4% |
4% |
|
Dividend |
2% |
2% |
2% (Official) |
4% |
2% |
|
EPS |
22% |
18% |
11% |
9% |
17% |
|
Operating Cash Flow |
62% |
-68% |
135% |
18% |
39% |
|
Free Cash Flow |
98% |
-101% |
10256% |
32% |
30% |
|
EBITDA |
21% |
15% |
25% |
8% |
0% |
|
EBIT (operating income) |
27% |
27% |
26% |
13% |
4% |
(Source: FAST Graphs, FactSet)
PII isn’t expected to grow the dividend very quickly, instead focusing on reducing the payout ratio and reinvesting the space cash into future growth.
Its cash flow is expected to grow at over 30% annually through 2024.
-
even with a potential mild recession coming soon
PII 2024 Consensus Total Return Potential
FAST Graphs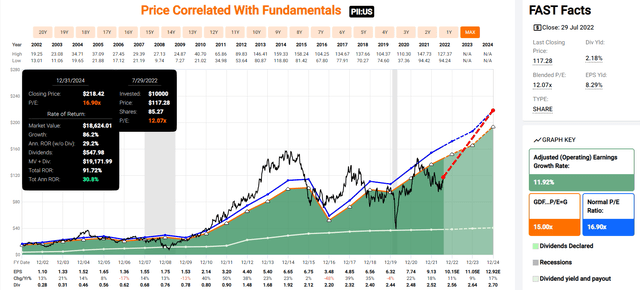
If PII grows as analysts expect through 2024 and returns to historical fair value, it could deliver 92% total returns or 31% annually.
-
Buffett-like return potential from an anti-bubble aristocrat bargain hiding in plain sight
Now compare that to the S&P 500 consensus.
S&P 2024 Consensus Total Return Potential: Analysts expect about 24% or 9% annual returns from the S&P 500 over the next 2.5 years.
-
PII is capable of 4.5X these returns
PII 2027 Consensus Total Return Potential
Fast Graphs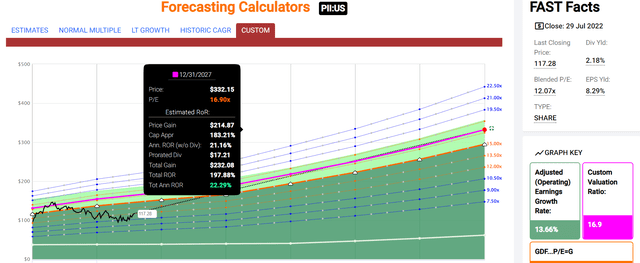
Fast Graphs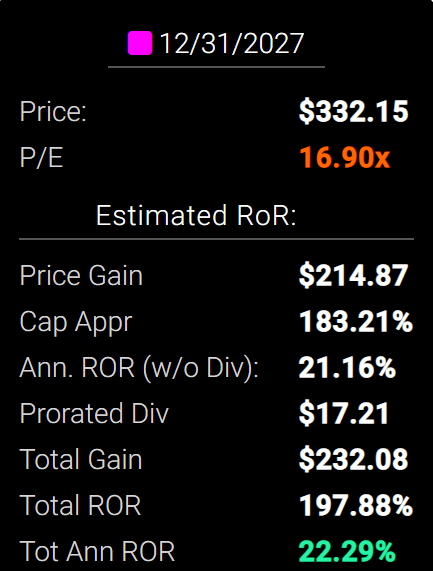
By 2027, if PII grows as expected and returns to historical mid-range historical fair value, it could deliver almost 200% total returns or 22% annually.
-
over 5X more than the S&P 500 consensus
-
Buffett-like return potential from a hyper-growth aristocrat bargain hiding in plain sight.
S&P 500 2027 Consensus Return Potential
|
Year |
Upside Potential By End of That Year |
Consensus CAGR Return Potential By End of That Year |
Probability-Weighted Return (Annualized) |
Inflation And Risk-Adjusted Expected Returns |
Expected Market Return Vs. Historical Inflation-Adjusted Return |
Conservative Years To Double |
|
2027 |
47.75% |
8.12% |
6.09% |
3.93% |
57.79% |
18.32 |
(Source: DK S&P 500 Valuation And Total Return Tool)
Over the next five years, analysts expect about 48% total returns.
PII Long-Term Consensus Total Return Potential (Ignoring Valuation Entirely, Which Cancels Out Over Time)
|
Investment Strategy |
Yield |
LT Consensus Growth |
LT Consensus Total Return Potential |
Long-Term Risk-Adjusted Expected Return |
Long-Term Inflation And Risk-Adjusted Expected Returns |
Years To Double Your Inflation & Risk-Adjusted Wealth |
10-Year Inflation And Risk-Adjusted Expected Return |
|
Polaris |
2.2% |
15.00% |
17.2% |
12.0% |
9.6% |
7.5 |
2.49 |
|
Nasdaq |
1.0% |
14.3% |
15.3% |
10.7% |
8.2% |
8.8 |
2.20 |
|
Dividend Aristocrats |
2.6% |
8.6% |
11.1% |
7.8% |
5.3% |
13.5 |
1.68 |
|
S&P 500 |
1.7% |
8.5% |
10.2% |
7.1% |
4.7% |
15.4 |
1.58 |
(Sources: Morningstar, FactSet, Ycharts)
Analysts think PII could deliver 17.2% long-term returns, more than the Nasdaq, aristocrats, and S&P 500.
-
roughly half the time to conservatively double your money as the S&P 500
PII Total Returns Since October 1987
PII is one of the greatest investments in history, delivering 17% annual returns and a remarkable 104X inflation-adjusted return since 1987…
-
10X more than the S&P 500’s 10X
A Dividend Growth Blue-Chip You Can Trust
|
Portfolio |
1996 Income Per $1000 Investment |
2022 Income Per $1000 Investment |
Annual Income Growth |
Starting Yield |
2022 Yield On Cost |
|
S&P 500 |
$22 |
$152 |
7.72% |
2.2% |
15.2% |
|
Polaris |
$21 |
$646 |
14.09% |
2.1% |
64.6% |
(Source: Portfolio Visualizer Premium)
PII has delivered 14% annual income growth over the last 26 years.
-
almost 2X the income growth of the S&P 500
-
a yield on cost of 64.6% today
PII Consensus Future Income Growth Potential
|
Analyst Consensus Income Growth Forecast |
Risk-Adjusted Expected Income Growth |
Risk And Tax-Adjusted Expected Income Growth |
Risk, Inflation, And Tax Adjusted Income Growth Consensus |
|
13.9% |
9.7% |
8.3% |
5.7% |
(Source: DK Research Terminal, FactSet)
Analysts think PII could deliver similar 14% annual income growth in the future, which, adjusted for the risk of the company not growing as expected, inflation, and taxes is 5.7% real expected income growth.
Now compare that to what they expect from the S&P 500.
|
Time Frame |
S&P Inflation-Adjusted Dividend Growth |
S&P Inflation-Adjusted Earnings Growth |
|
1871-2021 |
1.6% |
2.1% |
|
1945-2021 |
2.4% |
3.5% |
|
1981-2021 (Modern Falling Rate Era) |
2.8% |
3.8% |
|
2008-2021 (Modern Low Rate Era) |
3.5% |
6.2% |
|
FactSet Future Consensus |
2.0% |
5.2% |
(Sources: S&P, FactSet, Multipl.com)
-
1.7% post-tax inflation-adjusted income growth from the S&P 500
-
S&P 500’s historical post-tax inflation-adjusted income growth rate (current tax code) is 5.8% CAGR.
What about a 60/40 retirement portfolio?
-
0.5% consensus inflation, risk, and tax-adjusted income growth.
In other words, PII could generate about 3.3X faster real income growth than the S&P 500 and 11X faster income growth than a 60/40.
What inflation-adjusted returns do analysts expect in the future?
Inflation-Adjusted Consensus Return Potential: $1,000 Initial Investment (Ignoring Valuation)
|
Time Frame (Years) |
7.7% CAGR Inflation-Adjusted S&P Consensus |
8.6% Inflation-Adjusted Aristocrat Consensus |
14.7% CAGR Inflation-Adjusted PIIe Consensus |
Difference Between Inflation-Adjusted PII Consensus And S&P Consensus |
|
5 |
$1,451.05 |
$1,512.69 |
$1,987.86 |
$536.80 |
|
10 |
$2,105.56 |
$2,288.22 |
$3,951.57 |
$1,846.02 |
|
15 |
$3,055.27 |
$3,461.36 |
$7,855.16 |
$4,799.89 |
|
20 |
$4,433.36 |
$5,235.95 |
$15,614.92 |
$11,181.56 |
|
25 |
$6,433.04 |
$7,920.35 |
$31,040.22 |
$24,607.18 |
|
30 |
$9,334.69 |
$11,981.01 |
$61,703.50 |
$52,368.81 |
(Source: DK Research Terminal, FactSet)
Even if PII only grows as expected for a decade, that’s potentially almost 4X inflation-adjusted returns.
|
Time Frame (Years) |
Ratio Aristocrats/S&P Consensus |
Ratio Inflation-Adjusted PII Consensus vs. S&P consensus |
|
5 |
1.04 |
1.37 |
|
10 |
1.09 |
1.88 |
|
15 |
1.13 |
2.57 |
|
20 |
1.18 |
3.52 |
|
25 |
1.23 |
4.83 |
|
30 |
1.28 |
6.61 |
(Source: DK Research Terminal, FactSet)
Almost 2X the market’s return potential and 70% more than the dividend aristocrats.
PII is one of the most reasonable and prudent hyper-growth aristocrats on Wall Street for anyone comfortable with its risk profile.
-
35% discount vs. 4% market premium = 39% better valuation
-
2.2% yield vs. 1.7% yield (and a much safer yield at that)
-
70% better consensus long-term return potential
-
2.5X better risk-adjusted expected return over the next five years
-
30% more consensus income than the S&P 500 over the next 5 years.
Reason Two: Polaris Is One Of The World’s Best Companies
There are many ways to measure safety and quality, and I factor in pretty much all of them.
The Dividend Kings’ overall quality scores are based on a 257-point model that includes:
-
Dividend safety
-
Balance sheet strength
-
Credit ratings
-
Credit default swap medium-term bankruptcy risk data
-
Short and long-term bankruptcy risk
-
Accounting and corporate fraud risk
-
Profitability and business model
-
Growth consensus estimates
-
Management growth guidance
-
Historical earnings growth rates
-
Historical cash flow growth rates
-
Historical dividend growth rates
-
Historical sales growth rates
-
Cost of capital
-
GF Scores
-
Morningstar business model uncertainty score
-
Long-term risk-management scores from MSCI, Morningstar, FactSet, S&P, Reuters’/Refinitiv, and Just Capital
-
Management quality
-
Dividend-friendly corporate culture/income dependability
-
Long-term total returns (a Ben Graham sign of quality)
-
Analyst consensus long-term return potential.
It includes over 1,000 fundamental metrics, including the 12 rating agencies we use to assess fundamental risk.
-
credit and risk management ratings make up 41% of the DK safety, and quality model
-
dividend/balance sheet/risk ratings make up 82% of the DK safety and quality model.
How do we know that our safety and quality model works well?
During the two worst recessions in 75 years, our safety model 87% of blue-chip dividend cuts, the ultimate baptism by fire for any dividend safety model.
How does PII score on our comprehensive safety and quality models?
PII Dividend Safety
|
Rating |
Dividend Kings Safety Score (165 Point Safety Model) |
Approximate Dividend Cut Risk (Average Recession) |
Approximate Dividend Cut Risk In Pandemic Level Recession |
|
1 – unsafe |
0% to 20% |
over 4% |
16+% |
|
2- below average |
21% to 40% |
over 2% |
8% to 16% |
|
3 – average |
41% to 60% |
2% |
4% to 8% |
|
4 – safe |
61% to 80% |
1% |
2% to 4% |
|
5- very safe |
81% to 100% |
0.5% |
1% to 2% |
|
PII |
90% |
0.5% |
1.50% |
|
Risk Rating |
Low-Risk (61st industry percentile risk-management consensus) |
Effective A- outlook credit rating 2.5% 30-year bankruptcy risk |
20% OR LESS Max Risk Cap Recommendation |
Long-Term Dependability
|
Company |
DK Long-Term Dependability Score |
Interpretation |
Points |
|
Non-Dependable Companies |
21% or below |
Poor Dependability |
1 |
|
Low Dependability Companies |
22% to 60% |
Below-Average Dependability |
2 |
|
S&P 500/Industry Average |
61% (61% to 70% range) |
Average Dependability |
3 |
|
Above-Average |
71% to 80% |
Very Dependable |
4 |
|
Very Good |
81% or higher |
Exceptional Dependability |
5 |
|
PII |
92% |
Exceptional Dependability |
5 |
Overall Quality
|
PII |
Final Score |
Rating |
|
Safety |
90% |
5/5 very safe |
|
Business Model |
90% |
3/3 wide and stable moat |
|
Dependability |
92% |
5/5 exceptional |
|
Total |
91% |
13/13 Ultra SWAN dividend champion |
|
Risk Rating |
4/5 Low-Risk |
|
|
20% OR LESS Max Risk Cap Rec |
5% Margin of Safety For A Potentially Good Buy |
PII is the 79th highest quality company on the DK 500 Masterlist.
How significant is this? The DK 500 Master List is one of the world’s best watchlists, including
-
every dividend aristocrat (S&P companies with 25+ year dividend growth streaks)
-
every dividend champion (every company, including foreign, with 25+ year dividend growth streaks)
-
every dividend king (every company with 50+ year dividend growth streaks)
-
every foreign aristocrat (every company with 20+ year dividend growth streaks)
-
every Ultra SWAN (wide moat aristocrats, as close to perfect quality companies as exist)
-
40 of the world’s best growth stocks.
In other words, even among the world’s best companies, PII is higher quality than 84% of them.
Why We Trust Polaris And So Can You
-
Polaris Is A 42% Undervalued Ultra SWAN Aristocrat That Could Triple In 5 Years
-
see section 3 of this article for a more in-depth look at PII’s growth strategy
-
including its industry-leading position in EVs
-
here’s the summary
Polaris has a reasonable plan to expand its addressable market to $145 billion annually, almost 3X larger than it is now.
PII’s market share is 2X that of its nearest rival.
Management thinks its long-term plans can deliver 10+% annual long-term EPS growth and 12.2+% annual total returns.
Polaris was founded in 1954 in Medina, Minnesota.
“Polaris is one of the longest-operating brands in Powersports. We believe that its brands, innovative products, and lean manufacturing yield the firm a wide economic moat and that it stands to capitalize on its research and development, solid quality, operational excellence, and acquisition strategy.” – Morningstar
Polaris has been around for 68 years, raising its dividend every year since 1995. It’s survived and thrived through:
-
10 recessions
-
2 economic crises
-
inflation as high as 15%
-
interest rates as high as 20%
-
10-year US treasury yields as high as 16%
-
16 bear markets
-
45 corrections
-
approximately 136 market pullbacks
Polaris is built to last and will likely outlive us all.
Earnings Update
“Incremental Supply Chain Improvement Offers Hope Market Share Losses Begin to Reverse at Polaris…
Supply chain congestion remains the key issue keeping wide-moat Polaris from achieving normalized throughput, although it appears the acquisition of inputs is beginning to ease. A modestly improving logistics situation allowed the firm to ship 10,000 more off road units than in its first quarter.
Despite some progress, second-quarter retail sales were depressed, down 23%, and the firm saw market share declines across its ORV, off road, and marine segments, which we believe stems from the dysfunctional supply chain.
We expect market share losses to reverse as parts availability improves over the next year, supporting our hypothesis that Polaris will continue to carry a top-notch brand intangible asset.” – Morningstar
Supply chains continue to create headwinds for PII this year, making it capacity constrained.
“Although Polaris digested numerous headwinds, it lifted its full-year sales outlook to 13%-16% (from 12%-15%) while narrowing its adjusted EPS goal to $10.10-$10.30 (from $10.10-$10.40), implying 3% growth even with the inclusion of Transamerican Auto Parts (which generated around $760 million in sales in 2021).
With the 8% sales growth Polaris reported in the second quarter ($2.1 billion, a drop below our $2.2 billion forecast), the firm should be able to achieve its 2022 goals, in our view. We don’t plan any material change to our $175 per share fair value estimate and view shares as attractive.” – Morningstar
Management raised its guidance for sales growth and essentially reiterated full-year EPS guidance.
“Unwavering consumer demand offers us confidence in our long-term forecast, which includes an average sales growth of 3% and operating margins of 11% over the next decade. Even if consumer demand were to tumble due to a weaker economic environment, significant shortages remain to be filled at the dealer base, with unit levels still 70% lower than in the second quarter of 2019.
We don’t see dealer fulfillment as likely to be remedied any time soon, given that about 60% of ORV units as a percentage of retail are still being presold. This channel refill has been quantified as a $750 million opportunity, representing roughly 9% of our forecast 2022 sales base.” – Morningstar (emphasis added)
So far, there is no evidence of consumers being unwilling to buy PII’s premium Powersports product.
PII’s top line is doing fine though margins are taking a hit due to inflation and supply chain issues.
PII’s biggest issue is it simply can’t build its products fast enough, not a lack of demand.
PII’s supply chain issues have been getting a lot better in recent months. Parts shortages are down 50% in Q2.
PII’s financials are in great shape, with 2X leverage (3.0 or less safe), $314 million in cash, and soaring free cash flow.
Its capital allocation priorities remain:
-
growing the business, including $350 million in annual growth capex and 4% of sales on R&D
-
growing the dividend every year
-
opportunistic buybacks ($680 million left on its buyback authorization)
-
tuck-in acquisitions
Quantitative Analysis: The Math Backing Up The Investment Thesis
Ben Graham recommended combining qualitative (the story) analysis with quantitative analysis looking at the past, present, and likely future.
Effective A- Credit Rating
PII doesn’t pay for a credit rating, but we’re highly confident that if it did it would be rated A- or better here’s why.
-
current and historical debt metrics and ratios consistent with A or even AA-rated companies
-
advanced accounting metrics (F, Z, and M-scores) consistent with A or even AA-rated companies
-
solvency ratios consistent with A or even AA-rated companies
-
2.79% average borrowing cost consistent with A or even AA-rated companies
In other words, the bond market, which knows the rating agency guidelines for every industry, treats Polaris as an A+ rated company.
-
Approximately 30-year bankruptcy risk 2.5%
-
The approximate risk of losing all your money buying PII today is 1 in 40 (or less)
PII Leverage Consensus Forecast
|
Year |
Debt/EBITDA |
Net Debt/EBITDA (3.0 Or Less Safe According To Credit Rating Agencies) |
Interest Coverage (8+ Safe) |
|
2020 |
1.55 |
0.94 |
3.16 |
|
2021 |
1.78 |
1.42 |
16.18 |
|
2022 |
1.72 |
1.04 |
12.52 |
|
2023 |
1.82 |
0.63 |
4.75 |
|
Annualized Change |
5.65% |
-12.59% |
14.49% |
(Source: FactSet Research Terminal)
PII’s leverage is expected to increase on an absolute basis though net debt/EBITDA is expected to keep falling at an impressive rate. Interest coverage in 2023 is likely not going to fall to sub-5.
-
Interest costs are not likely to triple, given that debt is 75% fixed and expected to remain stable in the coming years
PII Balance Sheet Consensus Forecast
|
Year |
Total Debt (Millions) |
Cash |
Net Debt (Millions) |
Interest Cost (Millions) |
EBITDA (Millions) |
Operating Income (Millions) |
|
2020 |
$1,436 |
$635 |
$873 |
$67 |
$929 |
$212 |
|
2021 |
$1,788 |
$509 |
$1,421 |
$44 |
$1,003 |
$712 |
|
2022 |
$1,844 |
$419 |
$1,113 |
$63 |
$1,072 |
$789 |
|
2023 |
$2,120 |
$449 |
$730 |
$187 |
$1,163 |
$888 |
|
2024 |
NA |
NA |
NA |
NA |
$1,188 |
$921 |
|
Annualized Growth |
13.87% |
-10.91% |
-5.79% |
40.80% |
6.34% |
44.37% |
(Source: FactSet Research Terminal)
Debt is expected to increase modestly while cash flows are rising at model to very impressive rates.
PII Bond Profile
-
$1.1 billion in liquidity
-
no debt maturing until 2026 and 2028
-
100% unsecured bonds for very good financial flexibility
-
the average borrowing cost is 2.79%
-
0.3% after the bond market’s 30-year inflation expectations
-
0.3% real borrowing costs vs. 19.5% cash returns on invested capital
-
PII’s ROIC is 65X higher than its real borrowing costs
PII GF Score: The Newest Addition To The DK Safety And Quality Model
The GF Score is a ranking system that has been found to be closely correlated to the long-term performances of stocks by backtesting from 2006 to 2021.” – Gurufocus
GF Score considers five key aspects. They are:
-
Financial Strength
-
Profitability
-
Growth
-
Valuation
-
Momentum
MSFT’s excellent 95/100 GF score confirms its very strong fundamentals and exceptional investment thesis.
PII Profitability: Wall Street’s Favorite Quality Proxy
PII’s historical profitability is in the top 10% of peers.
PII Trailing 12-Month Profitability Vs. Peers
|
Metric |
TTM |
Industry Percentile |
Major Vehicles & Parts Companies providers More Profitable Than PII (Out Of 1,242) |
|
Gross Margins |
21.86% |
59.5 |
503 |
|
Operating Margin |
7.34% |
68.42 |
392 |
|
Net Margin |
3.27% |
50.53 |
614 |
|
Return On Equity |
23.20% |
89.47 |
131 |
|
Return On Assets |
5.37% |
70.53 |
366 |
|
Returns On Invested Capital |
14.80% |
87.91 |
150 |
|
Return On Capital (Greenblatt) |
35.94% |
88.3 |
145 |
|
Return On Capital Employed |
19.54% |
86.49 |
168 |
|
Average |
16.42% |
75.14 |
309 |
(Source: GuruFocus Premium)
Even after a very tough year, PII has managed to maintain profitability in the top 25% of its peers.
PII Profit Margin Consensus Forecast
|
Year |
FCF Margin |
EBITDA Margin |
EBIT (Operating) Margin |
Net Margin |
Return On Capital Expansion |
Return On Capital Forecast |
|
2020 |
11.5% |
13.2% |
3.0% |
1.8% |
1.17 |
|
|
2021 |
-0.1% |
12.2% |
8.7% |
6.0% |
TTM ROC |
35.94% |
|
2022 |
5.1% |
12.4% |
9.1% |
6.4% |
Latest ROC |
43.30% |
|
2023 |
6.9% |
13.0% |
9.9% |
7.2% |
2024 ROC |
42.17% |
|
2024 |
9.3% |
13.1% |
10.2% |
7.6% |
2024 ROC |
50.81% |
|
2025 |
NA |
NA |
NA |
NA |
Average |
46.49% |
|
2026 |
NA |
NA |
NA |
NA |
Industry Median |
10.01% |
|
2027 |
NA |
NA |
NA |
NA |
PII/Industry Median |
4.64 |
|
Annualized Growth |
-5.15% |
-0.15% |
35.56% |
43.93% |
Vs. S&P |
3.18 |
|
Annualized Growth (Post Pandemic) |
34.30% |
2.42% |
5.48% |
8.21% |
(Source: FactSet Research Terminal)
PII’s industry-leading profitability is expected to improve significantly in the coming years.
Joel Greenblatt considered return on capital his gold standard proxy for quality and moatiness.
-
annual pre-tax profit/the cost of running the business
-
PII’s ROC is expected to improve 17% in the coming years to 46%
-
almost 5X its industry norm and 3X that of the S&P 500
Reason Three: Strong Growth Prospects For Decades To Come
At 8.1X cash-adjusted earnings, PII is priced for -0.8% CAGR long-term growth. Here’s what analysts actually expect.
PII Medium-Term Growth Consensus Forecast
|
Year |
Sales |
Free Cash Flow |
EBITDA |
EBIT (Operating Income) |
Net Income |
|
2020 |
$7,025 |
$805 |
$929 |
$212 |
$125 |
|
2021 |
$8,198 |
-$5 |
$1,003 |
$712 |
$494 |
|
2022 |
$8,675 |
$446 |
$1,072 |
$789 |
$552 |
|
2023 |
$8,945 |
$614 |
$1,163 |
$888 |
$640 |
|
2024 |
$9,037 |
$838 |
$1,188 |
$921 |
$690 |
|
Annualized Growth |
6.50% |
1.01% |
6.34% |
44.37% |
53.28% |
|
Annualized Growth (Post Pandemic) |
3.30% |
37.07% |
5.80% |
8.96% |
11.78% |
|
Cumulative Next Three Years |
$26,657 |
$1,452 |
$2,351 |
$1,809 |
$1,330 |
(Source: FactSet Research Terminal)
Post pandemic analysts expect modest sales growth but much stronger bottom line growth up to 37% for free cash flow.
$1.5 billion in cumulative consensus free cash flow over the next five years compared to $1.3 billion in net profit.
-
109% earnings to free cash flow conversion ratio are excellent for this industry and blue-chips in general
A company’s cash conversion ratio is usually a good indicator of:
-
efficient capital allocation
-
low risk of fraud
Most blue-chips will have close to 100% cash conversion ratios over the long-term.
Companies with low ratios are potentially poorly run and or committing accounting fraud.
PII’s good cash conversion further indicates good management, a solid business, and honest accounting.
-
as well as a very safe dividend
PII Dividend Growth Consensus Forecast
|
Year |
Dividend Consensus |
EPS/Share Consensus |
EPS Payout Ratio |
Retained (Post-Dividend) Earnings |
Buyback Potential |
Debt Repayment Potential |
|
2022 |
$2.55 |
$10.07 |
25.3% |
$451 |
6.46% |
24.5% |
|
2023 |
$2.66 |
$10.97 |
24.2% |
$499 |
7.14% |
23.5% |
|
2024 |
$2.72 |
$11.97 |
22.7% |
$555 |
7.95% |
26.2% |
|
Total 2022 Through 2024 |
$7.93 |
$33.01 |
24.0% |
$1,504.80 |
21.54% |
70.98% |
|
Annualized Rate |
3.28% |
9.03% |
-5.27% |
10.91% |
10.91% |
3.44% |
(Source: FactSet Research Terminal)
60% is the safe payout ratio for this industry, according to rating agencies.
-
the payout ratio is a very safe 25% in 2022 and is expected to fall to 23% by 2024
-
average 24% through 2024
-
3% annual dividend growth and 9% EPS growth (even in a potential recession)
-
$1.5 billion in consensus post-dividend retained earnings through 2024
-
enough to pay off 71% of its debt
-
or buyback up to 22% of shares at existing valuations
PII Buyback Consensus Forecast
|
Year |
Consensus Buybacks ($ Millions) |
% Of Shares (At Current Valuations) |
Market Cap |
|
2022 |
$400 |
4.0% |
$6,985 |
|
2023 |
$280 |
0.0% |
$6,985 |
|
Total 2022 through 2023 |
$680 |
9.7% |
$6,985 |
|
Annualized Rate |
5.0% |
Average Annual Buybacks |
$340 |
(Source: FactSet Research Terminal)
Analysts expect PII to achieve its goal of buying back about 10% of shares within 3 years.
-
$1 billion buyback authorization last year
-
$340 million was repurchased last year
-
all $680 million remaining is expected to be used by the end of next year
PII began buying back stock in 1995, the same year it began its dividend growth streak. Since then, it’s repurchased 46.4% of net shares, a 2.2% net share buyback rate over the last 28 years.
|
Time Frame (Years) |
Net Buyback Rate |
Shares Remaining |
Net Shares Repurchased |
Each Share You Own Is Worth X Times More (Not Including Future Growth And Dividends) |
|
5 |
2.2% |
89.47% |
10.53% |
1.12 |
|
10 |
2.2% |
80.06% |
19.94% |
1.25 |
|
15 |
2.2% |
71.63% |
28.37% |
1.40 |
|
20 |
2.2% |
64.09% |
35.91% |
1.56 |
|
25 |
2.2% |
57.34% |
42.66% |
1.74 |
|
30 |
2.2% |
51.31% |
48.69% |
1.95 |
(Source: FactSet Research Terminal)
If PII continues its historical buyback rate within 30 years, it would buy back about half its shares and double the intrinsic value of existing shares, not counting future earnings, cash flow, and dividend growth.
PII Long-Term Growth Outlook
-
13 out of 17 analysts are willing to offer a 5+ year growth forecast
-
the consensus is 15%
-
management guidance: 10+%
-
11.9% CAGR 20-year growth rate
How accurate are analyst forecasts for PII (partially based on management guidance)?
-
Smoothing for outliers, historical analyst margins-of-error are 10% to the downside and 20% to the upside
-
margin-of-error adjusted consensus growth range: 11% to 18% CAGR (including the historical growth rate of 11.9% over the last 20 years)
-
70% statistical probability that PII grows 11% to 18% over time
Management thinks PII can keep growing at the same rate as in the last 20 years, and analysts expect growth similar to the last 12 years.
-
driven by a 3X increase in its addressable market
-
and maintaining or even growing market share.
Reason Four: A Wonderful Company At A Wonderful Price
Over the last 20 years, tens of millions of investors have consistently paid, outside of bear markets and bubbles, 16.5X to 18X for PII.
-
91% statistical probability that PII’s intrinsic value is between 16.5 and 18X
|
Metric |
Historical Fair Value Multiples (all-Years) |
2020 |
2021 |
2022 |
2023 |
2024 |
12-Month Forward Fair Value |
|
Earnings |
16.90 |
$130.81 |
$154.30 |
$170.18 |
$185.39 |
$202.29 |
|
|
Average |
$130.81 |
$154.30 |
$170.18 |
$185.39 |
$202.29 |
$178.96 |
|
|
Current Price |
$117.28 |
||||||
|
Discount To Fair Value |
10.34% |
23.99% |
31.09% |
36.74% |
42.02% |
34.47% |
|
|
Upside To Fair Value (NOT Including Dividends) |
11.53% |
31.56% |
45.11% |
58.08% |
72.49% |
52.59% (55% including dividend) |
|
|
2022 EPS |
2023 EPS |
2022 Weighted EPS |
2023 Weighted EPS |
12-Month Forward EPS |
12-Month Average Fair Value Forward PE |
Current Forward PE |
|
|
$10.07 |
$10.97 |
$4.26 |
$6.33 |
$10.59 |
16.9 |
11.1 |
We estimate PII is historically worth 16.9X earnings; today, it trades at 11.1X.
-
8.1X cash-adjusted earnings
-
anti-bubble valuation by even private equity standards
|
Analyst Median 12-Month Price Target |
Morningstar Fair Value Estimate |
|
$125.19 (11 PE) |
$175.00 (16.5 PE) |
|
Discount To Price Target (Not A Fair Value Estimate) |
Discount To Fair Value |
|
6.32% |
32.98% |
|
Upside To Price Target (Not Including Dividend) |
Upside To Fair Value (Not Including Dividend) |
|
6.74% |
49.22% |
|
12-Month Median Total Return Price (Including Dividend) |
Fair Value + 12-Month Dividend |
|
$127.75 |
$177.56 |
|
Discount To Total Price Target (Not A Fair Value Estimate) |
Discount To Fair Value + 12-Month Dividend |
|
8.20% |
33.95% |
|
Upside To Price Target (Including Dividend) |
Upside To Fair Value + Dividend |
|
8.93% |
51.40% |
Analysts expect PII to deliver modest 9% gains in the next year because weaker economic growth will keep the PE from expanding.
Morningstar’s DCF model estimates PII is worth 16.5X forward earnings, the low end of historical fair value.
-
and has a 51% upside to fair value
-
we estimate a 55% upside to fair value if PII grows as expected and returns to historical fair value within a year
We don’t recommend companies based on 12-month forecasts but on the margin of safety and whether or not it sufficiently compensates you for a company’s risk profile.
Margin Of Safety Not 12-Month Price Targets Are How I Make Investment Decisions
|
Rating |
Margin Of Safety For Low-Risk 13/13 Ultra SWANs |
2022 Fair Value Price |
2023 Fair Value Price |
12-Month Forward Fair Value |
|
Potentially Reasonable Buy |
0% |
$170.18 |
$185.39 |
$178.96 |
|
Potentially Good Buy |
5% |
$161.67 |
$176.12 |
$170.01 |
|
Potentially Strong Buy |
15% |
$144.66 |
$157.58 |
$152.11 |
|
Potentially Very Strong Buy |
25% |
$121.26 |
$139.04 |
$134.22 |
|
Potentially Ultra-Value Buy |
35% |
$110.62 |
$120.51 |
$116.32 |
|
Currently |
$117.28 |
31.09% |
36.74% |
34.47% |
|
Upside To Fair Value (Not Including Dividends) |
45.11% |
58.08% |
52.59% |
PII is a potentially very strong buy, just pennies above its Ultra Value buy price for anyone comfortable with its risk profile.
Risk Profile: Why Polaris Isn’t Right For Everyone
There are no risk-free companies, and no company is right for everyone. You have to be comfortable with the fundamental risk profile.
What Could Cause PII’s Investment Thesis To Break
-
safety falls to 40% or less
-
balance sheet collapses (approximately 2.5% or less probability according to the bond market and effective A-credit rating)
-
a major botched acquisition
-
growth outlook falls to less than 7.8% for seven years
-
PII’s role in my portfolio is to deliver long-term 10+% returns with minimal fundamental risk
-
8+% total return requirement for defensive sectors (including healthcare)
-
10+% for non-defensive (cyclical) sectors
How long it takes for a company’s investment thesis to break depends on the quality of the company.
|
Quality |
Years For The Thesis To Break Entirely |
|
Below-Average |
1 |
|
Average |
2 |
|
Above-Average |
3 |
|
Blue-Chip |
4 |
|
SWAN |
5 |
|
Super SWAN |
6 |
|
Ultra SWAN |
7 |
|
100% Quality Companies (MSFT, LOW, and MA) |
8 |
This is our rule of thumb for when to sell a stock if the investment thesis has broken. PII is highly unlikely to suffer such catastrophic declines in fundamentals.
Risk Profile Summary
“Polaris faces several different risks. Motorcycles, snowmobiles, and ATVs are all big-ticket items, and a widespread slowdown in the global economic environment could hamper the replacement and adoption rates of these products. A protracted domestic downturn could also affect financing rates at the dealer (floor plan) and retail levels.
In 2021, consumers financed about 22% of the vehicles sold in the U.S.; changes in lending standards could prove problematic. Polaris faces integration risk, particularly as it has become more acquisitive, and liability risk, as it self-insures against product liability claims. Weather is the biggest factor Polaris cannot control; sales of snowmobiles are correlated with the amount of snowfall generated in any given season, making segment volume more volatile than the others.
Foreign exchange exposure could prove unpredictable as the firm grows internationally, making sales uncertain. Finally, near-term inflation and supply chain issues could alter profitability and consumer demand.
We remain concerned that the Powersports industry has numerous key players that can compete on price to gain share. Competitors like Honda and Deere are formidable players in ATVs, while Indian has to compete with motorcycle manufacturing giants Honda and Harley-Davidson.
Morningstar (emphasis added).
PII’s Risk Profile Includes
-
cyclical business tied to the health of the economy (and increasingly the global economy) not as much as you might think (0% EPS growth in the Great Recession and +22% in the Pandemic)
-
brand risk: another recall crisis could decrease market share
-
credit risk: dealers make loans to finance these big-ticket purchases
-
supply chain disruption risk
-
M&A execution risk (PII occasionally makes large deals)
-
labor retention risk (tightest job market in over 50 years)
-
margin compression risk: ROC has been trending lower for 30 years (-3.9% CAGR)
How do we quantify, monitor, and track such a complex risk profile? By doing what big institutions do.
Long-Term Risk Analysis: How Large Institutions Measure Total Risk
-
see the risk section of this video to get an in-depth view (and link to two reports) of how DK and big institutions measure long-term risk management by companies
PII Long-Term Risk-Management Consensus
|
Rating Agency |
Industry Percentile |
Rating Agency Classification |
|
Morningstar/Sustainalytics 20 Metric Model |
96.0% |
11.1/100 Low Risk |
|
Reuters’/Refinitiv 500+ Metric Model |
96.8% |
Excellent |
|
S&P 1,000+ Metric Model |
23.0% |
Poor, Stable Trend |
|
Just Capital 19 Metric Model |
36.1% |
Below-Average |
|
FactSet |
50.0% |
Average, Positive Trend |
|
Morningstar Global Percentile (All 14,400 Rated Companies) |
97.5% |
Excellent |
|
Just Capital Global Percentile (All 954 Rated US Companies) |
29.4% |
Poor |
|
Consensus |
61.2% |
Low-Risk, Above-Average Risk-Management, Stable Trend |
(Sources: Morningstar, FactSet, S&P, Reuters, Just Capital)
PII’s Long-Term Risk Management Is The 281st Best In The Master List (44th Percentile)
|
Classification |
Average Consensus LT Risk-Management Industry Percentile |
Risk-Management Rating |
|
S&P Global (SPGI) #1 Risk Management In The Master List |
94 |
Exceptional |
|
Strong ESG Stocks |
78 |
Good – Bordering On Very Good |
|
Foreign Dividend Stocks |
75 |
Good |
|
Ultra SWANs |
71 |
Good |
|
Low Volatility Stocks |
68 |
Above-Average |
|
Dividend Aristocrats |
67 |
Above-Average |
|
Dividend Kings |
63 |
Above-Average |
|
Master List average |
62 |
Above-Average |
|
Polaris |
61 |
Above-Average |
|
Hyper-Growth stocks |
61 |
Above-Average |
|
Monthly Dividend Stocks |
60 |
Above-Average |
|
Dividend Champions |
57 |
Average bordering on above-average |
(Source: DK Research Terminal)
PII’s risk-management consensus is in the bottom 44% of the world’s highest quality companies and similar to that of such other blue-chips as:
-
Altria (MO) – Ultra SWAN dividend king
-
Sherwin-Williams (SHW) Ultra SWAN dividend king
-
C.H Robinson Worldwide (CHRW) Ultra SWAN dividend aristocrat
-
Brown-Foreman (BF.B) Ultra SWAN dividend aristocrat
-
Carlisle Companies (CSL) Ultra SWAN dividend champion
-
Church & Dwight (CHD) Ultra SWAN dividend aristocrat
The bottom line is that all companies have risks, and PII is above-average at managing theirs.
How We Monitor PII’s Risk Profile
-
17 analysts
-
5 total risk rating agencies
-
22 experts who collectively know this business better than anyone other than management
“When the facts change, I change my mind. What do you do, sir?” – John Maynard Keynes
There are no sacred cows at iREIT or Dividend Kings. Wherever the fundamentals lead, we always follow. That’s the essence of disciplined financial science, the math behind retiring rich and staying rich in retirement.
Bottom Line: Polaris Is One Of The Best Bear Market Dividend Aristocrat Bargains You Can Buy
This Pandemic era has been crazy.
-
-$38 oil
-
the fastest bear market in history
-
a 100% stock market rally in just 12 months
-
the largest economic decline in recorded history
-
the fastest economic recovery in history
-
speculative bubbles, including 5 million X returns in some cryptos…and then falling to zero within months
-
NFTs of ether rocks selling for 3 million
-
meme stock madness, including bankrupt companies going up 7X…in a day…AFTER declaring bankruptcy!
Do we know what the economy is going to do next?
No, though we have a pretty good idea of what’s likely.
Do we know what the market is going to do next?
No, though we know what realistic range of outcomes to expect.
Do we know what individual stocks are going to do next?
If we did, we’d be billionaires already;)
“Nobody can predict interest rates, the future direction of the economy or the stock market. Dismiss all such forecasts and concentrate on what’s actually happening to the companies in which you’ve invested.”— Peter Lynch
The good news is that in a world that runs on probabilities and not certainties, there are a few things we can say with high confidence.
-
PII is one of the world’s safest, most dependable, and highest quality companies on earth
-
top 16% of the world’s best companies
-
2.2% very safe and steadily growing dividend
-
17.2% CAGR long-term total return potential, better than the Nasdaq, aristocrats, or S&P 500, the same returns it’s delivered over the last 35 years
-
35% historically undervalued, a potentially very strong buy verging on Ultra Value “fat pitch” buy
-
8.1X cash-adjusted earnings, hyper-growth at an anti-bubble price
-
200% consensus return potential over the next five years, 22% CAGR, over 5X more than the S&P 500
-
2.5X better risk-adjusted expected returns of the S&P 500 over the next five years.
-
30% higher consensus income over the next five years
Over 2 to 3 years, your portfolio returns are almost all luck. Over 20 to 30 years, they are destiny. Fundamentals explain 97% of 30+ year returns and nothing more.
In other words, making your own luck on Wall Street isn’t magic; it’s not gambling; it’s just common sense.
“Luck is what happens when preparation meets opportunity”. – Seneca the Younger
With Polaris, we have a company with impeccable quality, strong brands, a wide and stable moat, and most importantly, management and a corporate culture you can trust.
Not just in the good times, but especially the bad ones. Remember that this company managed to average 11% EPS GROWTH during the 2 worst economic catastrophes in 75 years.
This company has managed to grow its dividend for 27 consecutive years through three recessions and five bear markets.
Joel Greenblatt achieved 40% annual returns for 21 years, and do you know his secret?
“We’re buying above-average companies at below-average prices.” – Joel Greenblatt
Do you know what you call a company of Polaris’ quality trading at 8.1X cash-adjusted earnings?
A wonderful company at a wonderful price.
Polaris is a great example of how smart long-term income investors can harness one of the world’s greatest businesses to achieve financial freedom.
Polaris is a wonderful example of how you can take advantage of short-term market craziness to set yourself on the path to a rich retirement.
And most importantly, within a diversified and prudently risk-managed portfolio, Polaris might be just what you need to retire in safety and splendor.
No matter what happens next with inflation, interest rates, the economy, or the stock market.
Be the first to comment