

Darren415
This article was first released to Systematic Income subscribers and free trials on Nov. 22.
In this article, we provide an update on the PIMCO CEF suite. Specifically, we discuss the changes in leverage and distribution coverage for the month of October. We also discuss the funds’ net income profile as seen in the recently released shareholder reports. We currently see value in the pair of taxable funds Dynamic Income Opportunities Fund (PDO) and the Access Income Fund (PAXS) which trade at 11.3% and 11.7% yields respectively.
Leverage Update
Taxable borrowings continued to trend lower, falling in October.
Systematic Income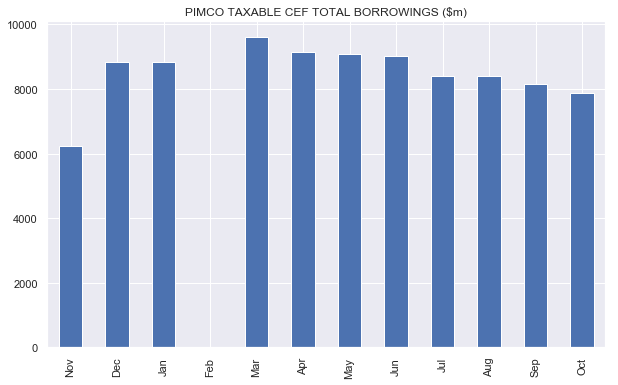
Only one taxable fund – PFL – increased borrowings while the rest deleveraged.
Systematic Income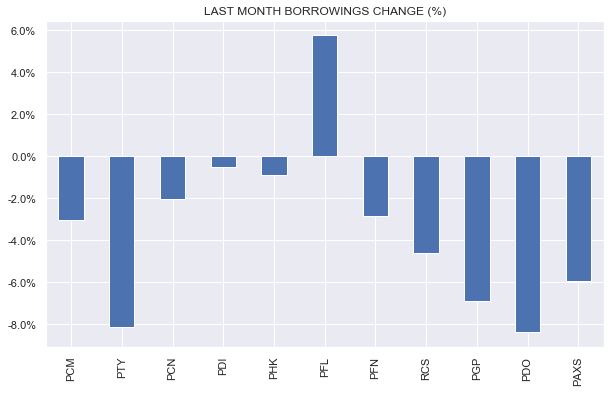
Over the last 12 months taxable funds have cut a significant amount of their borrowings as the following chart shows.
Systematic Income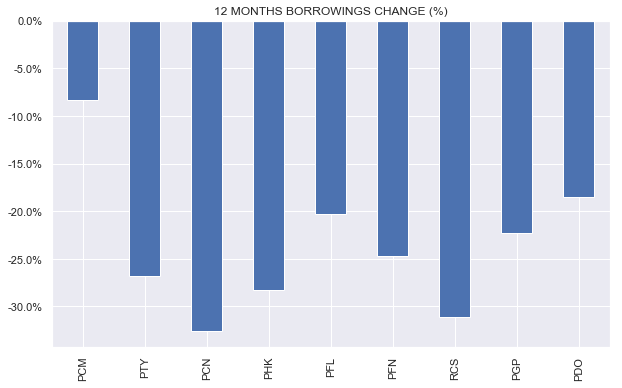
What’s odd is that the funds mostly deleveraged in October despite a gain in NAVs. In other words, the gain in NAVs organically deleveraged the funds slightly anyway. However, managers decided to deleverage the taxable funds even further. Perhaps they viewed credit spreads as being too tight or they did not see compelling opportunities in the market.
Systematic Income
PAXS and PCM carry the highest level of leverage in the taxable suite of around 47%.
Systematic Income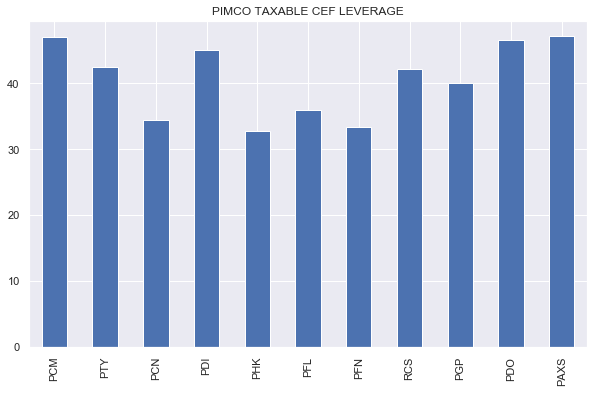
Muni funds deleveraged again in October after doing so in July.
Systematic Income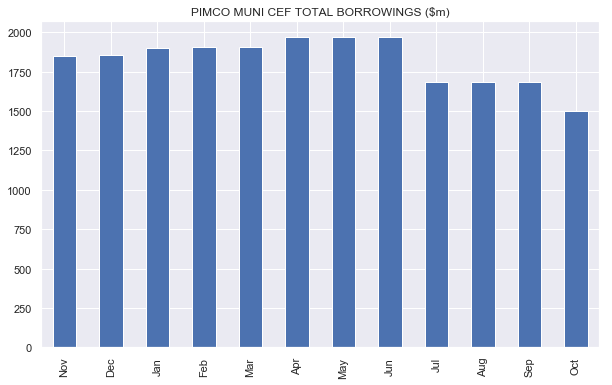
Unlike in July when the funds waited as long as possible and deleveraged right at 50% (their mandated leverage cap) this time around they deleveraged a bit shy of 50%.
Systematic Income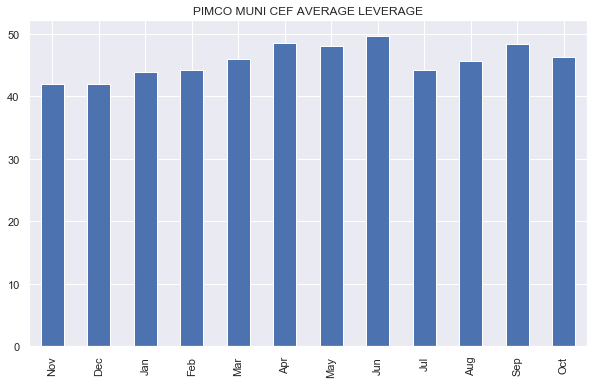
Municipal fund income continues to fall, under pressure by two forces – the double deleveraging over the last 4 months as well as the continued rise in leverage costs.
Taxable fund deleveraging (with the exception of PAXS which hasn’t deleveraged a whole lot given it reached its full leverage level only recently) has been steeper on average than that of the Municipal suite and the rise in taxable leverage costs has been faster (because taxable funds use taxable rather than tax-exempt leverage instruments which carry a higher interest rate). However despite this, we expect net income levels of the taxable suite to hold up better overall because of a large allocation to floating-rate assets.
Coverage Update
October brought another “heart-attack” coverage moment for the taxable suite as all funds, save for PGP, suffered sharp falls in coverage.
Systematic Income CEF Tool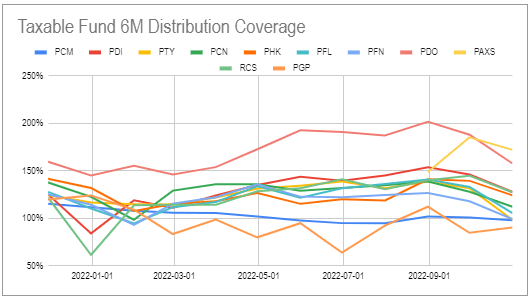
Taxable funds had a large drop across the board – 6-month PTY coverage fell from 131% to 98%, PFL fell from 133% to 105% etc. Whenever we see such a large drop, it’s usually a result of one or two things – a new very low income month or a high income dropping out of the 6-month observation window.
This month two of these things happened together which caused a large drop in coverage. For example, below we see that PTY had a large $0.2262 net income month fall out of the 6-month window while a negative (!) net income month was added to the observation window.
Systematic Income CEF Tool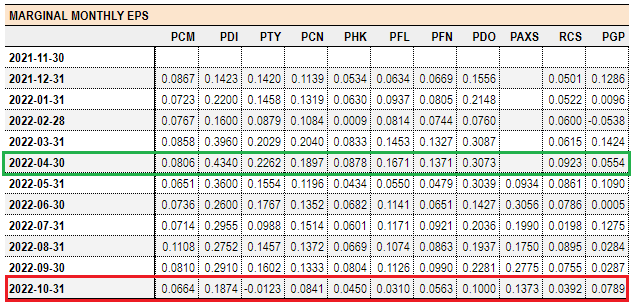
Another important point is that this kind of volatility in coverage is very unusual – typically you don’t see coverage change more than a couple of percent month-on-month so, clearly, we need to take it with a grain of salt.
In other words, 6-month rolling coverage moving 30% in any given month is a clear indication that there is a lot more noise than signal in the number so it’s not something we should take at face value.
Muni fund coverage levels continued to fall and have now reached unusually low levels. Other Municipal funds tend to carry coverage in the 90-100% range because they have made significant distribution cuts this year so it’s odd that PIMCO has not made cuts in their Muni funds yet. Their overdistribution will also mechanically continue to raise their leverage levels, all else equal, potentially necessitating further deleveraging.
Systematic Income CEF Tool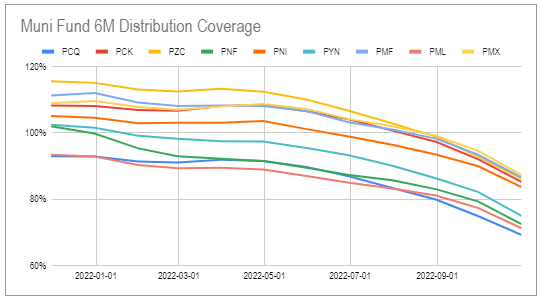
A Look At The Latest Shareholder Report
This month we take a look at the recently released semi-annual shareholder reports. An obvious question is why do we need to look at the shareholder report when PIMCO provides income numbers on a monthly basis, particularly since 1) the report is usually lagging – the recently released reports only cover the semi-annual period ending in June, whereas PIMCO has already provided October income numbers in their monthly reporting and 2) the report is less granular than the monthly figures since it only covers semi-annual periods.
The short answer is that the income figures reported monthly are different from the figures in the shareholder reports. The reports post “final” numbers while the monthly reports are “estimated”.
The second reason why the report figures are useful is that they provide readily accessible numbers across a longer period – from fund inception versus a 6-month history for the monthly figures.
Third, we like to check in on the report figures because the monthly PIMCO coverage figures are often comically volatile. They are also based on tax-measures. Checking in on GAAP net income provided by shareholder reports gives investors a better apples-to-apples comparison versus the broader CEF space.
Year-on-year net income numbers for the taxable funds look like the following. All except two of the funds saw drops in net income. It’s not clear what allowed PDI to increase net income – perhaps there was some noise from the PCI and PKO merger though the numbers are adjusted for the merger.
Systematic Income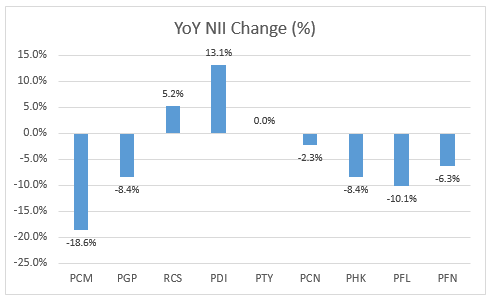
Overall, normalized average net income continued to trend lower in the suite after remaining stable over several pre-COVID years. We expect the trend to continue lower in 2023 as a result of deleveraging this year.
Systematic Income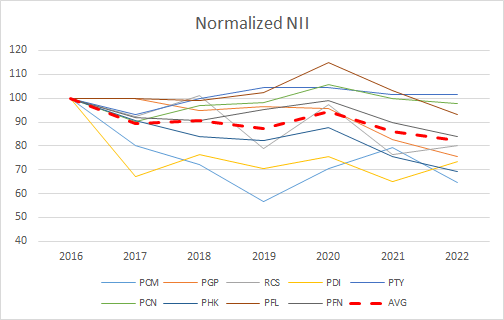
It’s also worth noting that GAAP distribution coverage as shown in the reports came in significantly below their tax-based counterparts. It’s not clear what’s driving such a large gap between the two – our guess is that it has to do with the treatment of interest rate swap income. What it does show is that the high “fully covered” distribution rates of PIMCO income funds are not as full covered as the monthly tax-based numbers imply if we look at them in the more common GAAP framework.
Systematic Income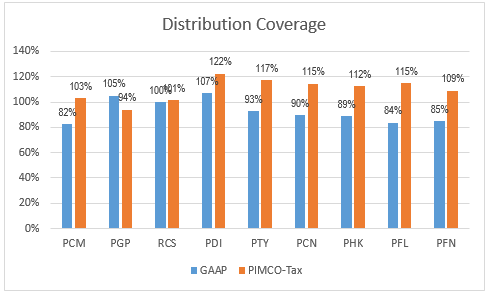
Takeaways
In the current environment we continue to see value in the pair of PDO and PAXS which tend to trade at the widest discounts in the taxable suite. This is for two reasons. First, although this pair of funds does boast the highest level of management fees, high management fees are not only offset by wider discounts and higher leverage levels of these funds, they are also less relevant when underlying yields are high.
And secondly, lower-management fee funds tend to carry auction-rate preferreds whose very high leverage costs (due to a multiplier effect on short-term rates) are quickly becoming a serious liability for funds like PCN, PTY and others. We will explore this topic in the next PIMCO monthly.
Moreover, the two funds offer attractive relative value opportunities. For example, as the following chart illustrates, we rotated to PAXS from PDO in July, moved back to PDO in September and again to PAXS in November in our High Income Portfolio. Both funds are relatively liquid which makes it easier to execute this kind of rotation.
Systematic Income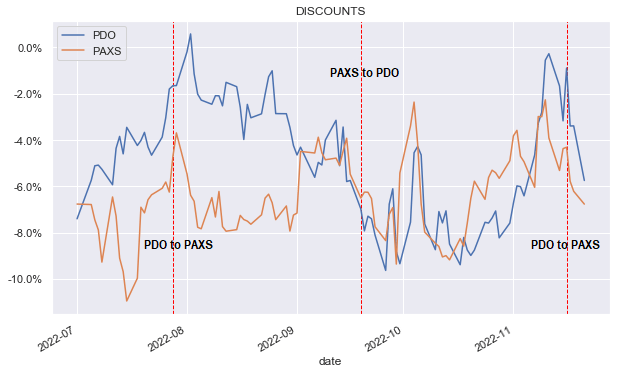
Be the first to comment