

designer491
The Virtus InfraCap U.S. Preferred Stock ETF (NYSEARCA:PFFA) sports an attractive 10.0% distribution yield that is 88% covered by investment income. However, in its limited operating history, the PFFA fund has been very volatile relative to peers.
The main challenge with respect to PFFA and the preferred equity asset class is the potential for significant economic deterioration in the coming months. Preferred equities are negatively impacted when credit spreads widen, since they sit below bonds in the capital structure.
Fund Overview
The Virtus InfraCap U.S. Preferred Stock ETF provides current income and capital appreciation through a portfolio of preferred securities issued by U.S. companies. The PFFA ETF has over $450 million in assets.
Strategy
The PFFA ETF achieves its investment objective by investing at least 80% of its assets in preferred equity and related derivatives of U.S. companies with market capitalization greater than $100 million.
The fund may also write call options on its portfolio to generate additional income, as well as use leverage to enhance returns.
What Is Preferred Equity?
Preferred equity is a type of security that share common characteristics with both bonds and common equity. Within a company’s capital structure, Preferred equity ranks above common equity, but below debt (Figure 1). In the event of a bankruptcy, preferred equity has a higher claim to the company’s assets than common shareholders, but lower than bondholders.
Figure 1 – Preferred equity ranks lower than bonds but higher than equity in capital structure (royalbank.com)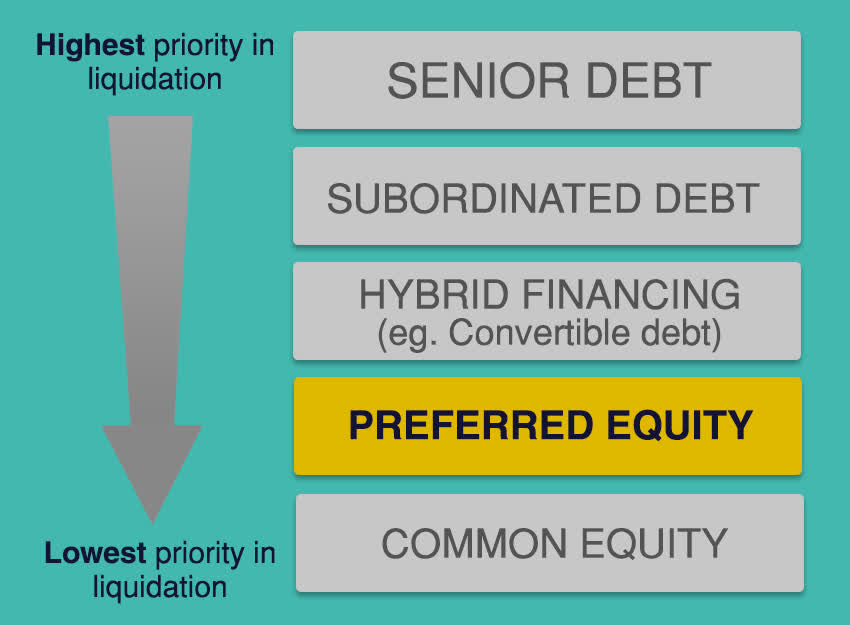
Compared to common equity, preferred equity usually have no voting rights with respect to corporate matters. Also, capital appreciation upside tends to be limited, as preferred equity usually have call provisions allowing the company to redeem the shares at a fixed price (similar to bonds). On the other hand, preferred dividends have priority and usually needs to be paid before common share dividends can be distributed.
Compared to bonds, preferred equity is usually compensated with higher distribution yields for their lower priority claim. Unlike bond payments, skipping preferred dividends does not trigger corporate default provisions.
Preferred equity can have other characteristics such as fixed or floating rate coupons, callable (by the company) or convertible (into common equity).
Portfolio Holdings
Figure 2 shows PFFA’s top 10 positions, which account for 37% of the fund.
Figure 2 – PFFA ETF top 10 holdings (virtus.com)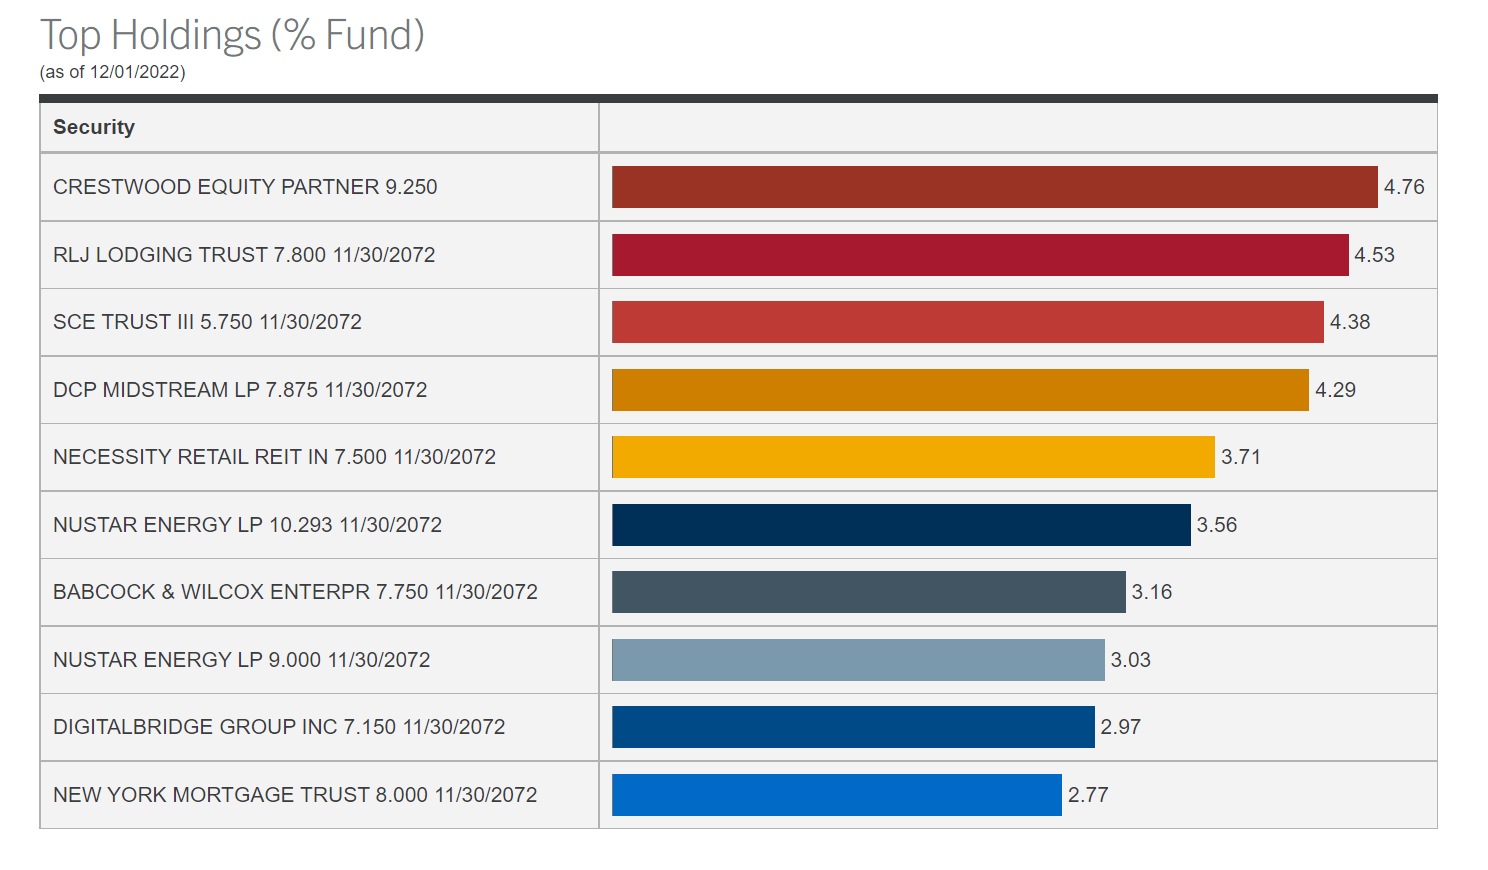
Virtus’s website is pretty sparse when it comes to portfolio characteristics. From the semi-annual report dated April 30, 2022, we can see the sector distribution shown in Figure 3. PFFA’s portfolio is predominantly invested in 5 sectors: Real Estate, Financials, Energy, Utilities, and Industrials.
Figure 3 – PFFA portfolio sector distribution (PFFA semi-annual report, April 2022)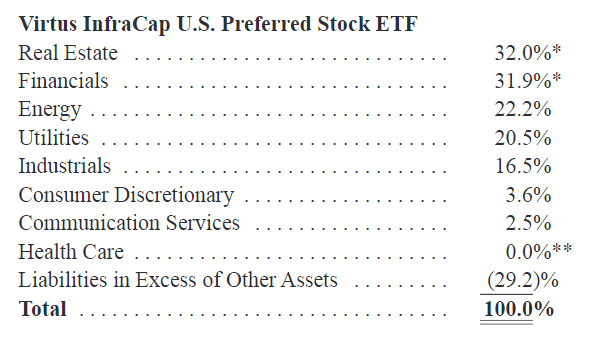
Returns
PFFA’s inception date was May 15, 2018, so the fund has a little over 3 years of operating history. Overall fund returns have been poor, with 3Yr average annual total returns of -0.7% to November 30, 2022 (Figure 4).
Figure 4 – PFFA returns (virtus.com)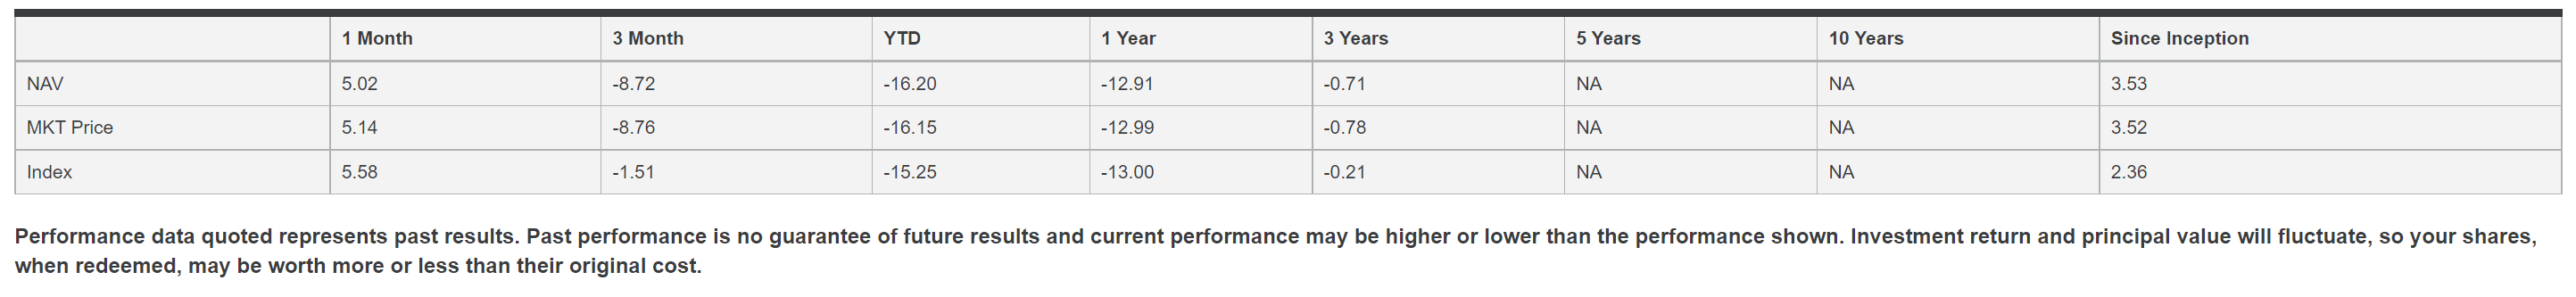
Relative to peer preferred equity funds, PFFA’s returns are quite volatile. It was a 1st quartile fund in 2019 and 2021, and fourth quartile in 2020 and so far in 2022 (Figure 5).
Figure 5 – PFFA vs. peer funds (morningstar.com)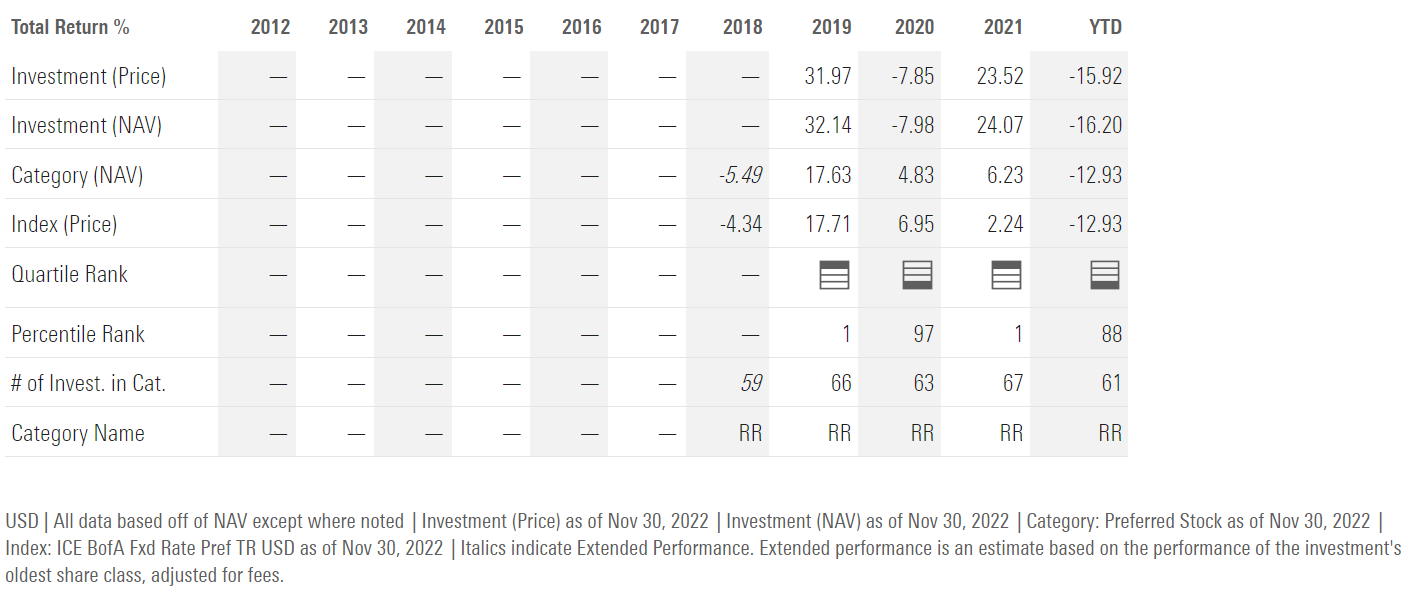
Analyzing the fund’s holdings as of November 30, 2022 in more detail, we can see that the PFFA ETF has 170 positions in total, and the average preferred share holding has an unrealized 13% loss compared to its cost base. In fact, 142 out of 169 preferred share holding is in a loss position (Figure 6).
Figure 6 – PFFA portfolio summary characteristics (Author created from November 30, 2022 holdings report)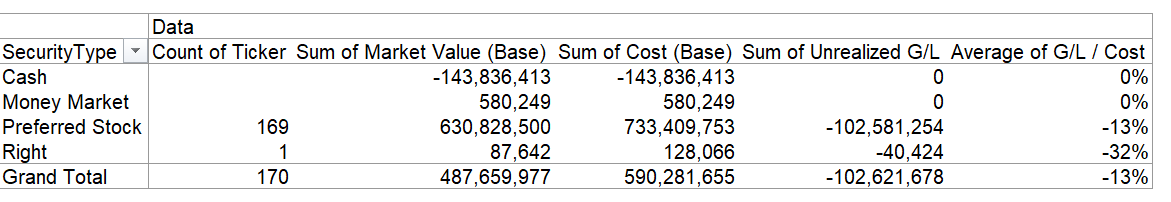
This result speaks to the limited capital appreciation upside associated with preferred equity that I highlighted earlier.
Distribution & Yield
PFFA pays a high distribution, currently set at $0.1625 / month. This annualizes to 10.0% on market price. However, investor should bear in mind that a portion of PFFA’s distribution is funded through return-of-capital (“ROC”). YTD, 12% of PFFA’s $1.787 in announced distribution has come from ROC (Figure 7).
Figure 7 – 88% of PFFA’s YTD distribution is funded through income (Author created with data from PFFA’s Section 19 notices)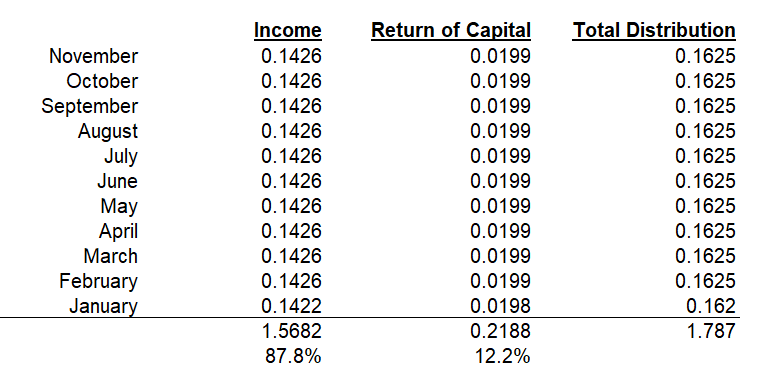
Fees
PFFA charges a 0.8% management fee and a total expense ratio of 1.21%. This is high relative to peer funds that focus on preferred equities (Figure 8).
Figure 8 – PFFA fees vs. peers (Seeking Alpha)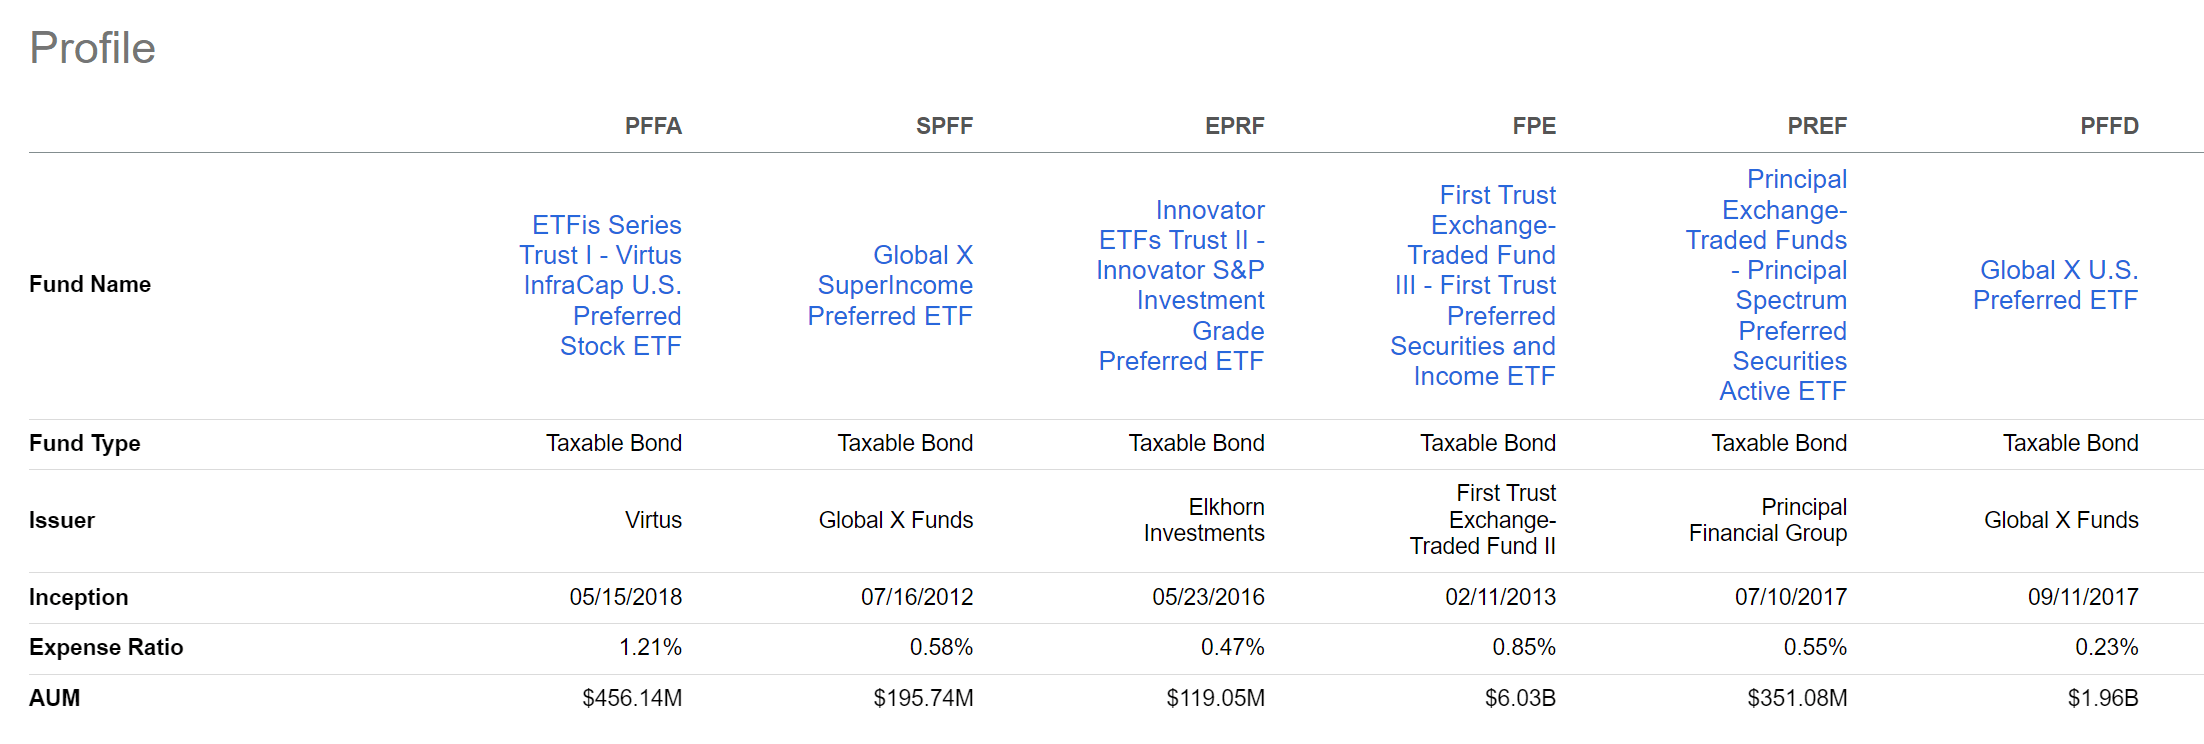
Preferred Equity Trades Inverse To High Yield Credit Spreads
Given preferred equity’s position in the capital structure, they often trade like high yield bonds. For example, if we overlay the price performance of PFFA vs. the ICE BofA High Yield Credit Spread, we can see that PFFA’s market price declines when high yield credit spreads are rising (Figure 9).
Figure 9 – PFFA vs. HY spreads (Author created with price chart from stockcharts.com)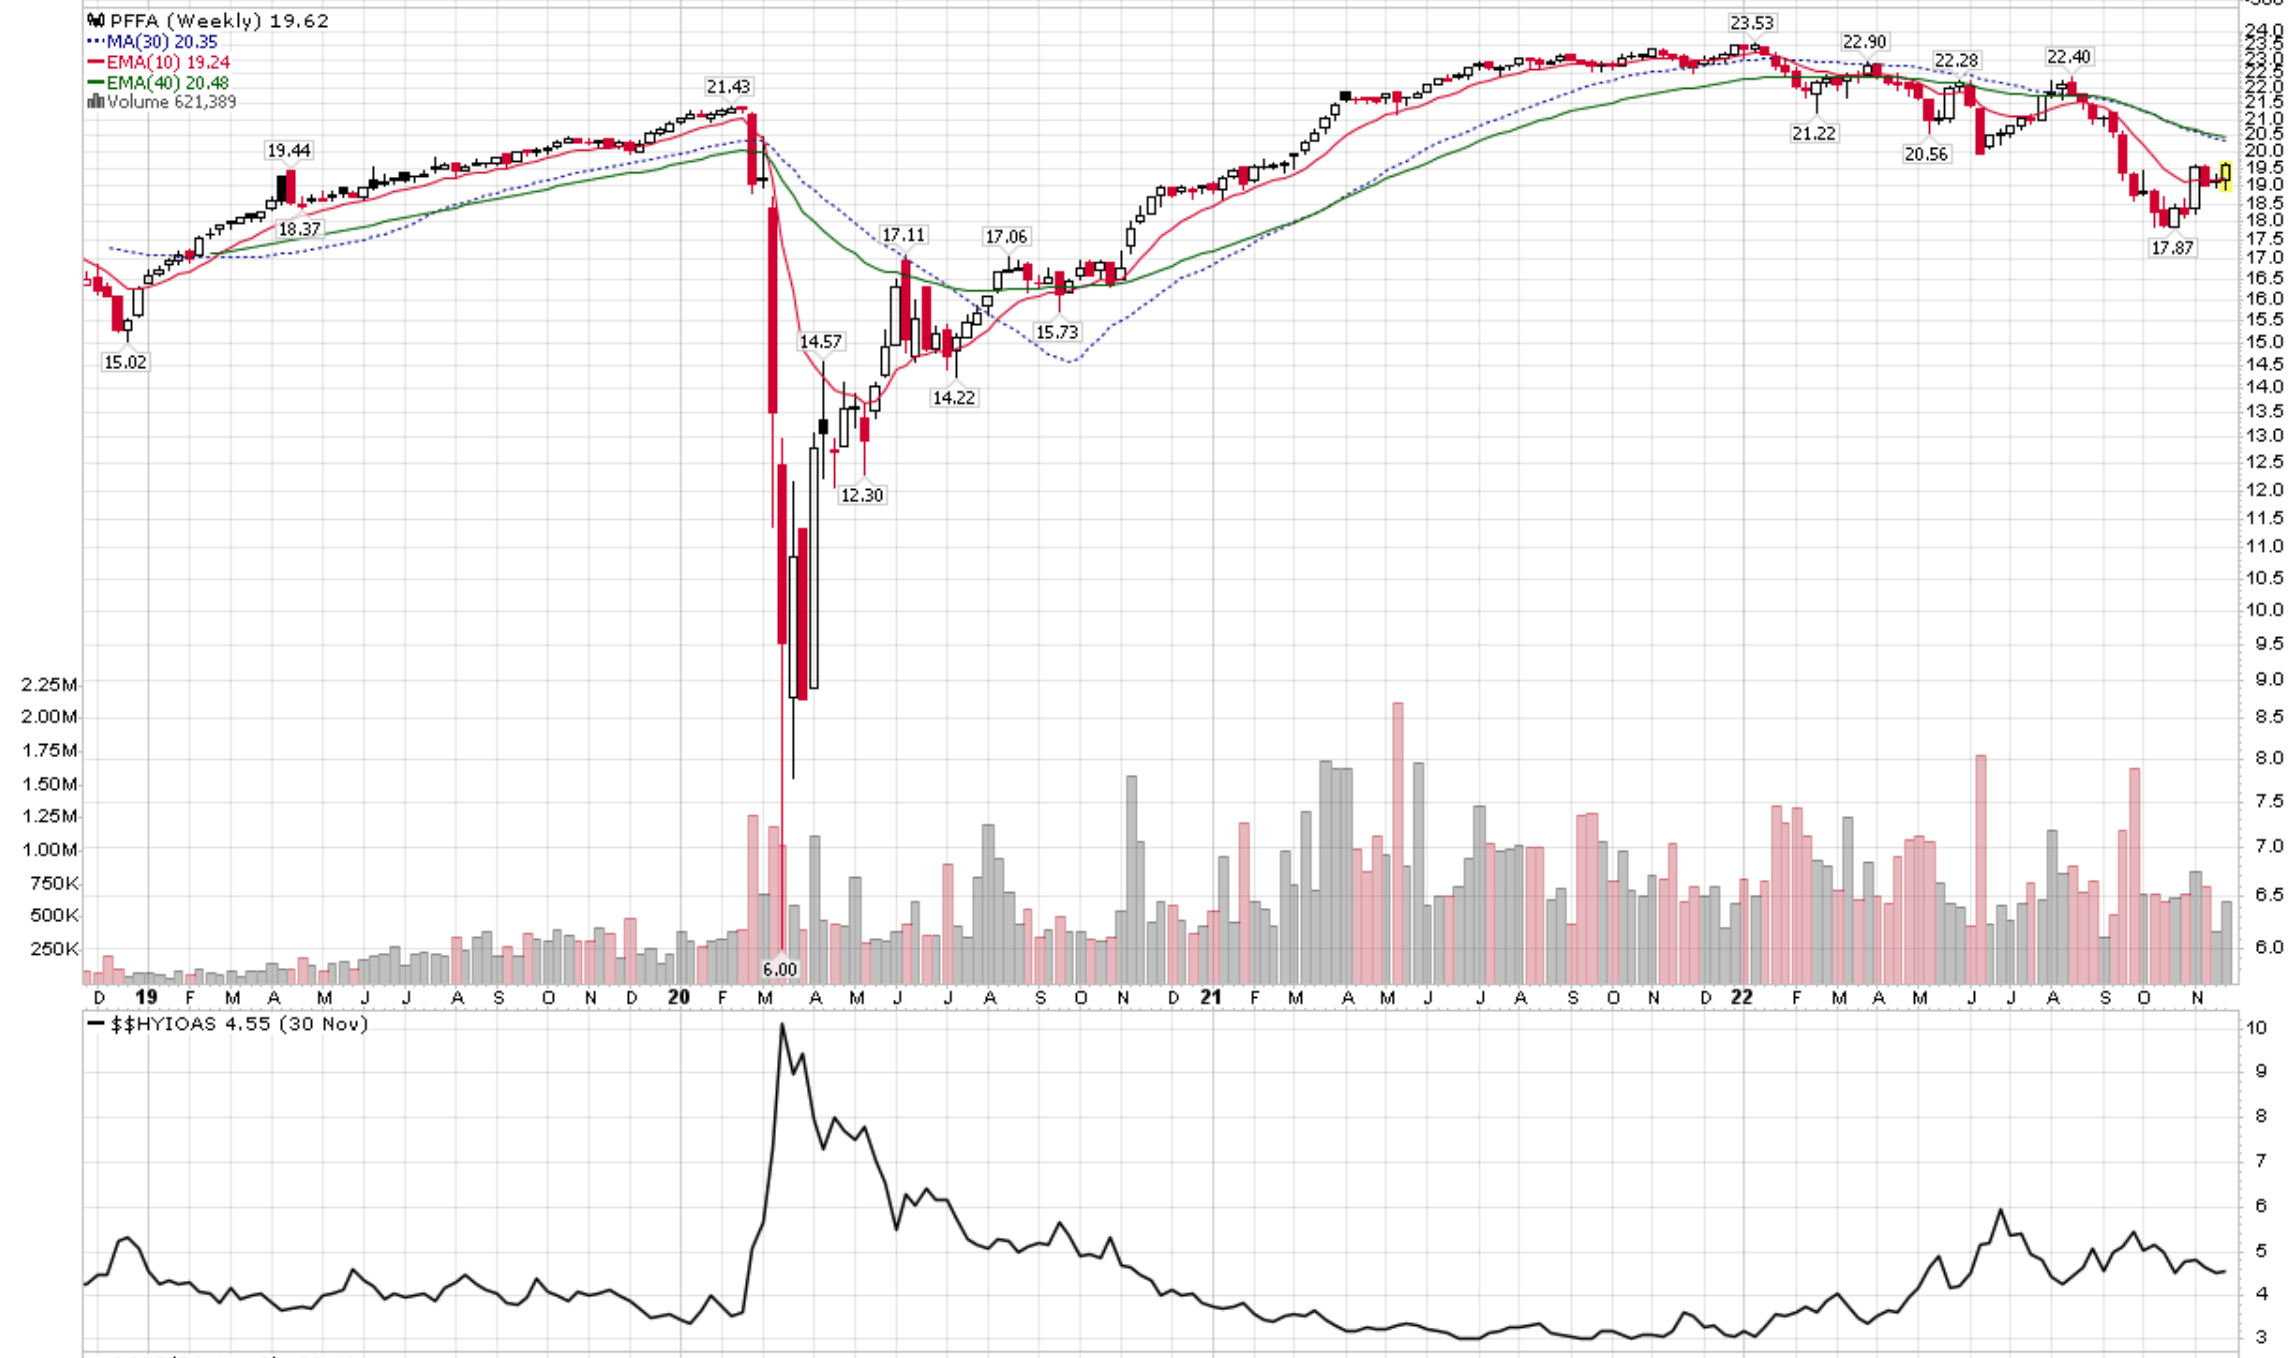
In extreme cases like in 2020, preferred equity prices can take a large bath as companies can elect to skip preferred stock dividends to conserve capital without triggering bond defaults.
With the global economy inching towards a recession (the ISM Manufacturing index recently recorded its first contraction since May 2020), it is hard to justify owning preferred securities that are susceptible to widening credit spreads in the coming months.
Conclusion
PFFA sports an attractive 10.0% distribution yield that is 88% covered by investment income. However, in its limited operating history, the PFFA ETF has been very volatile. It was a top quartile fund in 2019 and 2021, but bottom quartile in 2020 and so far in 2022.
The main challenge in my mind is the potential for significant economic deterioration in the coming months. Preferred equities are negatively impacted when credit spreads widen, since they sit below bonds in the capital structure. In extreme cases, companies can choose to skip preferred dividends in order to conserve capital without triggering debt defaults (i.e. bankruptcy).
Be the first to comment