

DoxaDigital/E+ via Getty Images
(This article was co-produced with Hoya Capital Real Estate)
Introduction
It has been awhile since I reviewed any of the many Preferred stock Exchange-Traded-Funds. My last venture into this asset class was for the Nuveen Variable Rate Preferred & Income CEF (NPFD), which had a poor first year (article). When you consider what 2022 meant to most Fixed Income funds, that was not out of the ordinary.
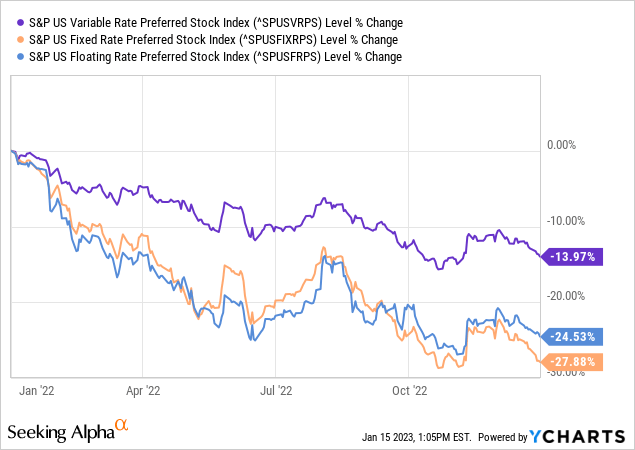
While the best performing sub-sector, even the Floating-Rate index was down almost 14% last year. Both ETFs reviewed in this article are allowed to own securities in all three sub-types of Preferred stocks. They are:
- iShares Preferred and Income Securities ETF (NASDAQ:PFF)
- VanEck Vectors Preferred Securities ex Financials ETF (NYSEARCA:PFXF)
Over the past decade, excluding Financials Issuers has resulted in higher returns. While risk was also more, the Shape and Sortino ratios say investors were paid for taking that extra risk, as measured by StdDev. Diversification also points to adding PFXF to one’s preferred stock fund mix.
Preferred stock 101
While most readers are familiar with this asset class, this section is for those who might not be quite up to speed. The “Key Takeaways” highlight the differences between Preferred and Common stocks.
investopedia.com/terms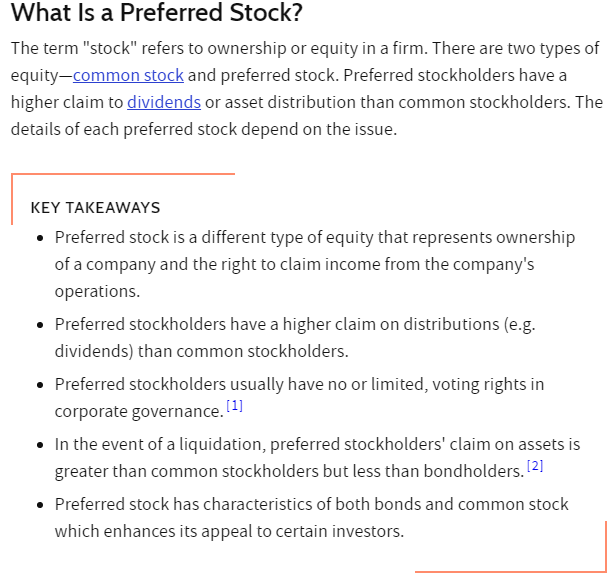
The next chart shows where Preferred shares fall in the capital structure, which would come into play if the Issuer went into bankruptcy. It also shows why income investors like this asset class.
ishares.com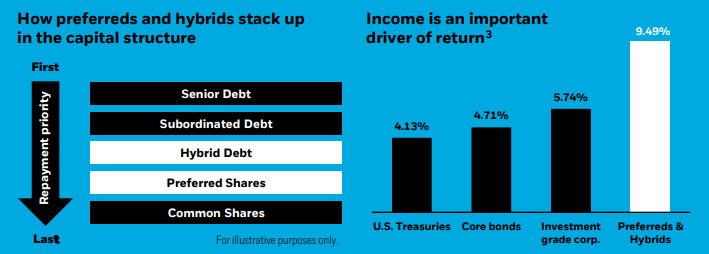
iShares Preferred and Income Securities ETF review
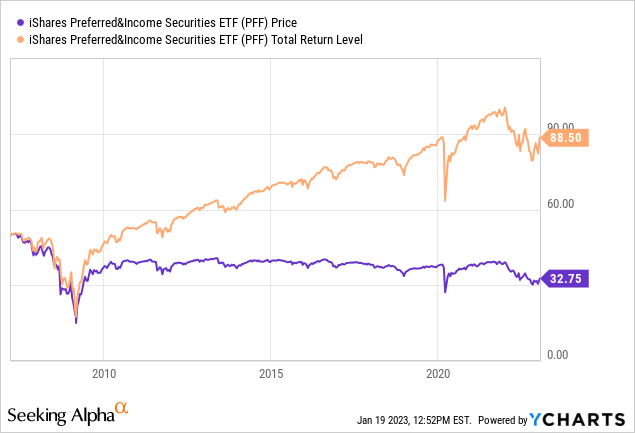
Seeking Alpha describes this ETF as:
The ETF primarily invests in U.S. dollar-denominated preferred securities, hybrid securities and convertible preferred securities. It seeks to track the performance of the ICE Exchange-Listed Preferred & Hybrid Securities Index. PFF started 2007.
Source: seekingalpha.com PFF
PFF has $13.9b in AUM and comes with 45bps in fees. Investors currently see a TTM yield of 5.6%.
Index review
Understanding the underlying index is critical to understanding the investments strategy of that ETF. PFF uses the ICE Exchange-Listed Preferred & Hybrid Securities Index (PHGY), which ICE defines as:
ICE Exchange-Listed Preferred & Hybrid Securities Index tracks the performance of exchange-listed US dollar denominated hybrid debt, preferred stock and convertible preferred stock publicly issued by corporations in the US domestic market. With the exception of preferred securities, floating rate coupon or dividend securities are excluded, but zero, step and rating-dependent coupons are included. Qualifying securities must be exchange listed and have either the NASDAQ or NYSE as their primary exchange in order to be included in the index.
Source: indices.theice.com/home PHGY
Index PGHY methodology includes:
- Corporate debt issued in $1,000 or greater par amounts must have a coupon deferral feature, at least $250 million face amount outstanding and at least 18 months to final maturity at the time of issuance.
- Fixed-to-floating rate securities are included provided they are callable within the fixed rate period and are at least one month from the last call prior to the date the bond transitions from a fixed to a floating rate security.
- Contingent capital securities (“cocos”) are excluded, but capital securities where conversion can be mandated by a regulatory authority, but which have no specified trigger, are included. Other hybrid capital securities, such as those issues that potentially convert into preference shares, those with both cumulative and noncumulative coupon deferral provisions, and those with alternative coupon satisfaction mechanisms, are also included in the index.
- Preferred stock and notes issued in $25, $50, or $100 par/liquidation preference increments, must have a minimum amount outstanding of $100 million. In addition, qualifying securities must have an investment grade rated country of risk.
- Convertible preferred stock must have at least $50 million face amount outstanding. The underlying equity of qualifying securities must be publicly listed and actively trading. Convertible securities where the underlying is a basket of equities, and mandatory convertibles are included in the index.
- Index constituents are market capitalization-weighted subject to certain constraints; of which eight were listed.
Source: Index Rules PDF
ICE provided this basic information about the Index holdings:
indices.theice.com PHGY index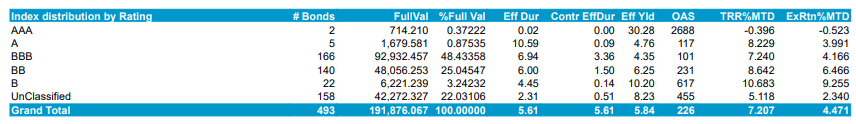
PFF holdings review
This allocation is very typical for preferred-invested funds, as few are rated above BBB; nor is the 22% level of “Not rated” issues.
ishares.com ratings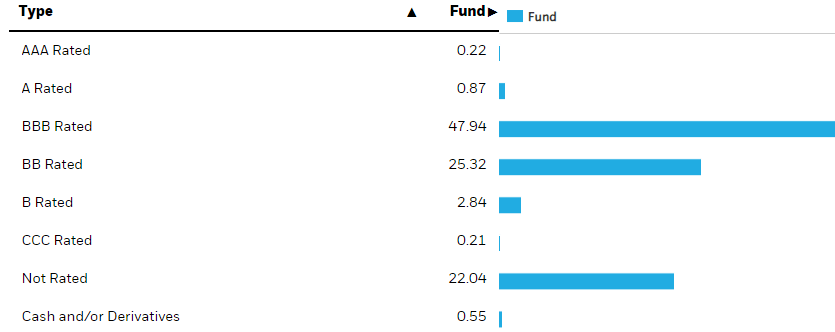
iShares has less detail in their sector breakout than the other ETF provides.
ishares.com sectors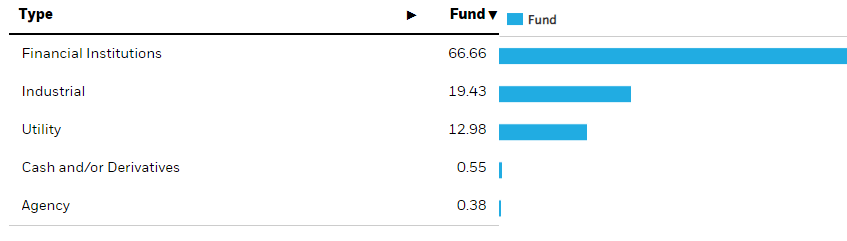
Besides the 2/3rds allocation to Issuers banned by PFXF, this ETF’s second largest exposure, Industrials, doesn’t appear in the other ETF. One disadvantage of Preferreds issued by financial institutions is they are, by law, non-cumulative, meaning a missed payment does not have to be made up later.
Top 20 holdings
ishares.com; compiled by Author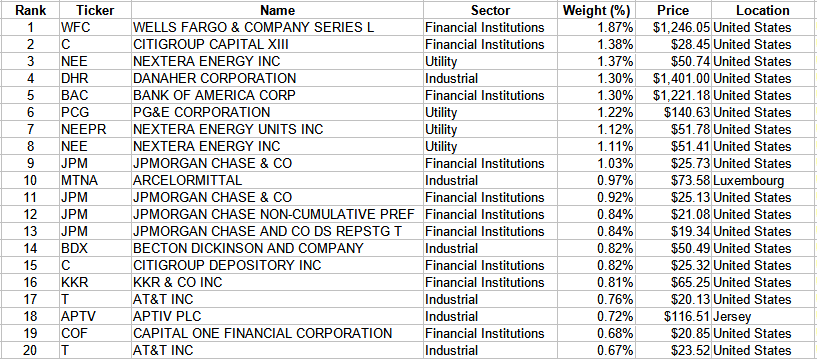
PFF holds 495, with the Top 20 representing just under 21% of the portfolio; the same weight that the bottom half of the portfolio has. While almost 7% of the portfolio’s Issuers are not headquartered in the US, all holdings are dominated in USDs. iShares did not provide data as to which Issuers had the largest exposures, though most probably are large US-centered banks.
PFF distribution review
seekingalpha.com PFF DVDs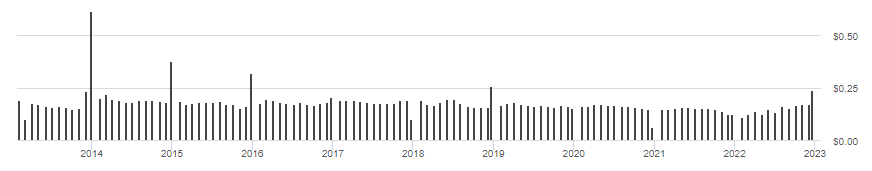
Payments thru 2022 show a rising pattern, with an extra payout at yearend. Even so, the regular monthly payout is just getting back to where it was in late 2019. Seeking Alpha gives PFF a “C-” grade.
seekingalpha.com PFF scorecard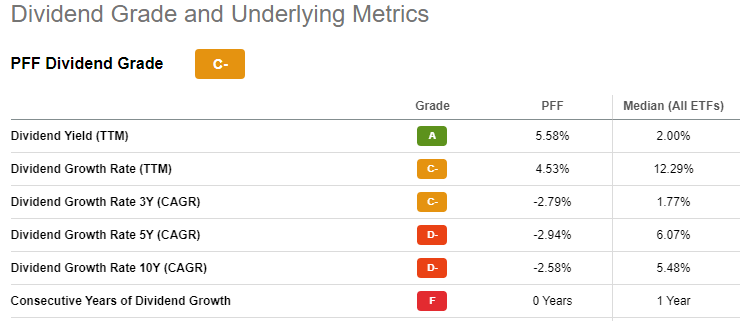
VanEck Preferred Securities ex Financials ETF review
Seeking Alpha describes this ETF as:
The investment seeks to replicate as closely as possible, before fees and expenses, the price and yield performance of the ICE Exchange-Listed Fixed & Adjustable Rate Non-Financial Preferred Securities Index. PFXF started in 2012.
Source: seekingalpha.com PFXF
PFXF has $1b in AUM, a fraction of what PFF holds. This ETF has slightly lower fees, 40bps; and offers investors a bit more in TTM yield: 6.25%.
Index review
This Index follows all the same methodology rules as PHGY, with the addition of this expected restriction:
Securities associated with Financial sector issuers based on the ICE sector classification schema are excluded, as are 144a securities without registration rights, RegS securities, securities with sinking funds and securities in legal default.
Source: indices.theice.com/home PFAN
ICE provided this overview of the Index holdings:
indices.theice.com PFAN index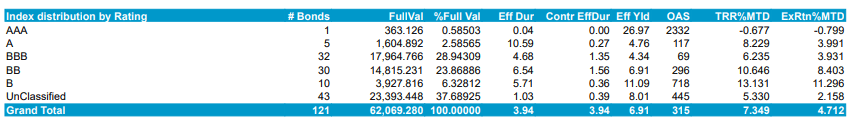
PFXF holdings review
vaneck.com ratings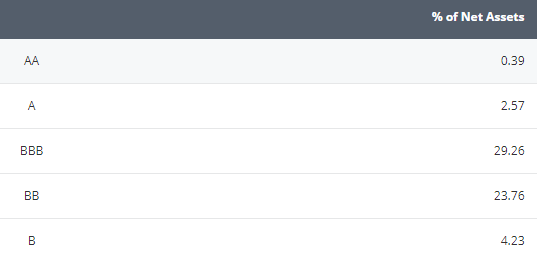
There is a slight weighting toward investment-grade over non-investment-grade, but the non-rated percentage is a high 36%. The maturity schedule shows 25% under 3 years and over 60% at 30+ years; very little in between. Over 88% are from US-based issuers, with the UK and Canada making up most of the rest.
The largest ten sectors are as follows:
vaneck.com sectors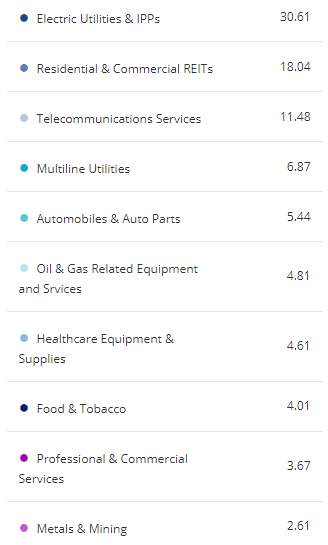
One advantage of excluding Financial issuers is the odds are most of the holdings come with a cumulative payment feature, meaning any missed payouts must be made before the common stockholders receive a dividend payment.
Top 20 holdings
vaneck.com; compiled by Author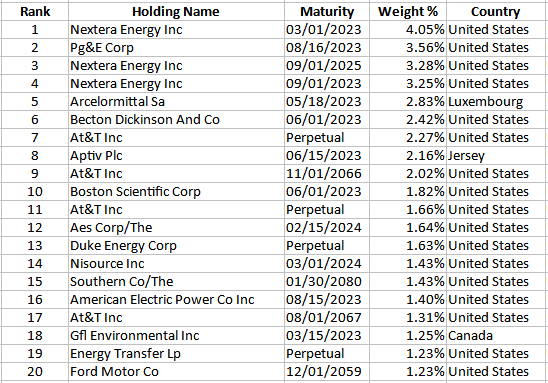
With only 122 holdings, here the Top 20 positions represent 41% of the portfolio; the bottom half is 25% of the weight. Like PFF, PFXF also holds non-US issued assets (12%), but again, all are denominated in USD, so there is no currency risk. About 23% of the portfolio matures this year. Since these are all own by PFF, where maturities dates were not provided, that means at least 8% of that ETF’s portfolio should do the same, plus any of the other assets not owned by PFXF.
PFXF distribution review
seekingalpha.com PFXF DVDs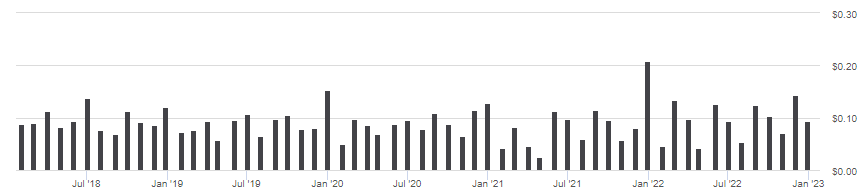
I see no distinct pattern in their payouts other than inconsistency. Even so, the Seeking Alpha dividend scoring system gives PFXF an “A” rating.
seekingalpha.com PFXF scorecard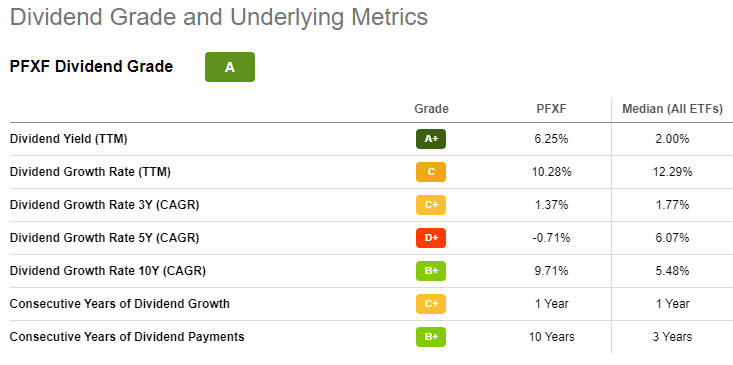
Comparing ETFs
Besides the wide difference in the sectors owned due to PFXF excluding Financial company preferreds, here are other common measures used to compare fixed income ETFs.
| Factor | PFF ETF | PFXF ETF |
| AUM | $13b | $1b |
| Fees | 45bps | 40bps |
| Yield | 5.6% | 6.25% |
| Credit rating | BBB- | BB+ |
| Assets held | 495 | 122 |
What data I found related to duration or maturities wasn’t detailed enough to calculate what I deemed accurate enough to use. I can say both sets of values would be on the long-side from what I found. That should help both ETFs once interest rates stop climbing and start to retreat.
PortfolioVisualizer.com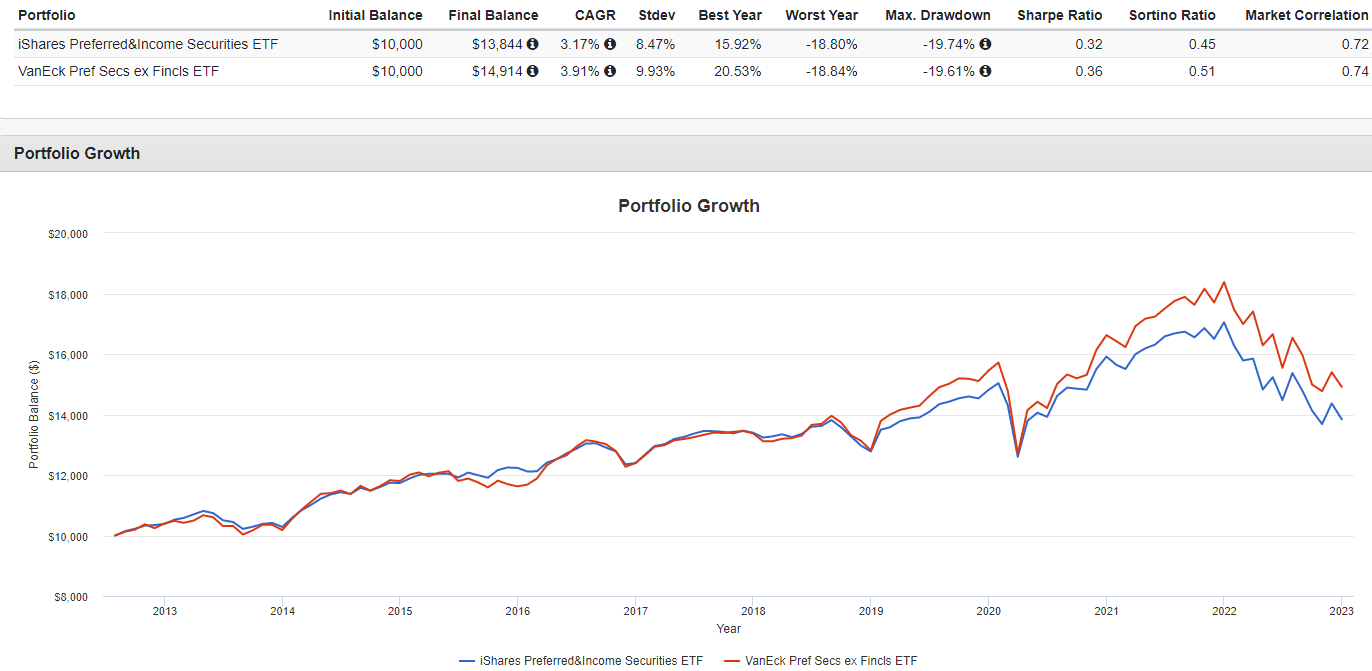
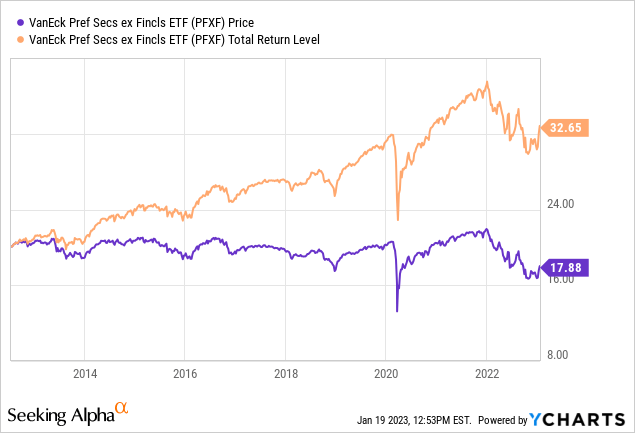
Dating back to when PFXF started in 2012, that ETF has provided for better returns, though with more risk as measured by StdDev. The Sharpe and Sortino ratios say investors are being compensated for that extra risk.
The next website allowed me to pick up the days the free version of Portfolio Visualizer truncates and shows the return difference investors achieved based on whether they reinvested or took the payouts.
dividendchannel.com DRIP Calculator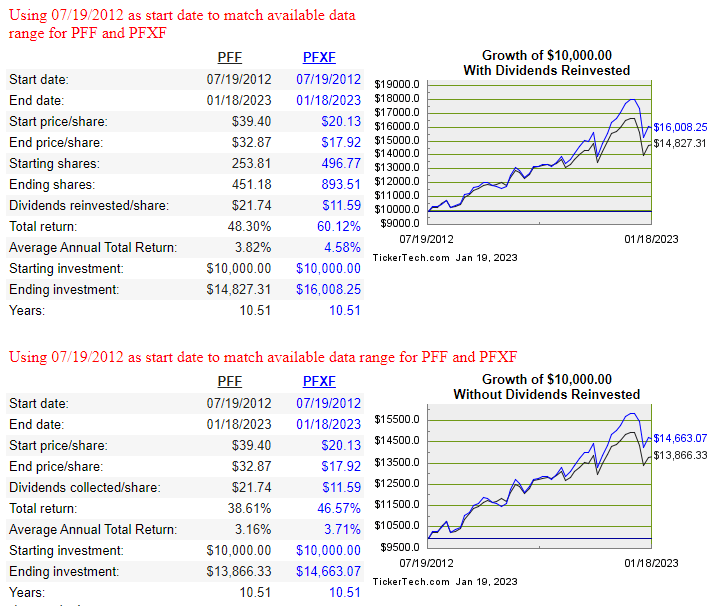
Besides showing how strong both ETFs have been since the year started, it shows PFXF re-investors had a bigger return boost than PFF investors who re-invested, compared to those who did not for either fund (76bps vs. 55bps).
Seeking Alpha grades and ranks ETFs on multiple factors. Here is the summary for both ETFs.
seekingalpha.com; homepage of each ETF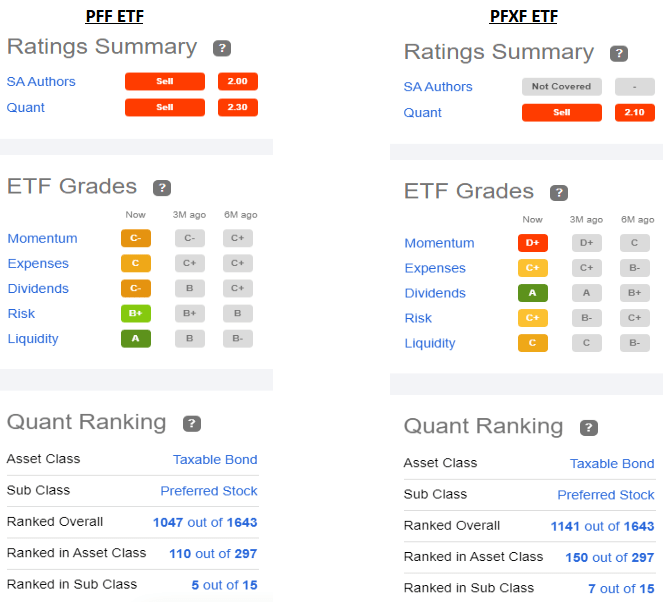
Portfolio strategy
Looking purely at the numbers, PFXF has done better by investors than PFF has by about 11% over the past decade. The question then becomes is that enough of a difference to accept the different allocation strategies employed? Questions an investor might ask are:
- Percent of cumulative vs non-cumulative exposure? PFXF provides greater protection. During the COVID spring, several preferreds did skip payments.
- Financial Issuer avoidance? This radically changes the sector exposure of the two ETFs. In my view, it makes PFF more interest-rate sensitive, as its sector allocations tilt more in that direction in terms of profit effect. That said, 2022 doesn’t confirm this point.
- Concentration levels? With 75% less spread in assets owned, PFXF is much more concentrated and thus the potential of a default having greater effect on the value of the ETF.
- Overall exposure? My guess is most Preferred stock owners have positions in multiple funds. Adding PFXF to that mix than reduces the Financial industry exposure risk.
Be the first to comment