

RUB, CAD and NOK: prices, news and analysis:
- US inventories of crude oil are rising and OPEC+ will likely agree a small output increase when it meets tomorrow, putting downward pressure on oil prices.
- That’s negative for petrocurrencies such as the Russian Ruble, Canadian Dollar and Norwegian Krone, and therefore positive for USD/RUB, USD/CAD and EUR/NOK.
Petrocurrencies under downward pressure
The climb in crude oil prices that began in mid-August has run out of steam in recent sessions and the next move could be lower – potentially putting downward pressure on petrocurrencies such as the Russian Ruble, Canadian Dollar and Norwegian Krone.
Currently, there are two negative influences on oil after its advance on increased demand as the global economy recovers from the downturn caused by the coronavirus pandemic. First, US crude oil inventories are rising, with private-sector data yesterday showing a surprise increase of 3.594 million barrels in the week to October 29 when a much smaller 1.567 million rise had been predicted.
Second, the OPEC+ group of oil producers meets tomorrow and will likely stick to its plan to raise output, albeit by only small monthly amounts.
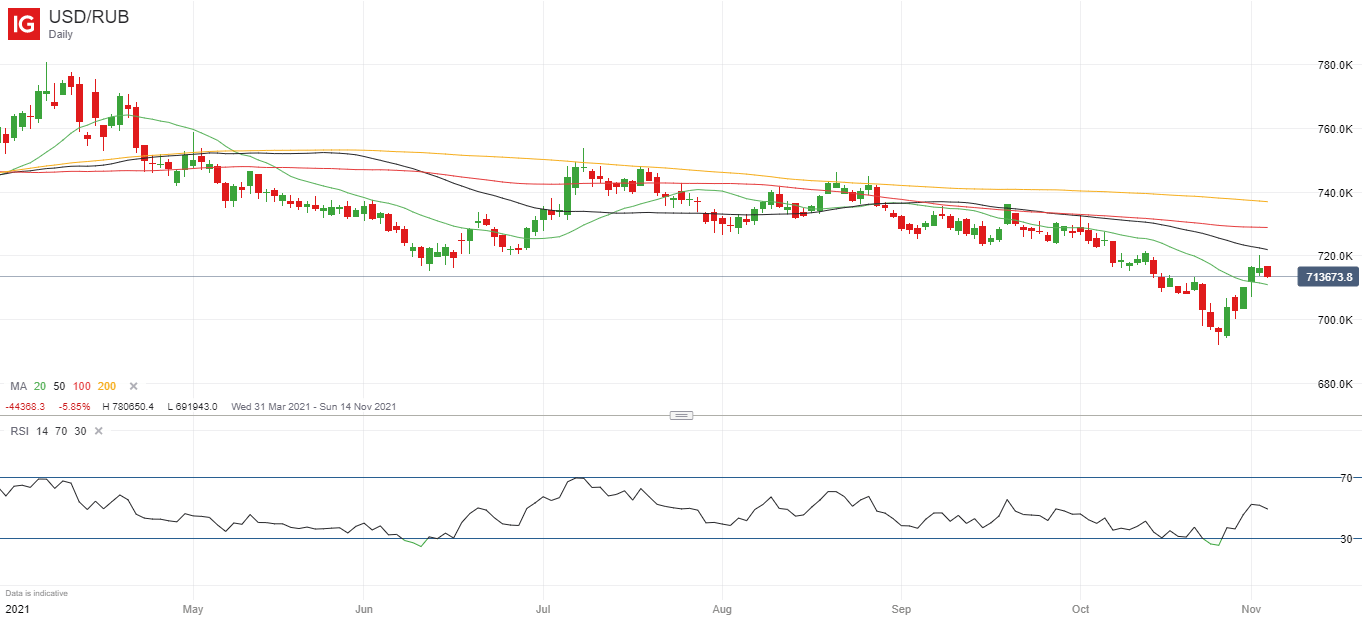
That’s not just a downside risk for oil prices but also for those countries like Russia, Canada and Norway that export oil, and therefore for their currencies. A move lower in oil prices therefore has the potential to strengthen USD/RUB, USD/CAD and EUR/NOK. Here’s USD/RUB for example:
USD/RUB Price Chart, Daily Timeframe (March 31 – November 3, 2021)
Source: IG (You can click on it for a larger image)
As the chart shows, USD/RUB has been falling steadily since mid-April as the Ruble has strengthened but the trend was reversed on October 26 and that correction will likely continue unless the OPEC+ group, which includes Russia, has a late change of heart.
CAD and NOK also affected
Canada and Norway are also seen as petrocurrencies, even though Norway is far less reliant on oil than it once was. Similar corrections higher would therefore be no surprise in USD/CAD and EUR/NOK, with the former potentially moving up after a lengthy period of sideways trading.
USD/CAD Price Chart, Daily Timeframe (June 8 – November 3, 2021)
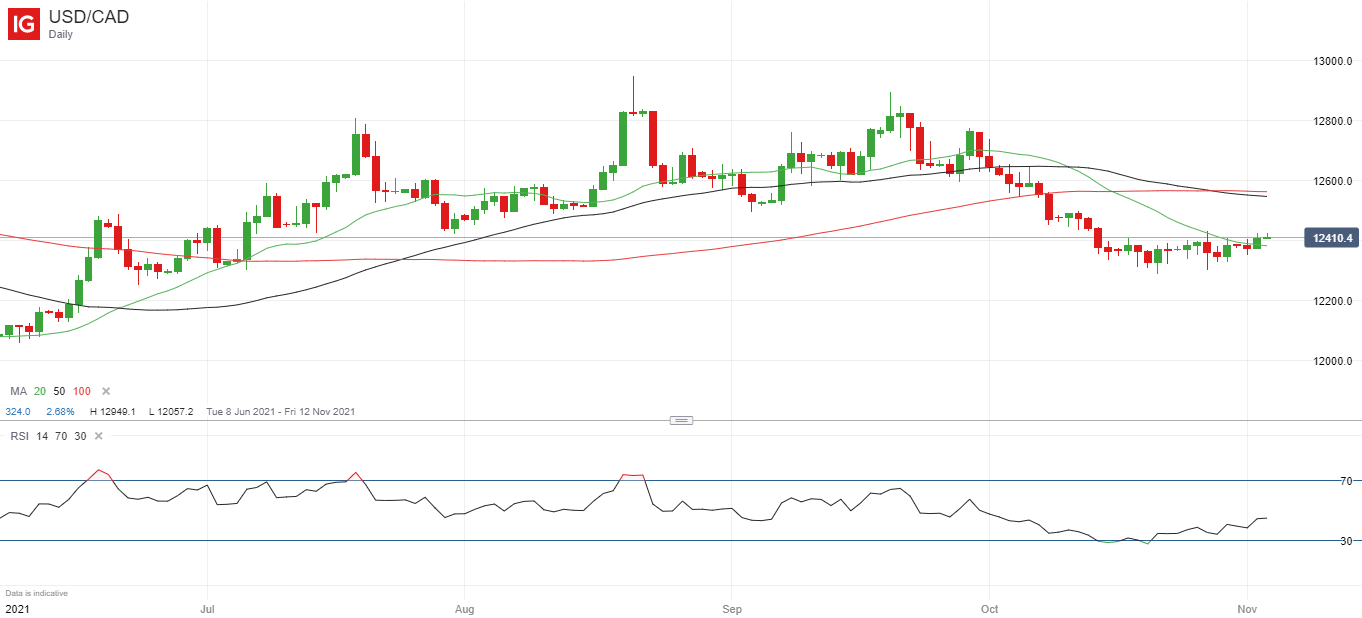
Source: IG (You can click on it for a larger image)
Sentiment data also bullish for USD/CAD
This bullish outlook for the pair is backed by retail trader positioning figures. IG client data show 72.36% of traders are net-long USD/CAD, with the ratio of traders long to short at 2.62 to 1. The number of traders net-long is 2.79% higher than yesterday and 7.10% lower than last week, while the number of traders net-short is 7.34% higher than yesterday and 0.53% higher than last week.
Here at DailyFX, we typically take a contrarian view to crowd sentiment, and the fact traders are net-long suggests USD/CAD may continue to fall.Yet traders are less net-long than yesterday and compared with last week. Recent changes in sentiment warn that the current sideways move in USD/CAD may soon end and a trend higher begin despite the fact traders remain net-long.
— Written by Martin Essex, Analyst
Feel free to contact me on Twitter @MartinSEssex
Be the first to comment