

tugores34/iStock via Getty Images
Company Performance
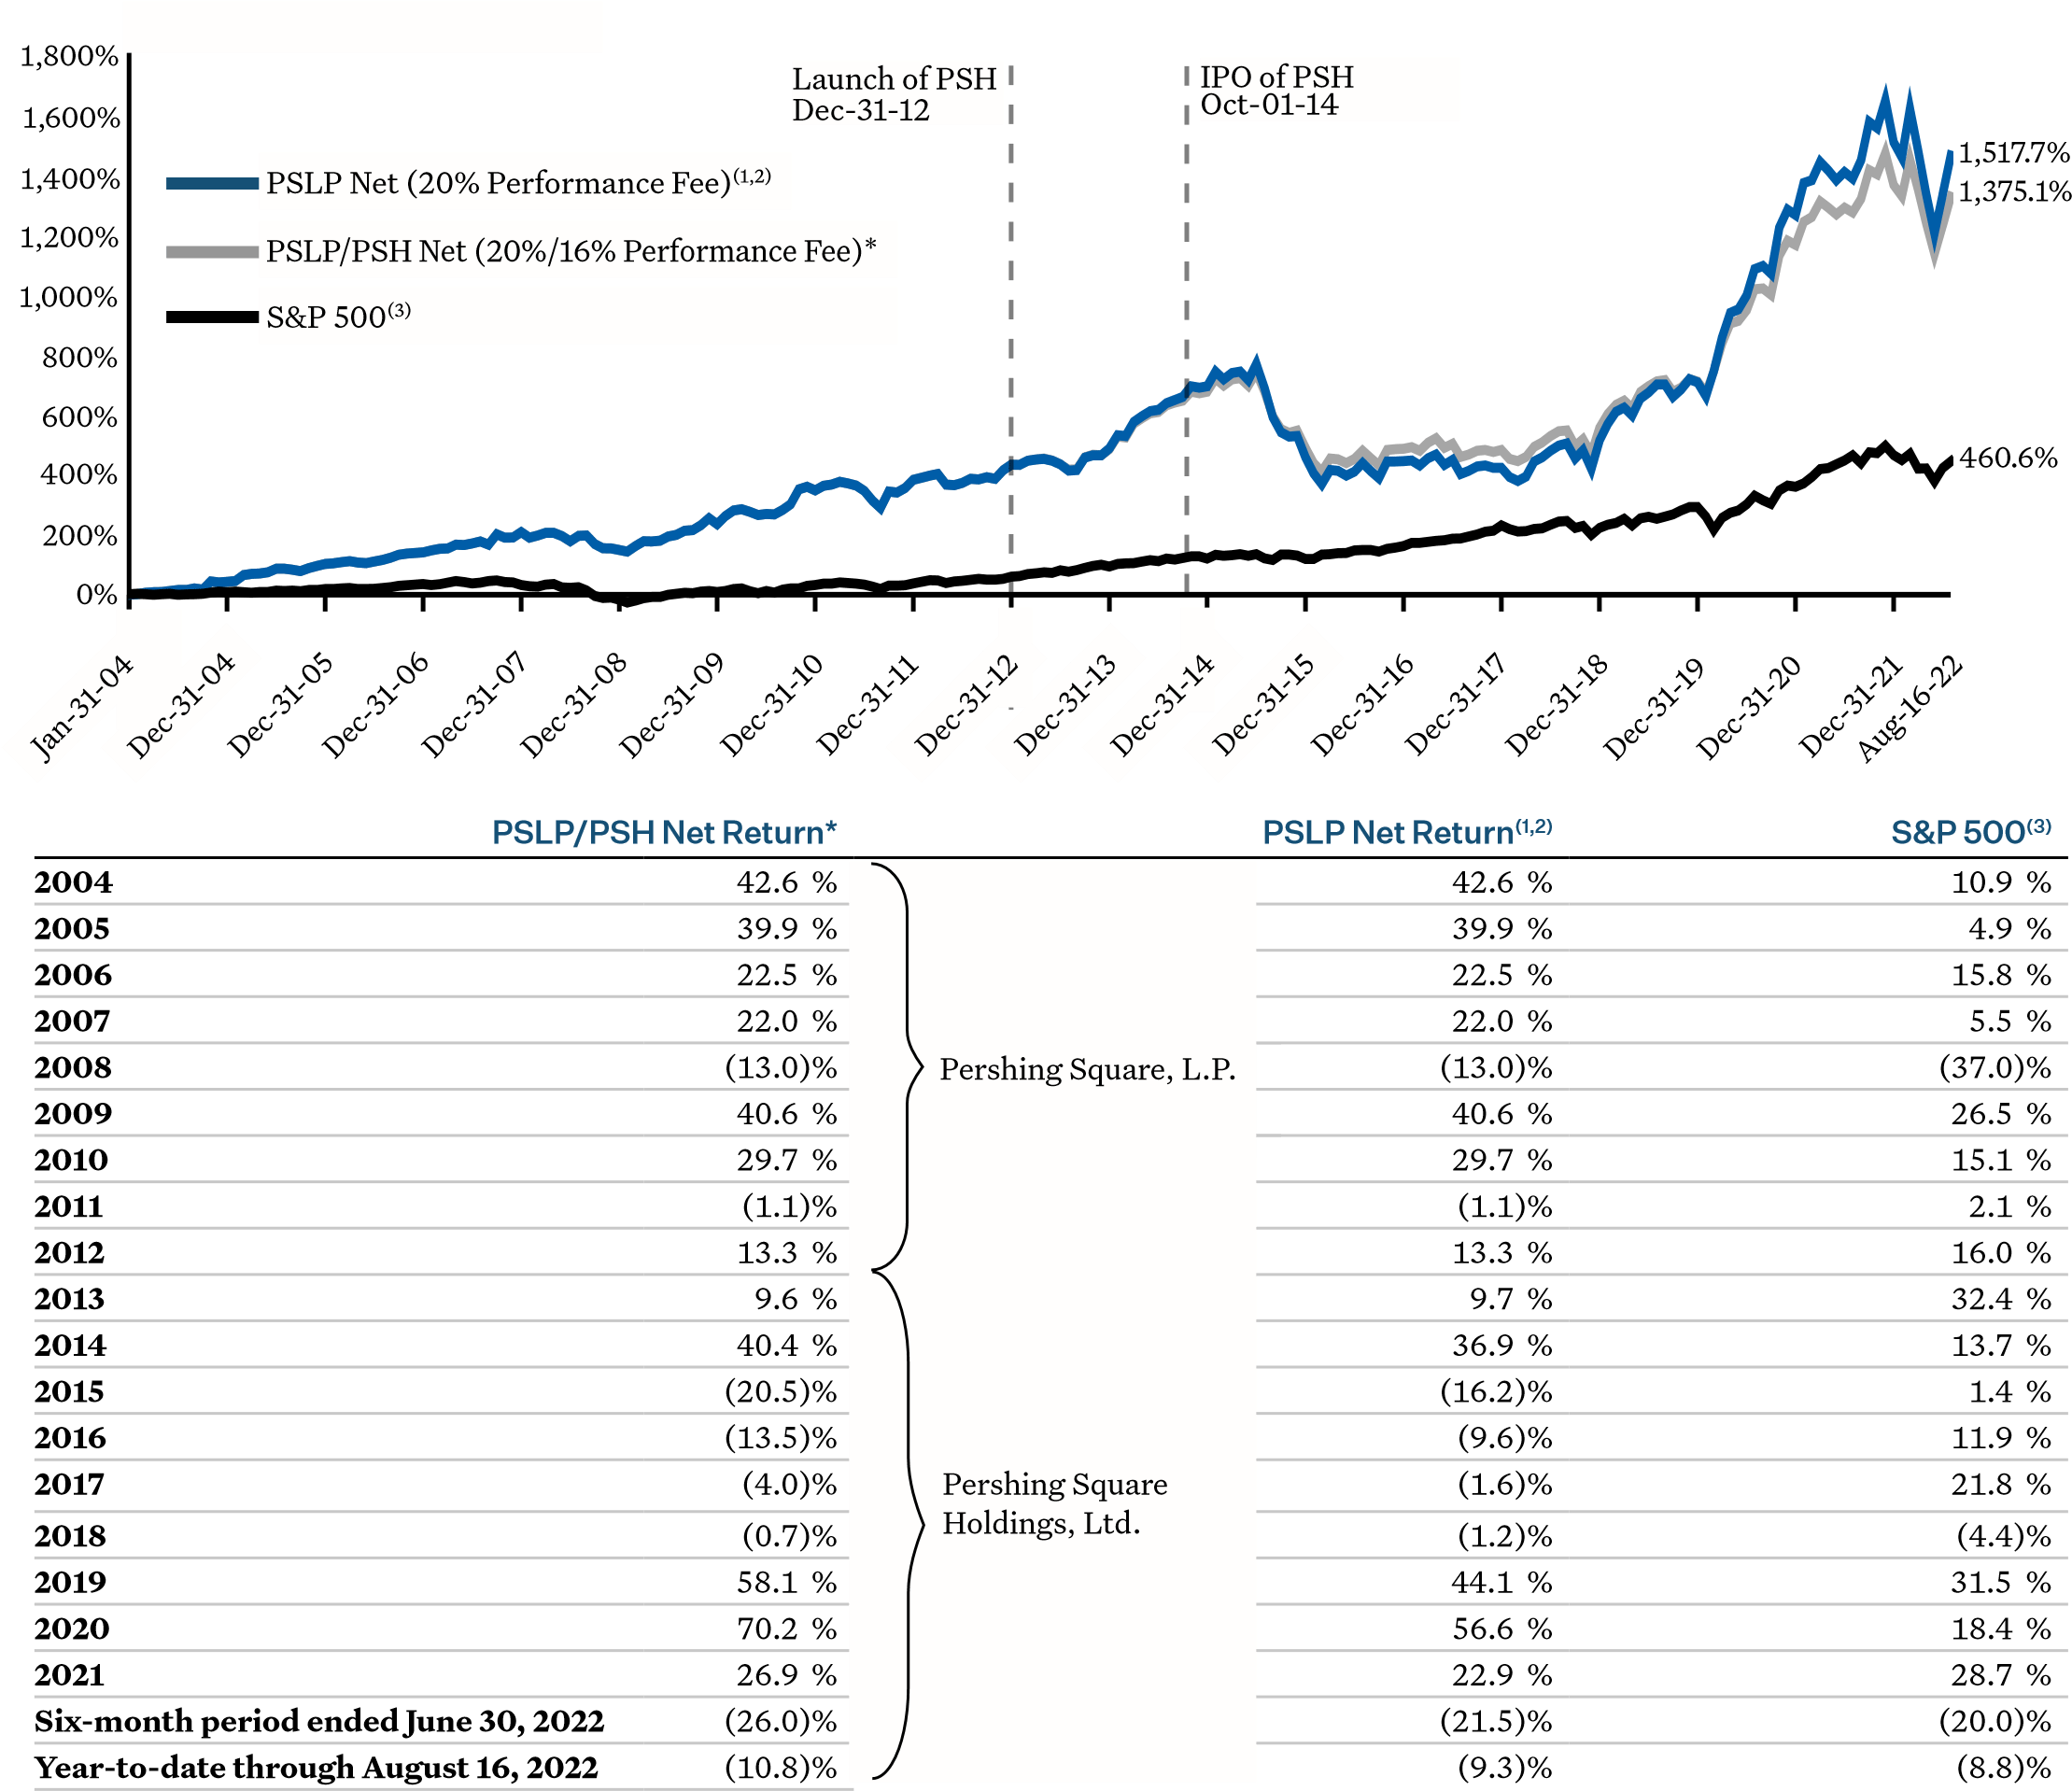
Pershing Square Holdings, Ltd and Pershing Square, L P (“PSLP”) NAV Performance vs the S&P 500
|
January 1, 2004 – August 16, 2022(1,4) |
|||
|
Cumulative (Since Inception) |
1,517.7 % |
1,375.1 % |
460.6 % |
|
Compound Annual Return |
16.1 % |
15.5 % |
9.7 % |
|
December 31, 2012 – August 16, 2022(1,4) |
|||
|
Cumulative (Since PSH Inception) |
205.1 % |
178.3 % |
263.2 % |
|
Compound Annual Return |
12.3 % |
11.2 % |
14.3 % |
| * NAV return an investor would have earned if it invested in PSLP at its January 1, 2004 inception and converted to PSH at its launch on December 31, 2012. Also see endnote 1 on page 53. Past performance is not a guarantee of future results. All investments involve risk, including the loss of principal. Please see accompanying endnotes and important disclaimers on pages 52–55. |
Investment Manager’s Report: LETTER TO SHAREHOLDERS
To the Shareholders of Pershing Square Holdings, Ltd:
In the first half of 2022, Pershing Square Holdings generated NAV performance of negative 26.0%, and a slightly lower total shareholder return of negative 27.3% due to the widening of the discount to NAV at which PSH’s shares traded.5 PSH’s year-to-date NAV return through August 16, 2022, was negative 10.8% compared to negative 8.8% for the S&P 500 index over the same period.6
The Year to Date
2022 has been an unusual and highly volatile year in the capital markets. This volatility has been driven by uncertainty associated with high levels of global inflation, central-bank-led increases in interest rates and related confusion about monetary policy, the risk of a possible recession, the war in Ukraine, political divisiveness and discord, and fear and unease about climate change and geopolitical risk. Each of these factors on their own could be a cause for a high degree of stock market volatility. When combined, uncertainty and volatility rule the markets.
Our approach to investing capital is to find extremely durable, well-capitalized, high-quality growth companies that can survive any storm. If we are successful in our investment selection, we can largely ignore shorter-term factors that drive stock market movements and remain focused on our portfolio companies’ underlying business performance. As long as our companies continue to deliver the results we expect, we do not need to make any material adjustments to our portfolio’s composition. In other words, we can sail through the stormy seas with a focus on the long-term horizon.
We don’t, however, ignore global events that create risk and uncertainty. While we try to consider every potential risk that could impact our portfolio companies and invest in businesses that can withstand these risks, the world is and will remain a highly uncertain place, so a high degree of vigilance will always remain appropriate. Staying knowledgeable about global macro and political events is important for assessing risk for our portfolio companies and in selecting new company investments. It also occasionally offers opportunities for profits from carefully selected hedging transactions.
One of our strategy’s important competitive advantages is our ability to profit from unanticipated market events enabling us to generate large profits and liquidity from hedges during periods when equity prices are likely to decline substantially.
Our investments in: (1) index and single-name credit default swaps before the Great Financial Crisis, (2) investment grade and high yield index CDS in the weeks prior to Covid impacting the markets, and (3) interest rate swaptions in late 2020 to the present day in light of our concerns that interest rates would rise more quickly and remain at higher levels than anticipated, are all good examples of the importance of our understanding and foreseeing the impact of global macro risks and hedging them when we can identify an asymmetric means to do so.
If It Is So Obvious, Why Doesn’t Everyone Do It?
While our approach to investing capital is logical and straightforward and has a long-term outperformance record, it is the rare investment manager that can implement such a strategy. Many of our colleagues in the industry have told us that they would prefer to invest as we do with their own money, but that their investors’ demands effectively prohibit such an approach.
While many investors in funds claim to be long term, they require short-term liquidity from their managers. When managers oversee funds that can be withdrawn on short notice, they generally have no choice but to manage for the short term. Furthermore, most investors in funds are fiduciaries who are themselves held to short-term measurements of their own performance. So when the inevitable period of underperformance occurs due to broad-based market movements or otherwise, investors in funds redeem their capital, and their managers become forced sellers.
The inherently short-term nature of the investment management industry is a large contributor to stock (and bond) market volatility. As many funds suffered substantial drawdowns earlier this year, they sold stocks to raise capital to meet redemptions, and reduced market exposure as their risk appetites declined.
This pattern of reducing equity market exposure as stock markets decline occurs in every market disruption, but it is precisely the opposite of what long-term investors should do. It is axiomatic that the lower the price paid, the better one’s long-term returns. Yet, in each crisis and/or market drawdown, fund managers sell and reduce exposures, rather than increase exposures at more favorable valuations.
The inverse is also true. Investors in funds generally commit more capital when funds are generating strong absolute performance. During the ebullient market which preceded this year’s decline, investors committed more capital to funds which put the money to work at higher valuations. Investments at higher valuations are destined to generate lower returns.
Pershing Square Holdings’ closed-end fund structure and large insider ownership provide us with the ability to be a truly long-term investor in a world where the vast majority of fund managers are constrained to a shorter-term approach. Our long-term investment approach is one of our most important competitive advantages and a major contributor to our substantial outperformance over the last nearly 19 years.7 We believe that our even larger outperformance since early 2018 can be explained by our transition from a manager of shorter-term redeemable assets to a manager of effectively perpetual assets.
Today, substantially all of Pershing Square’s assets under management are in PSH or represent capital invested in our private funds by affiliates of the investment manager.8 The permanency of our asset base allows for a truly long-term investment approach. We have not raised any net new equity capital in years so we are not exposed to the risk of raising capital at market peaks.
Furthermore, we have been active in periodically returning capital when PSH is trading at a ‘double discount’ by repurchasing PSH shares opportunistically when our portfolio companies are trading at attractive valuations and PSH is trading at a wide discount to NAV. Our estimate of today’s ‘proforma NAV,’ PSH’s NAV assuming our portfolio companies were trading at their intrinsic value, is more than twice our current share price.9
Our effectively perpetual capital is also a great recruitment tool for talent. The universe of firms where one can go to invest permanent capital is extremely small. For all of the above reasons, the most talented investors prefer to work for a firm that is able to implement a long-term investment approach.
Our closed-end fund structure is also a competitive advantage in allowing us to access low-cost, investment grade leverage in the form of unsecured bonds without mark-to-market covenants on fixed rate terms. Of PSH’s total assets, 19% is funded by long-term bonds with laddered maturities beginning five years from today until 2039 at a weighted-average interest rate of 3.1%.10 By using low-cost, long-term debt in place of one-fifth of our equity capital we have materially enhanced our ability to generate high rates of returns without, in our view, any meaningful change in our risk profile.
In summary, our closed-end fund structure is an enormous competitive advantage for how we invest capital, recruit talent, and raise low-cost and low-risk unsecured bond leverage. It has, however, come with one negative externality. In recent years, PSH has traded at a large discount to its NAV.
Discount to NAV
In a private fund or in an open-ended mutual fund which invests in liquid assets, investors are guaranteed to receive the net asset value of their holding when they redeem. The same is not true for a closed-end fund as investors are exposed to the risk that a closed-end fund’s share price trades at a greater discount to NAV when they exit than when they originally purchased their shares.
Since late 2015, the beginning of a several-year period of underperformance, PSH began trading at a large discount to NAV which has widened over time. While this discount is an advantage when we buy back our shares, it is a disadvantage to a shareholder when they decide to sell. The substantial majority of our shares are owned by investors who purchased PSH at a discount to NAV which helps to mitigate the negative impact of the NAV discount on their returns. As long as one sells PSH at a similar discount to that when the shares were purchased, one’s return will approximate PSH’s underlying NAV performance.
Our discount has persisted despite best-in-class performance and the aggressive steps we have taken to address it:
- Based on Bloomberg data (please see Appendix A), PSH has the best five-year NAV return of the 100 largest closed end equity funds in the world, which includes funds ranging from $774 million to $16.6 billion in net asset value. 11
- PSH became a premium listed company on the LSE on May 2, 2017 and joined the FTSE 100 on December 21, 2020, which has led to increased index inclusion and demand for our shares.
- With the benefit of some new director additions, we have a best-in-class, independent, extremely knowledgeable, experienced, and diverse board.
- Affiliates of the manager have acquired large amounts of PSH shares in the open market and now own 25.5% of the company,12 which ranks among the largest inside ownership in the top 100 closed-end funds.
- PSH has repurchased 22.5% of its shares outstanding since its IPO, a total of 54 million shares at a price of $17.32 and an average discount of 27.1%.
- PSH initiated a dividend in 2019, and earlier this year announced a new dividend policy whereby dividends will increase over time with NAV.
One would expect that with best-in-class performance and governance, the acquisition and ownership of more than one quarter of the company by the investment manager, an aggressive and opportunistic share repurchase program and a favorable dividend distribution policy, PSH’s NAV discount should have narrowed, but in fact the opposite has occurred. Why?
The Supply of PSH Shares and Our Market Cap
PSH’s discount to NAV is directly related to the supply and demand for PSH shares. With respect to the supply of shares, the number of PSH shares has decreased due to buybacks by 22.5% since our IPO. Acquisitions of shares by affiliates of the investment manager reduced our public float by an additional 39 million shares or 16.3%,13 a 39% cumulative reduction in our public float since our IPO.
PSH is the second largest closed-end fund in the world by NAV after Scottish Mortgage, and the third largest by market cap. One might ask, therefore, whether there is a correlation between the market cap of a closed-end fund and the discount at which the fund’s shares trade.
Is Size a Contributor to the Discount?
Based on the Bloomberg data, there does not seem to be any correlation between the size of a closed-end fund and its trading level relative to NAV. A number of the 15 largest closed-end equity funds trade at premiums to NAV, and the balance, other than PSH, trade at single-digit percentage discounts.
PSH has vastly outperformed the other top 15 closed-end funds as well as the other 85 constituents over the last five years. PSH has outperformed 90 of the top 100 by more than 1,000 basis points per annum. The median and average discount to NAV for the top 100 equity closed-end funds with greater than a $1 billion market cap is 4% and 3% respectively compared with PSH’s current discount of 35%.
Scottish Mortgage Investment Trust (OTCPK:STMZF), the largest fund on the list by market capitalization, is an interesting point of comparison. Despite its name, it like Pershing Square is a growth equity closed-end fund and also a FTSE 100 company. SMT has a long and volatile investment history beginning in 1909. PSH has substantially outperformed Scottish Mortgage over the last one-year (6% vs -29%), three-year (27% vs 23% compounded annually) and five-year (24% vs 18% compounded annually) periods.14 Yet SMT trades at a 6% discount to NAV versus PSH’s 35% discount to NAV.
While PSH charges higher fees than most other closed-end funds largely due to our incentive fees, our NAV outperformance record is net of all fees and expenses. PSH’s fee structure was not a barrier to raising $2.9 billion in PSH’s IPO, the largest IPO in Europe in 2014, as the shares were sold at NAV and the fee arrangement was understood by all investors.
We have no plans to change our fees as our incentive and management fees are an important recruiting tool for our talent, who are responsible for our substantial outperformance. Pershing Square recruits investment team talent principally from private equity firms which also charge incentive fees. None of our investment team members would have joined Pershing Square and stayed if we did not continue to earn incentive fees.
There appear to be only three other closed-end funds in the top 100 that charge management and incentive fees. One of these funds trade at a 10% premium to NAV and the other two trade at 12% and 19% discounts, which suggests that there is no clear relationship between the fee structure and the degree of NAV discount or premium.
Demand for PSH Shares
While PSH is managed by a U.S. manager and principally owns North American headquartered companies, it trades only on European exchanges, the LSE and Euronext Amsterdam. There are significant regulatory limitations in our ability to market PSH in various jurisdictions, including the U.S, a more logical market for a North American-centric fund run by a U.S. manager. Substantially all other closed-end funds that invest principally in North American equities are domiciled in the U.S. and therefore do not have restrictions on marketing in the U.S.
The rest of world demand for PSH has mostly been driven by dedicated closed-end fund investors and to a lesser extent index funds that own the shares based on their index weightings.
In summary, we have a demand problem compounded by certain marketing limitations.
What Can We Do About It?
There is no short-term solution to PSH’s discount problem. While a liquidation would eliminate the discount, offset somewhat by frictional costs, it would also eliminate the long-term opportunity for PSH to generate high levels of compound annual returns. We believe the long-term investment opportunity for PSH vastly outweighs the short-term profits that would come from a liquidation.
We can, however, always do a better job marketing and informing investors about the existence of PSH. Despite the fact that PSH is the 78th largest company by market cap on the LSE, and would be 51st on the list if it traded at NAV, PSH is still relatively unknown by global investors. While Pershing Square, the investment manager, appears in numerous press articles nearly every business day, PSH is largely absent from the media. Even considering our marketing restrictions, we can still do more to inform investors about the existence of PSH and our investment opportunity.
Could PSH Eventually List in the U.S.?
As PSH grows in market capitalization and its ownership stakes in its portfolio companies increases, one can envision a world in which over time PSH becomes a controlling owner of one of more businesses that comprise the substantial majority of our assets and income. We expect to continually evaluate PSH and its operations, and consider whether in the future it may be able to operate not as an investment company in the U.S., but rather as an operating company that could be listed in the U.S.
How Should One Think about PSH?
In economic substance, PSH is more akin to an investment holding company than a traditional passive owner of securities. We are often the largest, or one of the largest owners of our portfolio companies, particularly if passive index owners are ignored. We are known to be an active and engaged investor and often have board representation and/or considerable influence in the board room as a large and thoughtful owner.
Why Have Some Fund Managers Avoided Investing in PSH?
While PSH is owned by many investment managers, we believe these investors are principally dedicated and or specialized closed-end fund investors. Traditional investment managers often avoid investing in closed-end funds as they view doing so as effectively their giving up investment allocation decisions to a third party and paying fees for them to do so. For many years, many investment managers would not own shares in Berkshire Hathaway for similar reasons.
Whether one invests in an operating company or a closed-end fund, however, ultimately the investor is giving up control of capital allocation decisions to the management of the company.
We do not believe that closed-end funds should be an excluded asset class for that reason as long as the manager of the closed-end fund can generate attractive rates of long-term performance, net of the fees it charges, that are competitive with returns from other public operating company investments, with the caveat, of course, that the investors can’t simply replicate the performance of the closed-end fund by investing directly in the same underlying securities.
In our 2020 letter to shareholders, we explain why PSH replication cannot be achieved by attempting to invest directly in the same securities we publicly disclose. To summarize, this is due to three principal factors:
- Investors in PSH get the benefit of our new, undisclosed investments at the price they were acquired by PSH before their eventual public disclosure impacts their price. Historically, the day-one trading price of our newly disclosed stake in a company typically has been substantially above our cost of acquisition. PSH replicators must pay the higher post disclosure price rather than our acquisition cost. These embedded gains inure to the benefit of PSH shareholders, and to an even greater extent when PSH is purchased at a discount to NAV.
- We do not disclose our hedging strategies in advance of their implementation. Our hedges have generated highly material gains for PSH that are not readily actionable or replicable by most investment managers.
- We are able to access long-term, low-cost investment grade debt without mark-to-market covenants, which materially reduces our cost of capital. Our access to covenant-light leverage is a difficult to replicate competitive advantage.
While many investment managers avoid investing in funds that charge fees, the effective fee burden of PSH has been largely offset over time by our low-cost bond leverage (a weighted-average cost of 3.1%) that we have used in place of about 20% of our equity capital. In other words, investors in PSH receive a similar long-term NAV return to what they would have earned if they owned our underlying investments directly without leverage, as our use of bond financing roughly offsets our management and incentive fees.
While some fund managers may choose not to invest in PSH because it is technically a closed-end fund, we believe that with the passage of time and continued strong performance, our tax and regulatory structure will be viewed as a competitive advantage and a reason to own PSH rather than a reason to avoid it.
We chose the offshore closed-end fund structure for PSH with a full understanding of its marketing and other limitations. We did so because we believed that the offshore closed-end fund’s favorable tax structure (with no entity-level taxation) and investment flexibility versus other alternatives would give PSH long-term structural and competitive advantages in generating high rates of return over time.
Today’s extraordinary discount of 35% makes PSH’s investment proposition that much more compelling, and should hopefully remove some of the traditional fund managers’ resistance to investing in closed-end funds.
In summary, we believe that PSH is an excellent investment opportunity for both dedicated closed-end investors and the much larger universe of traditional investment managers because the typical reasons for an investment manager not including a closed-end fund in their portfolios don’t apply to PSH. We just need to do a better job getting the word out.
Organizational Update
The Pershing Square investment team is intentionally small. Currently, we have eight team members including myself, and at peak, we had ten. The team operates extremely collaboratively. Each member of the team’s compensation is directly dependent on the performance of the overall portfolio rather than individual investments. Research on new investments is typically led by two members of the team, but vetted by the entire team. This structure has served us well over the years as it has aligned everyone’s incentives with Pershing Square’s long-term goals.
The team has operated in an entirely non-hierarchical format with one exception. As portfolio manager, I get to make the final yes or no decision on investments and in determining the sizing of positions. With the benefit of effectively no turnover in the team over the last five or so years, our investment team is the most highly functioning it has ever been.
I periodically get asked about succession planning at Pershing Square. At age 56, loving what I do and in excellent health, my principal risk is what can be deemed “pie truck risk,” that is, the risk I look the wrong way crossing the street and get smooshed by a pie truck.
As a manager of perpetual capital, I am obligated to give some insight to our shareholders as to how we would operate if the pie truck ended my existence. I don’t believe in a committee approach to investing where a majority vote determines each portfolio decision. At the end of the day, someone needs to make the decision and be held accountable.
I am pleased to announce that Ryan Israel, who joined Pershing Square from Goldman Sachs in March of 2009, will now become our Chief Investment Officer. I will continue as CEO and Portfolio Manager with continued control over ultimate decision making, but if the pie truck were to run me over tomorrow, Ryan would be my choice to manage the portfolio.
We are extremely fortunate in having an investment team where each member would be a star at any other firm, and could if they wished, leave to launch their own firms. Most members of our investment team that have left Pershing Square in previous years have been successful in setting up their own firms, and the same would be true for our current team members.
In selecting among our investment team for a CIO, I chose Ryan for a number of reasons. First, he is of exemplary character and is an extremely high-quality human being. He is a once-in-a-generation talent as an investor, not just in equities, but also in macro instruments. He is an excellent leader, teacher, communicator, and partner, and has the respect of each member of the investment team.
As the longest-tenured member of the team, he has had the greatest opportunity to experience our profoundest successes and failures in dramatically different market environments and to learn from them. He has also had the opportunity to train most of our team members in our approach to investing.
We have built a culture that requires extreme candor. Ryan is unafraid to challenge anyone including yours truly, and that is an extremely important quality in a CIO. Ryan is the right choice, and importantly, when I checked with each of the other team members, they all agreed.
My decision to announce Ryan as CIO should in no way suggest to you that I am heading for the hills. I love this business and intend to stay active until they carry me out, and I am a heavy lift. I don’t expect that our investment team will function differently beginning the day after this announcement. Ryan has already for some time been unofficially serving in this role.
It has been an extraordinary year filled with uncertainty, the tragic war in Ukraine, enormous capital markets volatility, and political divisiveness. Even more so in this environment, we feel extremely fortunate to have the backing of long-term investors who enable us to do our best work. We are perpetually extremely grateful.
As always, please reach out to ir@persq.com if you have any questions for us.
Sincerely,
William A. Ackman
PORTFOLIO UPDATE
Performance Attribution
Below are the contributors and detractors to gross performance of the portfolio of the Company for the six-month period ended June 30, 2022 and year-to-date August 16, 2022.15
|
|
| Contributors or detractors to performance of 50 basis points or more are listed above separately, while contributors or detractors to performance of less than 50 basis points are aggregated, except for bond interest expense and share buyback accretion. Past performance is not a guarantee of future results. All investments involve risk, including the loss of principal. Please see accompanying endnotes and important disclaimers on pages 52-55. |
Universal Music Group (OTCPK:UMGNF)
Universal Music Group is the world’s leading music entertainment company, a high-quality, capital-light business that is led by a superb management team. UMG’s business can be best thought of as a rapidly growing royalty on the greater global consumption and monetization of music.
We believe that UMG’s decades-long runway for growth remains underappreciated by investors. With increasing streaming penetration combined with the development of new services, platforms, and business models, UMG can grow revenues at an annual rate of 10% or so for more than a decade. High absolute levels of revenue growth coupled with UMG’s fixed cost base should allow UMG to significantly expand its operating margins over time, generating highly attractive earnings growth for the foreseeable future.
UMG’s recent results support our longer-term view, as year-to-date, revenues and profits both increased at a mid-teens growth rate, well above analyst expectations and the company’s guidance during last year’s Capital Markets day. When viewed on a multi-year basis, UMG’s revenue growth has both been higher and more consistent than Warner Music Group, its most closely followed peer.
We believe that music is the lowest-cost, highest-value form of entertainment. For a $10 monthly fee (and less in a family plan) one can listen to over 80 million songs. We expect music streaming to be highly resilient, even in a recessionary environment, as consumers forgo other expenses before cancelling their music subscriptions.
While ad-supported streaming revenues can be more sensitive to advertising spend, UMG has maintained a high-teens growth rate year-to-date by consistently expanding its partnerships and renewing existing deals on more favorable terms. UMG is the pioneer in monetizing emerging platforms and first partnered with Facebook/Meta (META) in 2017 – a groundbreaking partnership at the time that served as a template for social media companies to begin paying music rightsholders through fixed payments.
The company recently renewed its Meta deal, significantly expanding the terms to include revenue sharing components. We believe the new Meta deal will boost UMG’s growth over the coming years and represents a framework for future deals with other social media platforms. Over time, we expect the revenue from social media and other emerging platforms such as gaming and fitness to grow faster than traditional streaming and become a more material percentage of UMG’s revenue base.
Music spending per capita is significantly below peak levels which were achieved in the late 1990s both on a nominal basis and when adjusted for inflation. Despite pervasive high levels of inflation in the global economy, streaming prices have stayed relatively constant since their introduction. While digital service providers recently began increasing prices in certain markets, we believe there is ample room to increase pricing in the coming years which will drive increased growth at UMG.
While streaming has been the primary driver of music’s resurgence and will continue to be the primary driver of growth going forward, other revenue streams that were previously declining have also returned to growth. Physical music is experiencing a renaissance driven by vinyl demand. We believe that physical and digital collectibles provide an opportunity for UMG and its artists to better engage with and monetize their superfans.
Bill recently joined the UMG board and we look forward to working even more closely with the company as an engaged long-term shareholder. Given its long runway for sustained earnings growth, we believe that UMG’s current valuation represents a significant discount to intrinsic value.
Restaurant Brands (QSR)
QSR’s franchised business model is a high-quality, capital-light, growing annuity that generates high-margin brand royalty fees from its four leading brands: Burger King, Tim Hortons, Popeyes, and Firehouse Subs.
QSR is investing in each of its brands to position them for sustainable, long-term growth. As Canada reopened, Tim Hortons’ same-store sales returned to growth during the quarter compared to pre-COVID levels, driven by growth across all dayparts, formats, regions and product categories aside from hot beverage. The company is focused on executing the next phase of its “Back to Basics” plan by extending its beverage platform, capturing a greater share of afternoon foods and continuing its brand modernization. Longer-term, management believes it can sustainably grow same-store sales at a low-single-digit rate.
At Burger King in the U.S., the company also reported improved results and narrowed the gap to its peers. Recently-appointed Burger King U.S. President Tom Curtis and his team have begun to lay the foundation for a return to sustainable growth. We believe the company has a meaningful opportunity to reinvigorate growth and modernize its store base through a reinvestment plan. The company will be unveiling its “reclaim the flame” plan to franchisees next month.
Burger King international, Popeyes, and Firehouse Brands continue to perform strongly, with comparable sales up more than 20% relative to pre-COVID levels.
QSR’s franchised-based royalty model is particularly attractive in an inflationary environment. QSR’s revenues benefit when its franchisees increase prices, but its cost structure is not subject to the same inflationary pressures. QSR can continue to grow its business with minimal capital required as its franchisees open new units. Despite delayed permitting, higher material costs, and inflationary headwinds, QSR’s unit growth returned to its historic mid-single-digit growth rate last year.
As a result of improving same-store sales growth coupled with strong unit growth, QSR’s earnings are now greater than prior to COVID and are growing at an attractive rate, in spite of significant industry-level inflation and same store sales that are just now recovering to pre-COVID levels.
QSR continues to trade at a discount to its peers and its intrinsic value. The company has repurchased more than 3% of its shares outstanding over the last twelve months, which when coupled with its 4% dividend yield, enables QSR to return approximately 7% of its market capitalization to shareholders on an annual basis.
Chipotle Mexican Grill (CMG)
Chipotle continued its impressive performance in 2022 driven by the ongoing recovery of in-restaurant sales, price increases to cover cost inflation, and successful menu innovation including pollo asado. During the second quarter, Chipotle continued to lead the restaurant industry in growth for both same-store sales (“SSS”) and new restaurants, with SSS growing 10% year-over-year or 30% on a three-year cumulative basis.
On-premise sales grew 36% as consumers resumed pre-pandemic routines, while digital sales declined only 3%, continuing their persistence despite the growth of conventional sales. Chipotle remains on track to grow its store base by approximately 8% this year with a longer-term annual store growth aspiration of nearly 10% once current headwinds around construction, permitting, and supplies ease.
We believe Chipotle is one of the best-positioned consumer companies for the current inflationary world. Given significant inflation in food and labor costs, management has planned a menu price increase of approximately 4% for August following a similarly-sized price increase in March. The company has tremendous pricing power due to the superb quality of its food which is priced at a discount to many competitors with inferior offerings, marketing focused on food quality and freshness rather than cost, and a customer base that over-indexes to higher-income consumers, some of whom are trading down from pricier alternatives.
Chipotle’s economic model remains firmly intact, with restaurant-level margins in excess of 25% in the second quarter, up 0.8% year-over-year, and a consistent level of profitability expected for the current quarter. The company is debt-free and generates nearly all its sales in the U.S., insulating its earnings from the foreign currency headwinds facing many other large consumer companies.
To accelerate Chipotle’s growth beyond the company’s continued strong results, management is focused on improving throughput for in-store orders, and increasing order accuracy and timeliness for digital orders. While Chipotle’s restaurants are staffed above 2019 levels, many current employees haven’t experienced optimal operations given pandemic-related disruptions and the high rate of employee turnover endemic to the restaurant industry.
Management has rolled out a new labor deployment tool to develop staffing models and is instituting an operational initiative focused on excellent execution of the basics, the latter of which started to bear fruit in 2019 before it was interrupted by the pandemic. We continue to be impressed by Chipotle management’s continuous improvement initiatives, drive to create a superb customer experience and shareholder value creation.
Hilton (HLT)
Hilton is a high-quality, asset-light, high-margin business with significant long-term growth potential, led by a superb management team. The unforeseen arrival of the COVID-19 pandemic catalyzed a rapid and near-complete standstill in global travel, with RevPAR (the industry metric for same-store sales at a given hotel) down roughly 90% at the nadir of the pandemic. We increased our investment in Hilton during the pandemic as we believed the economic dislocation from COVID-19 would prove to be transient and that industry projections regarding the timeline for recovery were too pessimistic.
From the moment the pandemic began, Hilton’s management team took decisive actions to ensure the company not only managed through what it knew would be a challenging period, but also positioned the company to generate improved margins, cash flows, and investment returns once the business recovered. In hindsight, Hilton’s experience with COVID-19 – the 100-year proverbial flood – affirmed the company’s unique high-quality, asset light, high-margin business model, and reinforced our belief that Hilton deserves a premium valuation.
While Hilton entered 2022 impacted by the Omicron variant, results have vastly improved throughout the year as
COVID-19 has evolved towards a more endemic virus, and consumer behavior has adapted accordingly. In recent months, Hilton’s system-wide RevPAR has surpassed 2019 levels and continues to improve. Recent strength has been led by domestic leisure travel occasions as consumer spending continues to shift from goods to services.
We expect demand to continue to strengthen from current levels as anticipated moderation in leisure occupancy is likely to be more than offset by improvements in corporate business transient and group business, both still below 2019 levels. Notably, the industrywide recovery is being led by an unprecedented surge in average daily rate (“ADR”).
Historically a laggard during prior recessions, ADR has been buoyed by a strong consumer appetite to travel, a positive mix-shift from large corporations to small and medium-sized businesses, and broad and accelerating inflationary pressures (hotels can change room rates in real time). Hilton is well positioned to benefit from inflation as its fee-based business model benefits from rising ADRs while its cost base is largely fixed.
The combined impact of Hilton’s net unit growth since the onset of the pandemic and the greater operational efficiencies has increased run-rate operating income to approximately 15% above 2019 operating income at similar levels of RevPAR. We expect Hilton to continue to deliver accelerated earnings growth for the foreseeable future, as industrywide occupancy continues to improve (still well below normal), ADR remains elevated, and Hilton laps over easy comparative historical periods.
Despite Hilton’s accelerated near-term growth prospects and attractive long-term earnings algorithm, the stock is attractively priced at a low-20s multiple of 2023 earnings. We find Hilton’s valuation to be compelling given its industry leading competitive position, superb management team, attractive long-term net unit growth algorithm, pricing power, and best-in-class capital return policy.
Lowe’s (LOW)
Lowe’s is a high-quality business with significant long-term earnings growth potential underpinned by a superb management team that is successfully executing a multi-faceted business transformation.
COVID-19 was a transformational event for the US housing market, causing homeowners to invest significantly in their homes as they shifted nearly all their daily activities to the home environment, including work, school, and leisure. The increased use of the home during COVID, in turn, increased the need for repair, maintenance and remodel activity, which significantly benefited Lowe’s same-store sales.
As consumers return to spending more time and money on out-of-the home activities the near-term demand for certain Do-It-Yourself (“DIY”) categories has decreased. Moderation in DIY demand combined with increased mortgage rates and decreased housing affordability has caused many market participants to become concerned that the home improvement industry may give up a significant part of their COVID pandemic sales gains.
While we expect that there will be some near-term volatility and continued moderation of DIY demand, growth remains strong for projects requiring professional installation (the “Pro” business) due to a substantial backlog of projects undertaken during COVID, which should support industry growth in the near-term. In addition, we believe the medium-term growth outlook for the home improvement industry remains strong as demand is likely to normalize at a materially higher level as compared to the pre-COVID era.
For the decade prior to COVID, home improvement industry sales were notably depressed relative to their long-term averages as a percentage of overall consumer spend and GDP and have only now returned to their longer-term historical levels.
Moreover, we believe COVID has permanently renewed consumers’ focus, appreciation, and utilization of their homes, which combined with higher home equity values, strong consumer balance sheets, low levels of home inventory for sale and an aging housing stock that requires an increasing level of maintenance, will likely result in a structurally higher level of ongoing home industry spending in the future. In the most recent quarter demand strengthened throughout the quarter as DIY consumers returned from summer vacations and focused on less seasonal home improvement projects.
While we believe the longer-term industry outlook remains strong, Lowe’s is likely to generate a strong level of earnings growth over a multi-year period even if the industry and macroeconomic environment is weaker due to management’s strong execution of the company’s ongoing business transformation.
A combination of market share gains (primarily from improving e-commerce execution and improving share of wallet amongst Pro customers) and a multitude of idiosyncratic self-help initiatives (primarily focused on improving in-store labor productivity and reconfiguring Lowe’s for a market based delivery model) are driving Lowe’s transformation.
Lowe’s operational transformation is further magnified by its aggressive share repurchase program, which is likely to see the company acquire a high-single-digit percentage of its market capitalization in this year alone. The materiality of Lowe’s Perpetual Productivity Initiative was on full display in their most recent quarter, whereby the company leveraged fixed expenses by 80 basis points, driving 10% earnings-per-share growth notwithstanding flat topline growth. The successful execution of Lowe’s continued business transformation should allow the company to generate accelerated earnings growth for the foreseeable future.
Notwithstanding our view on Lowe’s attractive long-term earnings outlook, Lowe’s currently trades at only 15 times forward earnings, a low valuation for a business of this quality, and a substantial discount to its direct competitor. We believe the current valuation reflects investors negative sentiment regarding the US housing market and incorporates the possibility of a greater than expected revenue decline. We believe the current valuation is highly attractive and anticipate Lowe’s will generate high rates of returns from current levels if as we expect it continues to successfully execute the company’s transformation.
Canadian Pacific Railway (CP)
CP is a high-quality, inflation-protected business led by a best-in-class management team that operates in an oligopolistic industry with significant barriers to entry. With an improving volume and pricing outlook combined with the upcoming transformational acquisition of Kansas City Southern (“KCS”), we believe that CP’s prospects are bright.
CP reported revenue growth of 7% in the second quarter as pricing and mix, fuel surcharge pass-throughs and foreign exchange more than offset a small decline in volumes. CP is leveraging the strong pricing environment to renew contracts at an average price increase of over 6%. Pricing directly benefits earnings as rails pass on increases in fuel and other expenses to customers through contractual fuel surcharges and CPI escalators. In addition to earnings growth, high inflation should help rail transportation take share from trucking and lead to incremental volume growth over time.
Customers are choosing cheaper transportation solutions as prices rise, and CP’s mission-critical rail service is often the cheapest or only viable method for transporting heavy freight over long distances. High fuel prices and wage gains also disproportionally increase the cost of trucking, which is up to three times less fuel efficient and much more labor intensive than rail transportation.
The demand outlook for CP continues to improve, especially given the current geopolitical environment. Russia’s invasion of Ukraine and the resulting supply disruptions have boosted demand for Canadian exports such as grain and potash. Deglobalization has also increased the likelihood of major North American onshoring and energy production, which will accelerate CP’s volume growth in the future.
Total volumes declined by 2% in the second quarter due to the smaller than average Canadian grain harvest, while volumes excluding grain increased by 5%. The grain headwind will flip to a tailwind in the fall as CP anticipates a normal grain crop, which supports management’s double-digit volume and revenue growth outlook for the second half of 2022.
CP’s pending acquisition of KCS remains on track as the Surface Transportation Board’s likely approval approaches. Based on the Board’s updated procedural schedule, if all goes as expected, CP will gain operational control of KCS by the first quarter of 2023 at the latest. In the meantime, CP and KCS are preparing for synergies by holding productive discussions with potential customers, running proof of concept trains, and making capacity investments.
By creating the only direct route from Canada to Mexico, the procompetitive merger offers shippers the unrivaled speed and service that is sorely needed to help ease supply chain congestion. We are confident in management’s ability to achieve its revenue and cost synergy targets and create value for all stakeholders.
While CP’s year-to-date results reflect its strong business performance and favorable outlook, we believe CP’s current valuation represents a meaningful discount to intrinsic value in light of the company’s high-quality business model and long-term growth potential.
The Howard Hughes Corporation (HHC)
HHC’s portfolio of well-located residential land and income-producing commercial assets continues to demonstrate resilient performance despite recent macro concerns of a slowdown in the housing market. The company’s advantaged business model of owning master planned communities (“MPCs”) provides HHC substantial control over the planning and release of land for sale and development, enabling it to take a long-term approach to maximizing the value of its portfolio.
As a result of its outright ownership of thousands of acres of conservatively financed land and a management team that combines superb capital allocation and development skills, the company is much less exposed to the cyclicality of standalone, smaller-scale real estate development companies.
HHC’s MPCs are attractively located in low cost-of-living, low-tax states like Texas and Nevada that are benefiting from significant in-migration. As mortgage rates have increased, the relative affordability and higher quality of life found in Summerlin (Las Vegas, Nevada) and Bridgeland (Houston, Texas), the company’s two MPCs with the substantial majority of remaining land sales, is highly appealing to prospective homebuyers. Although the pace of home sales has moderated from the post-pandemic surge experienced in 2021, housing inventory in HHC’s MPCs has been depleted and is near historical lows.
Homebuilder demand for lots remains strong and the company is experiencing significant growth in pricing due to the supply-demand imbalance, as evidenced by the 25% year-over-year increase in the average price per acre sold this quarter. Likewise, the company is experiencing robust performance across the rest of its portfolio. In its income-producing operating assets, this quarter NOI increased 15% year-over-year driven by the lease-up of new developments and significant increases in rental rates. The pace of condo sales in Ward Village has remained consistently strong due to the unique appeal of the development’s location in Hawaii.
HHC’s balance sheet is well insulated from the impact of rising interest rates. Approximately 83% of the company’s debt is either fixed or swapped to a fixed rate, and the company has limited near-term debt maturities with a substantial portion of its debt maturing in 2026 or later. Unlike traditional developers and homebuilders, the company is not dependent on external capital to fund development. Substantial cash generated from its operating assets, MPC land sales, and condo sales is more than sufficient to self-fund future development opportunities.
While the company has made significant progress in simplifying its business and has a substantial runway for long-term value creation, we continue to believe its current share price is at a deep discount to its intrinsic value. The company has been able to capitalize on this discounted valuation by aggressively repurchasing its shares. Year to date, HHC has repurchased approximately 8% of its outstanding share count, funded by cash flow from operations and non-core asset sales.
We believe HHC is extremely well positioned for the current inflationary environment due to its combination of high-quality real estate assets and a largely fixed-rate liability structure. We expect the company to benefit from substantial land price appreciation and rental income growth in the coming years.
Fannie Mae (“FNMA” or “Fannie”) and Freddie Mac (“FMCC or “Freddie”) (together “the GSEs”)
There have been no material updates for Fannie Mae and Freddie Mac in 2022. Both entities continue to build capital through retained earnings and now hold combined capital of $91 billion, up from nearly zero. As we have stated previously, as principally common shareholders (we own a small amount of preferred stock), we own valuable perpetual options on both entities that over the long term we believe will be worth many multiples of today’s prices once re-privatization occurs.
Exited Positions
Domino’s Pizza (DPZ)
Since our last update, Domino’s near-term business performance has shown meaningful improvement, including three-year stacked growth for the second quarter of 17% in the U.S., up 560 basis points sequentially. This improvement was driven by the full impact of its recent pricing actions, operational changes leading to improved staffing and labor utilization, and the return of its signature Boost Week promotion. These positive developments caused a significant recovery in Domino’s share price and its valuation increased to more than 28 times our estimate of next twelve months’ earnings.
In light of the company’s relatively high valuation in the context of a volatile market environment, we decided to exit our investment to raise cash for alternative investment opportunities.
We have enormous respect for Domino’s and its management team led by Russell Weiner, and we expect the company to continue its long track record of success.
Netflix (NFLX)
In April, we announced that we exited our position in Netflix following the company’s first quarter results as management commentary and a required shift in the company’s business model toward ad-supported streaming caused us to lose confidence in our ability to predict the company’s future prospects with a sufficient degree of certainty. While we have confidence in Netflix’s superb management team and their long-term record, we believed the dispersion of outcomes had widened such that it no longer met our requirements for a core holding. We discussed our decision to sell Netflix in detail in our April 20th letter to investors which you can read here.
Pershing Square Tontine Holdings Ltd (“PSTH”)
On July 11th, PSTH announced that it would redeem its outstanding shares and liquidate as PSTH was unable to consummate a transaction that both met its investment criteria and was executable. PSTH returned its $4 billion of capital in trust to shareholders on July 26th. The PSTH liquidation is discussed in greater detail in the PSTH Liquidation section on page 42 of this report.
Appendix B: Endnotes and Disclaimers – ENDNOTES TO COMPANY PERFORMANCE AND INVESTMENT MANAGER’S REPORT
|
Editor’s Note: The summary bullets for this article were chosen by Seeking Alpha editors.
Be the first to comment