

akinbostanci/E+ via Getty Images
Thesis
The Invesco CEF Income Composite ETF (NYSEARCA:PCEF) is a fund-of-funds that was structured as an exchange traded fund. We have already looked at two names from the CEF space which fall in the same category, namely the Special Opportunities Fund (SPE) and the High Income Securities Fund (PCF) which we reviewed here and here. As per its literature, PCEF:
[…] is based on the S-Network Composite Closed-End Fund Index-SM. The Fund will normally invest at least 90% of its total assets in securities of funds included in the Index. The Fund is a “fund-of-funds,” as it invests its assets in the common shares of funds included in the Index rather than in individual securities. The Index currently includes closed-end funds that invest in taxable investment grade fixed-income securities, taxable high yield fixed-income securities and others that utilize an equity option writing (selling) strategy. The Fund and the Index are rebalanced and reconstituted quarterly.
PCEF has a long term annualized performance that disappoints: on 5- and 10-year lookback periods the fund posted annualized total returns of 4.13% and 5.42% respectively. When an investor looks at a CEF they usually see a high yield figure that attracts them. That is the whole selling point around CEFs – the structure gives the fund manager the ability to utilize a variety of tools to either cover shortfalls during bad periods or increase the dividend yield. Ultimately that is what attracts a retail investor. Yet when you take a portfolio of CEFs like PCEF, instead of getting those 7% to 9% yields you are only getting 4.13% and 5.42% respectively. The fund does not do a good job of trading its portfolio or managing the macroeconomic cycles as well as it could. For example during 2022 when interest rates were forecasted to rise a savvy portfolio manager should have cut exposure to high yield vehicles and increased the cash allocation. PCEF did not, and it is down more than -13% year to date.
PCEF contains over 150 individual CEF names and is geared towards the fixed income space with over 59% of the portfolio catered to fixed income CEFs. PCEF lags its CEF competitors and has the worst analytics from the cohort:
Fund-of-funds Comparison (Author)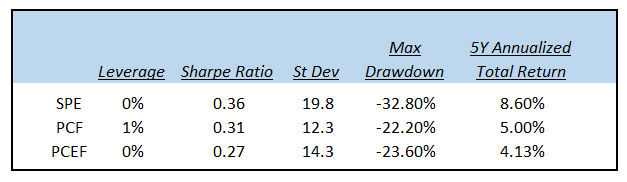
We can see from the above table that PCEF has the lowest Sharpe ratio from the cohort but not the lowest standard deviation. Its maximum drawdown is lower than the Special Opportunities Fund one but very close to the High Income Securities Fund drawdown, fund which has a better annualized total return.
When pre-packaging CEFs into a vehicle a retail investor should expect outperformance and a high yield. You are getting neither with PCEF. A very simple structure with 4 to 5 CEFs (picking mint, robust names in each category) would do much better performance wise than PCEF. It seems that PCEF just aggregates everything under the sun from the CEF space and does very little in generating alpha on its own or versus its peers. We are not big fans of PCEF, and feel so far that from the cohort, SPE (which we analyzed here) looks best. If you already hold PCEF then wait for the rally next year to get back some of the 2022 drawdown. New money should steer away from this ETF.
CEF vs ETF – what is the difference?
ETF stands for “Exchange Traded Fund”, whereas CEF stands for “Closed End Fund”. They both pool together portfolio of assets but are structured quite differently. Their main characteristics are:
ETFs:
- ETFs can create or redeem shares continuously so shares usually trade close to the NAV
- ETFs redeem / create units through the day and at the same time they trade the underlying collateral to adjust
- ETFs are precluded from issuing debt or preferred shares
- Usually ETFs are passively managed
- Usually they have low fees
CEFs:
- CEFs do not issue or redeem shares daily
- CEFs issue a fixed number of shares through an initial public offering. Thereafter they can trade at a price different than their NAV, depending on the secondary market demand.
- The share price for a CEF is set by the market
- CEFs can take on significant leverage
- The vehicles can distribute higher yields via ROC distributions
- Active management
- Fees are on the higher side
The CEF structure gives a manager more flexibility in terms of the types of trades it can undertake and a smoothing out of the return profile via ROC distributions. Active management and a wider mandate are also cornerstones of the CEF structure.
Performance
The fund is down more than -13% year to date on a total return basis (i.e. dividends are factored in):
YTD TR (Seeking Alpha)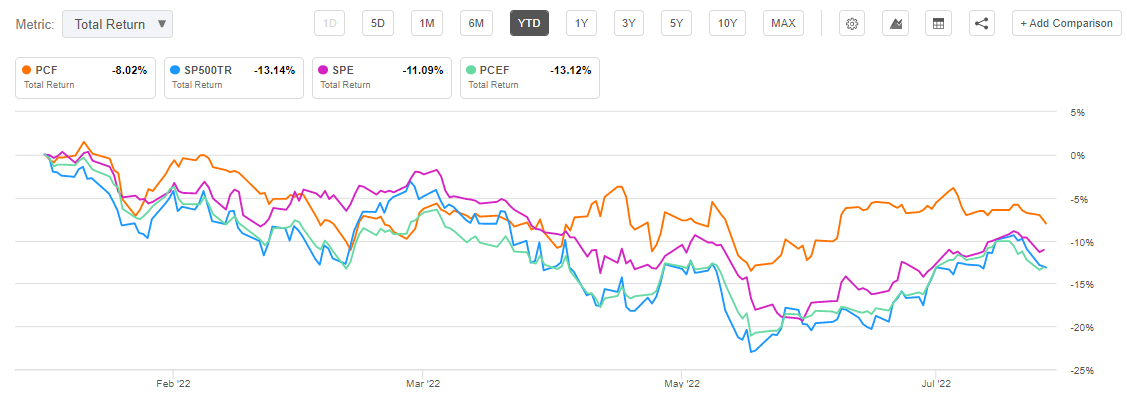
On a 3-year basis PCEF lags significantly from a performance standpoint:
3Y TR (Seeking Alpha)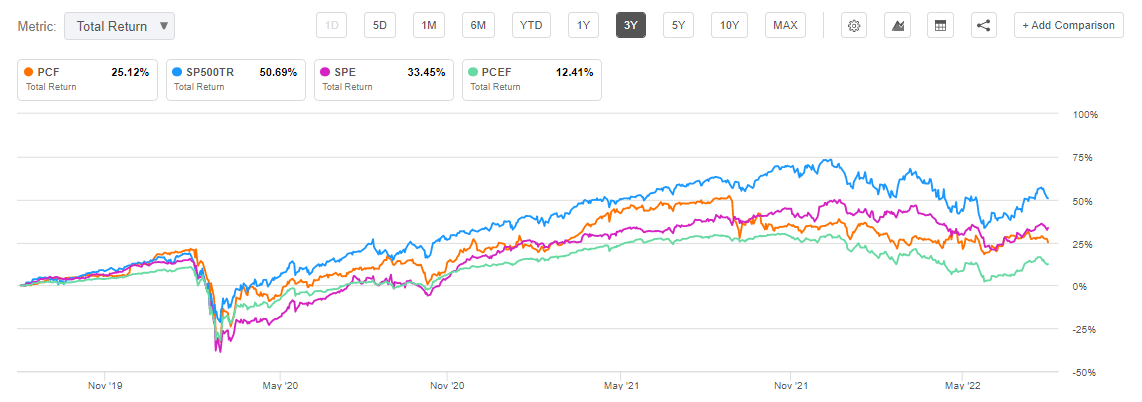
We can see that PCEF has the lowest return from the cohort, with the SPE fund exposing almost triple the total returns for the respective period. The story reads the same for a 5-year time-series:
5Y TR (seeking alpha)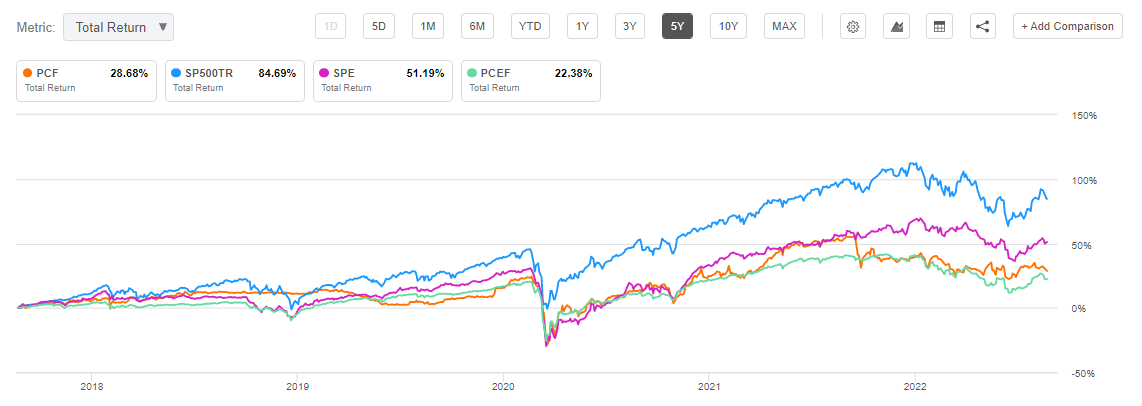
Long term look for 5% annualized total returns for PCEF:
Total Returns (Morningstar)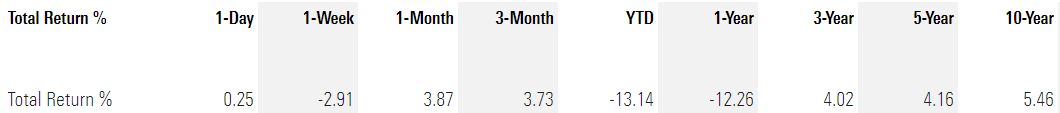
We can see that long term PCEF is unable to muster alpha and has quite mediocre total returns when compared to what the CEF asset class evokes.
Holdings
The ETF contains a high amount of CEFs (over 150 names) that are sliced in the Semi-Annual Report as follows:
Portfolio Slicing (Semi-Annual Report)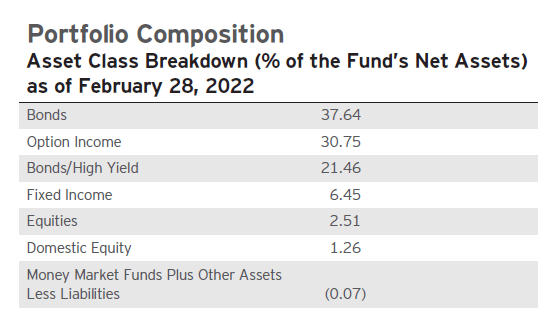
The bucket called “Bonds” actually contains multi-asset Fixed Income CEFs and preferred securities CEFs:
Holdings (Semi-Annual Report)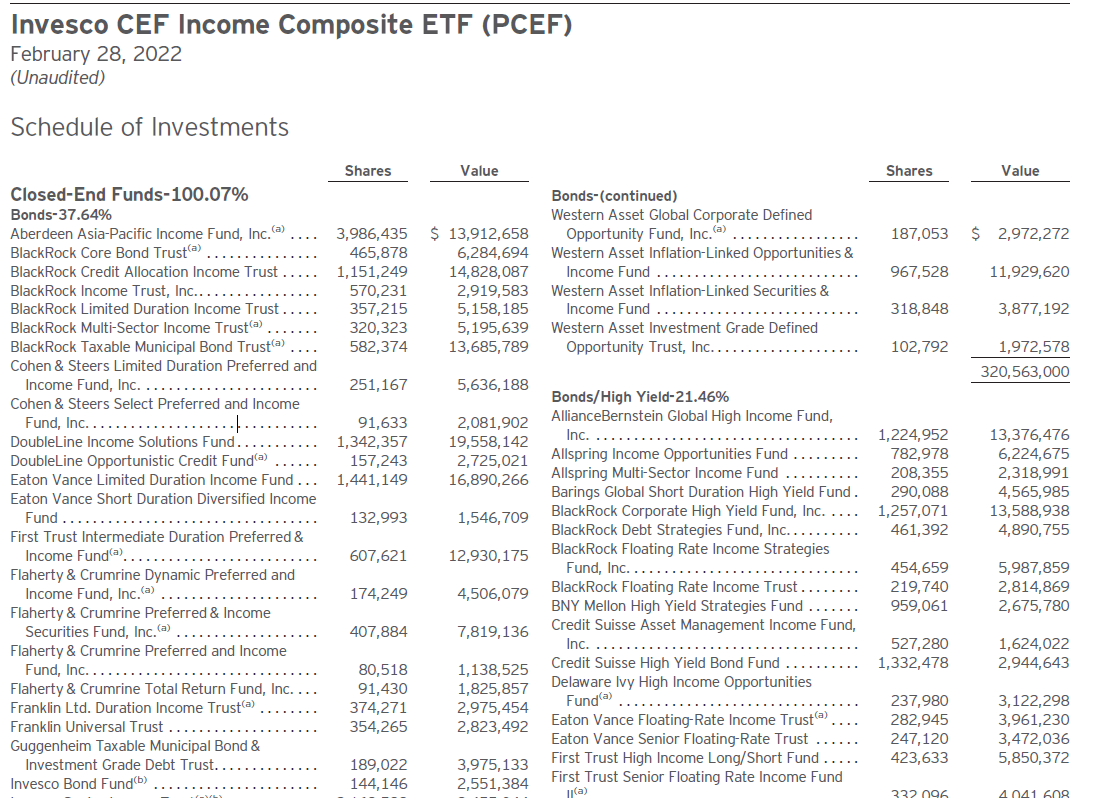
We can see how (DSL) which we reviewed here, is packed into the “Bonds” bucket. The “Bonds/High Yield” bucket contains the traditional HY CEFs from the space, while “Option Income” bucket is composed of Equity Buy-Write funds:
Holdings (Semi-Annual Report)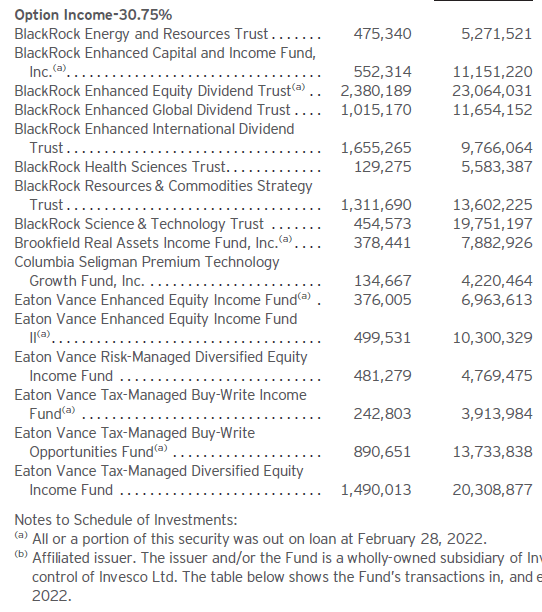
Conclusion
PCEF is a fund-of-funds that aggregates over 150 CEFs in its portfolio. The vehicle is structured as an exchange traded fund and thus exposes no premium/discount to NAV. PCEF has failed to generate alpha long term and has annualized long term returns close to 4%. From the fund-of-funds cohort PCEF is the worst performer from both a total return and analytics standpoint. We are not big fans of PCEF and feel so far from the cohort SPE (which we analyzed here) looks best. If you already hold PCEF then wait for the rally next year to get back some of the 2022 drawdown. New money should steer away.
Be the first to comment