

Justin Sullivan/Getty Images News
Since our previous analysis, PayPal’s (NASDAQ:PYPL) stock has declined by around 67% in the past 1 year despite surpassing our 2021 revenue growth projection of 20.1%, at 25.3%. However, its payment acceptance growth had normalized since Q1 2021 and its revenues are guided by management to grow by 11% to 13% in 2022 based on its latest earnings briefing. In this analysis, we examine the drivers of its TPV growth in terms of P2P transaction volumes and payment acceptance volumes. We further examine its growth driven by the P2P volumes and we analyzed its P2P offerings with competitors. Lastly, we looked into the company’s take rate and compared its Venmo take rate with the company’s total take rate.
Normalizing Payment Acceptance TPV Growth
PayPal’s TPV consists of P2P transaction volumes which include PayPal, Venmo and Xoom digital wallets as well as payment acceptance at the point of sale. According to PayPal, around 28% of its TPV consists of P2P transactions in Q1 2022. We compiled the company’s P2P and payment acceptance TPV in the table below which shows the surge of its payment acceptance payment volume in 2020 and 2021.
|
PayPal TPV ($ bln) |
2018 |
2019 |
2020 |
2021 |
|
P2P TPV |
138.92 |
192.39 |
271.23 |
357.64 |
|
Growth % |
38.5% |
41.0% |
31.9% |
|
|
Payments TPV |
439.49 |
519.53 |
665.07 |
888.36 |
|
Growth % |
18.2% |
28.0% |
33.6% |
|
|
Total Payment Volume |
578.41 |
711.92 |
936.30 |
1,246 |
|
Growth % |
23.1% |
31.5% |
33.1% |
Source: PayPal, Khaveen Investments
PayPal, Khaveen Investments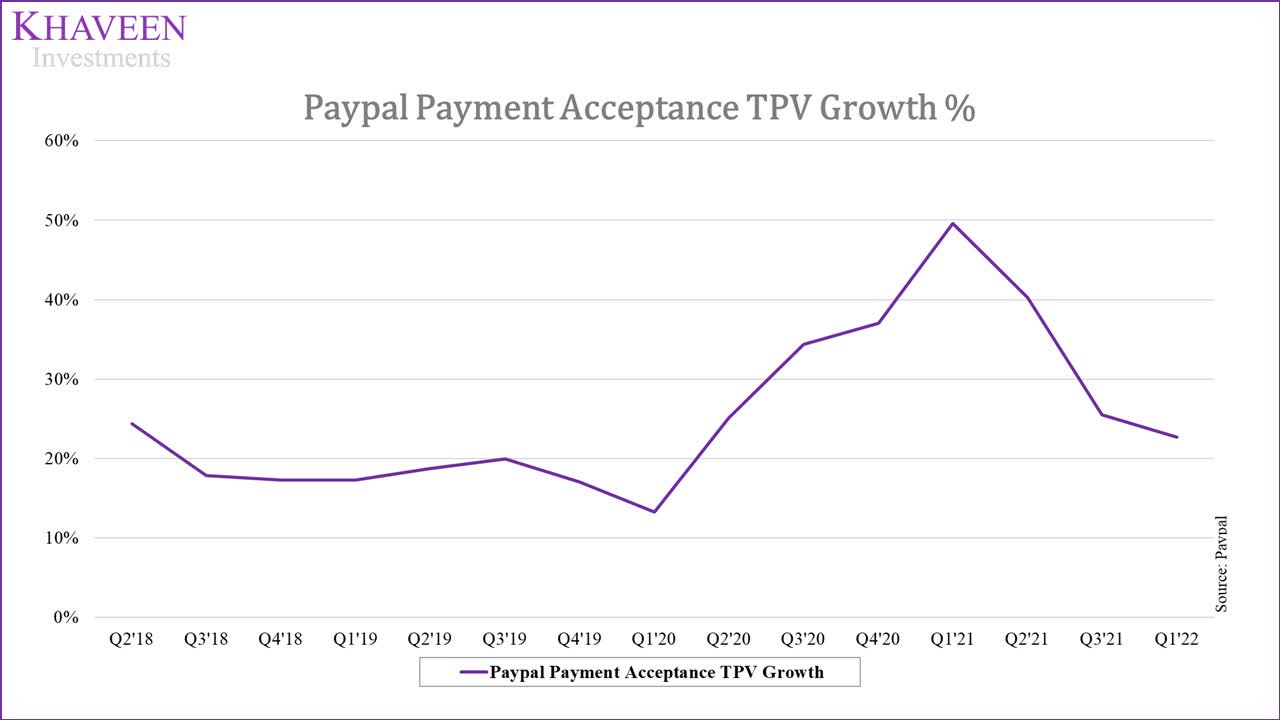
Notwithstanding, as seen in the chart above, PayPal’s quarterly payment acceptance payment volume growth has decelerated since Q1 2021 following the robust growth acceleration in 2020.
Based on its latest earnings briefing in Q1 2022, the company highlighted that it is forecasting normalizing consumer e-commerce spending and has lowered its guidance for the year as explained in the following quote below.
For the year, we now expect 11% to 13% revenue growth and non-GAAP EPS to be in the range of $3.81 to $3.93. Ex eBay, this represents revenue growth of approximately 15% to 17%. – Daniel Schulman, President, CEO & Director
Based on data from Digital Commerce 360, the company previously highlighted that PayPal Checkout was available across three quarters of the top 1,000 retailers across North America and Europe which we believe highlights its wide presence. We projected the company’s payments acceptance payment volume growth based on our forecast total global digital payment processing transaction volume growth from our previous analysis of 10.5% in 2022 and 10.62% in 2023 but tapering down by 1% per year as a conservative estimate from 2024.
|
PayPal TPV Forecast |
2018 |
2019 |
2020 |
2021 |
2022F |
2023F |
2024F |
2025F |
|
Payment Acceptance TPV |
439.49 |
519.53 |
665.07 |
843.42 |
982 |
1,086 |
1,190 |
1,293 |
|
Growth % |
18.2% |
28.0% |
26.8% |
10.51% |
10.62% |
9.62% |
8.62% |
Source: PayPal, Khaveen Investments
Overall, the company’s TPV growth has decelerated in 2021 following the surge in growth experienced in 2020. We expect the company’s growth rate to continue normalizing based on our forecast of the total global digital payment processing transaction growth of 10.5% in 2022 as we believe the company’s broad and established presence as a top payment checkout option used by top retailers globally is its key advantage to capitalize on the growth of digital payments.
PayPal TPV Growth Buoyed by P2P Payments
Besides payment checkout, PayPal’s TPV consists of P2P transactions from PayPal, Venmo and Xoom which account for around 28% of its total payment volumes. Allied Market Research forecasted the P2P payment market transaction volumes to grow at a CAGR of 17.3%. To determine whether PayPal has a competitive advantage, we compared it against other digital wallets in terms of their fees, features and functionalities.
|
Category |
Venmo (PayPal) |
Cash App (Square) |
Zelle |
PayPal |
Apple Pay |
Google Pay |
|
Fees (Instant Transfer) |
1.75% fee (minimum fee of $0.25 and a maximum fee of $25) |
0.5% to 1.75% (minimum fee of $0.25) |
N/A |
1.75% (minimum fee of $0.25 and a maximum fee of $25) |
1.5% (minimum fee of $0.25 and a maximum fee of $15) |
1.5% or $0.31 (whichever is higher) |
|
Limits |
$1,500 per week |
$1,000 within any 30-day period |
Depends on Bank |
No limit but limited to $10,000 per single transaction |
$20,000 per week |
$$2,500 per day |
|
Crypto Trading |
Bitcoin, Litecoin, Ethereum, Bitcoin Cash |
Bitcoin |
N/A |
Bitcoin, Litecoin, Ethereum, Bitcoin Cash |
N/A |
N/A |
|
Equity Trading |
N/A |
Yes |
N/A |
N/A |
N/A |
N/A |
|
Debit Card |
Yes |
Yes |
N/A |
Yes |
N/A |
N/A |
|
Credit Card Issuance |
Yes |
N/A |
N/A |
N/A |
N/A |
N/A |
|
BNPL Functionality |
N/A |
N/A |
N/A |
Yes |
Partnership with Goldman Sachs |
Partnership with Afterpay |
Source: Venmo, PayPal, Cash App, Zelle, Apple, Google, TechCrunch, CNBC, Khaveen Investments
In terms of fees, Zelle is the most attractive as it does not charge any fee for transferring money as it is embedded in banking apps. On the other hand, PayPal and Venmo have variable instant transfer fees of 1.75% which is the highest along with Cash App which ranges between 0.5% to 1.75%. For transfer limits, PayPal does not have a weekly or monthly transaction limit but every transaction is only limited to $10,000. Whereas Apple Pay has a high limit of $20,000 per week.
In terms of features, PayPal, Venmo and Cash App offer cryptocurrency trading but PayPal and Venmo allow users to trade 4 types of cryptocurrencies while Cash App only offers Bitcoin trading.
In addition, only Cash App provides commission-free equity investing services but PayPal was reported by CNBC to be introducing the feature in the future. Only Venmo, Cash App and PayPal offer debit cards linked to accounts with no fees for using their debit cards to make purchases. Besides that, only Venmo allows users to apply for its credit card linked to their Venmo accounts.
Also, PayPal is the only platform that provides its own BNPL services while Google Pay integrates Afterpay’s BNPL into its platform. Meanwhile, Apple Pay was reported by Bloomberg to launch its BNPL service in partnership with Goldman Sachs.
We forecasted the company’s P2P volume growth based on its active user base and P2P transaction volume per user. For the active users, we used its 5-year average of 14.3% but tapering down by 1% per year as a conservative estimate. In addition, we based the P2P volume per user growth on the market forecast of 17.3% by Allied Market Research.
|
PayPal P2P TPV Forecasts |
2018 |
2019 |
2020 |
2021 |
2022F |
2023F |
2024F |
2025F |
|
PayPal Active Users (‘mln’) (‘a’) |
267 |
305 |
377 |
426.0 |
486.8 |
551.3 |
618.9 |
688.6 |
|
Growth % |
14.2% |
23.6% |
13.0% |
14.3% |
13.3% |
12.3% |
11.3% |
|
|
PayPal P2P Volume Per User (‘b’) |
520.32 |
630.79 |
719.44 |
839.53 |
984.77 |
1155.13 |
1354.97 |
1589.38 |
|
Growth % |
21.2% |
14.1% |
16.7% |
17.3% |
17.3% |
17.3% |
17.3% |
|
|
PayPal P2P Volume ($ bln) (‘c’) |
138.92 |
192.39 |
271.23 |
357.64 |
479.34 |
636.83 |
838.60 |
1094.45 |
|
Growth % |
38.5% |
41.0% |
31.9% |
34.0% |
32.9% |
31.7% |
30.5% |
*c = a x b
Source: PayPal, Allied Market Research, Khaveen Investments
All in all, compared to its competitors, we analyzed PayPal’s P2P features and functionalities where it has strengthened its game with the launch of crypto trading, BNPL, credit card linked accounts and more to create a more robust P2P ecosystem. We see the company’s P2P as a key area of growth as it accounts for over a quarter of its TPV and we projected it to grow by over 32.3% on average through 2025 driven by the growth in active users and volume as we expect it to continue attracting users with a robust P2P platform with various functionalities with the continuous improvements and new functionalities added such as stock and crypto trading and credit cards linked to its accounts offering consumers greater tools to manage their finances.
Impact of P2P Transactions on Profitability
While PayPal’s P2P transaction volumes enjoyed relatively superior growth than its payment acceptance business (except in 2021), the company’s take rate had declined as a result of its lower P2P take rate. The challenge the company faces with its growing P2P volume is to monetize it. Based on our calculations of its take rate from Venmo’s revenues and transaction volumes, Venmo only has a take rate of around 0.37% compared to the transactional take rate of PayPal at 2.2% in 2021 which highlights the under monetization of its P2P volumes. To compare the companies, we derived the average revenue per user for Venmo and Cash App. For Cash App, we based it on its gross profit as its revenue includes its transaction volumes for bitcoin trading.
|
Company |
Take Rate |
Average Revenue Per User |
|
Venmo |
0.37% |
$ 12.14 |
|
Cash App |
2.19% |
$ 47.05 |
Source: Business of Apps, Company Data, Khaveen Investments
The table shows that Venmo has a lower ARPU than Cash App by 74%. Its P2P platform derives revenues from fees related to the transfer of funds between customers’ Venmo accounts and bank accounts or debit cards. Its instant transfer fees are around 1.5% and this is similar to Cash App as mentioned in the previous point. However, the Cash App has distinctly monetized its user base better than PayPal. This is because Cash App also charges merchants who accept Cash App as a payment method a 2.75% transaction fee for customers to either pay with their P2P app or via its issued prepaid debit card that is linked to their accounts. In the chart below, its total take rate has declined steadily from above 3.35% in 2012 to 1.88% in 2021.
PayPal, Khaveen Investments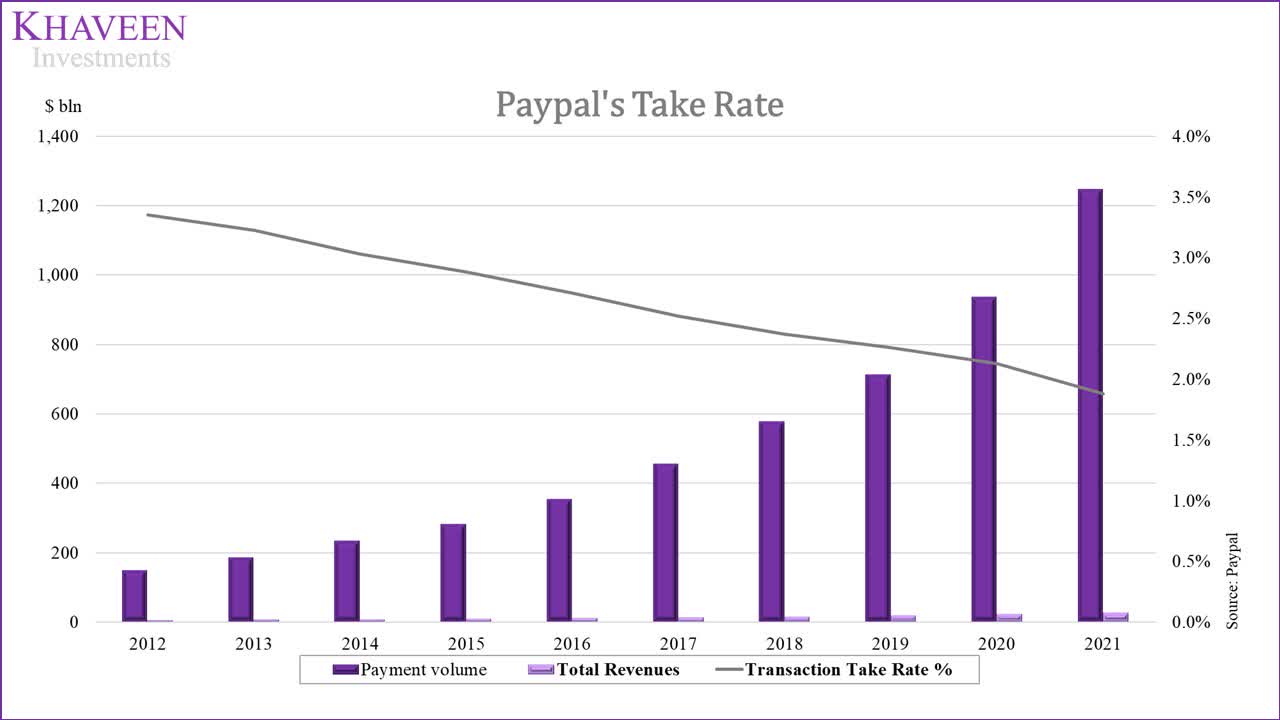
We expect PayPal’s take rate to continue to decline as its P2P volumes with a lower take rate continue to outgrow its payment acceptance volumes. We forecasted its take rate to decline by 5.5% based on its 9-year average to a take rate of around 1.61% by 2025.
|
PayPal Transaction Revenue Forecast ($ bln) |
2019 |
2020 |
2021 |
2022F |
2023F |
2024F |
2025F |
|
PayPal P2P Volume |
192.39 |
271.23 |
357.64 |
479.3 |
636.8 |
838.6 |
1094.4 |
|
Growth % |
38.5% |
41.0% |
31.9% |
34.0% |
32.9% |
31.7% |
30.5% |
|
Payments Volume |
519.53 |
665.07 |
888.36 |
982 |
1,086 |
1,190 |
1,293 |
|
Growth % |
18.2% |
28.0% |
33.6% |
10.51% |
10.62% |
9.62% |
8.62% |
|
Total Payment Volume |
711.92 |
936.30 |
1,246 |
1,461 |
1,723 |
2,029 |
2,388 |
|
Growth % |
23.1% |
31.5% |
33.1% |
17.3% |
17.9% |
17.8% |
17.7% |
|
Transaction Take Rate % |
2.26% |
2.13% |
2.02% |
1.91% |
1.80% |
1.71% |
1.61% |
|
Transaction Revenue |
16.10 |
19.92 |
25.16 |
27.88 |
31.08 |
34.61 |
38.49 |
|
Growth % |
17.43% |
23.72% |
26.30% |
10.85% |
11.47% |
11.34% |
11.23% |
Source: PayPal, Khaveen Investments
Despite the high growth of its P2P volumes, the disadvantage of it is its take rate which has decreased as its P2P volumes have a lower take rate than its payment acceptance business. Thus, we continue to expect the growth of its P2P volumes to weigh on its take rate and account for it in our revenue projections through 2025 to derive our total revenue growth rate at around an 11.6% average rate. However, we believe that the greater ability of Square in monetizing its app with its greater take rate indicates the potential for PayPal to also monetize its platform and with the introduction of new features in its ecosystem.
Risk: Rising Competition
As PayPal’s take rate declines as its P2P transaction volume growth outpaces its payment processing business, we also highlight the risk of a squeeze on the payment processing fees. Compared to other leading payment processors such as Square and Adyen, PayPal’s fees are significantly more expensive and drive potential merchants to use its competitor platforms instead. Additionally, the company also faces increasing competition from BNPL providers as they expand aggressively. For example, Affirm had partnered with Amazon to offer BNPL payments to customers. Whereas Afterpay launched a BNPL subscription service to allow users to pay for subscription payments in installments. We believe this may affect PayPal’s revenue growth amid the rising competitive environment with low barriers to entry.
|
Companies |
Payment Processing Fees |
|
PayPal |
US: 3.49% + $0.49 |
|
Square |
2.6% + $0.10 |
|
Adyen |
US: 2% Europe:0.3%-0.4% |
|
Affirm |
5.99% + $0.30 |
|
Afterpay |
4% – 6% + $0.30 |
Source: PayPal, Square, Adyen, MerchantMaverick, JimmyWeb
Valuation
PayPal’s revenue has been growing steadily over the past 5 years with an average rate of 18.55%. Also, it has a 5-year average gross and net margin of 46.8% and 15.4% respectively.
PayPal, Khaveen Investments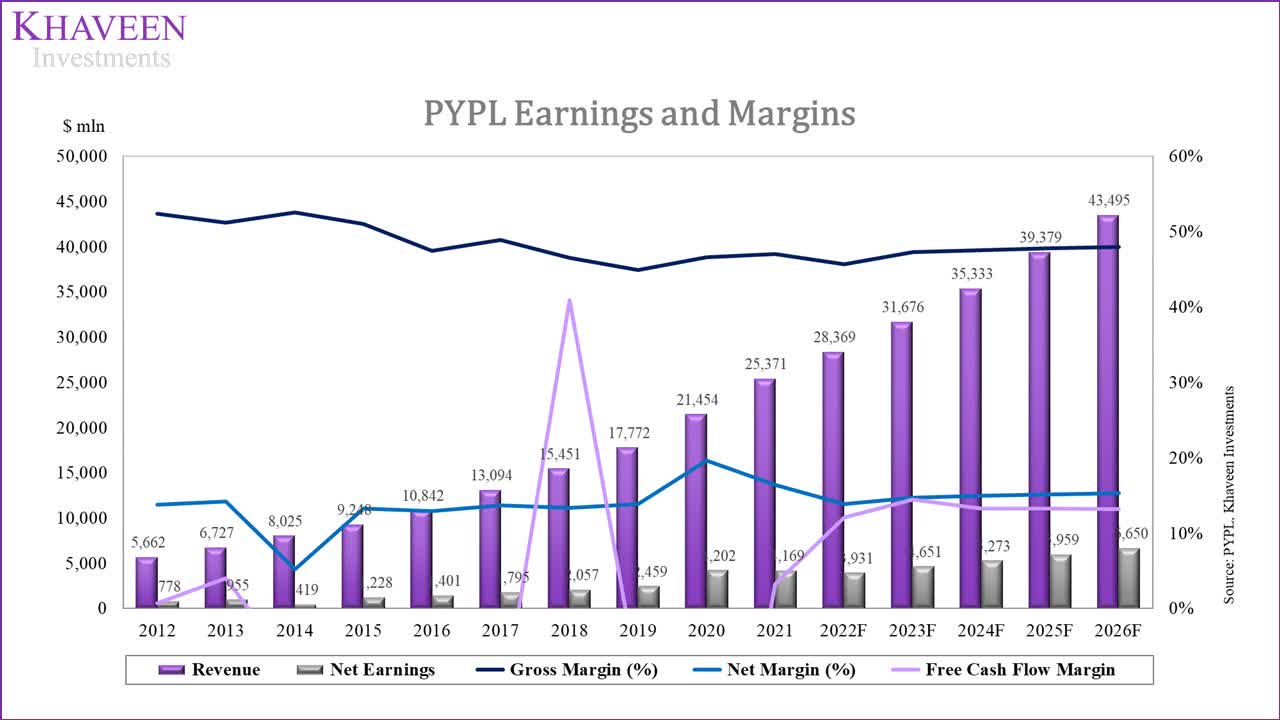
The company has a negative 5-year average free cash flow margin of -5.7% with an average capex to revenue of 37% in the past 10 years. This is mainly due to losses in investment in marketable & equity securities and acquisitions. Excluding that, PayPal has a 10-year adjusted capex as a % of revenue of only 5.5%. In 2020, the company acquired Honey for $4 bln which weighed on margins.
PayPal, Khaveen Investments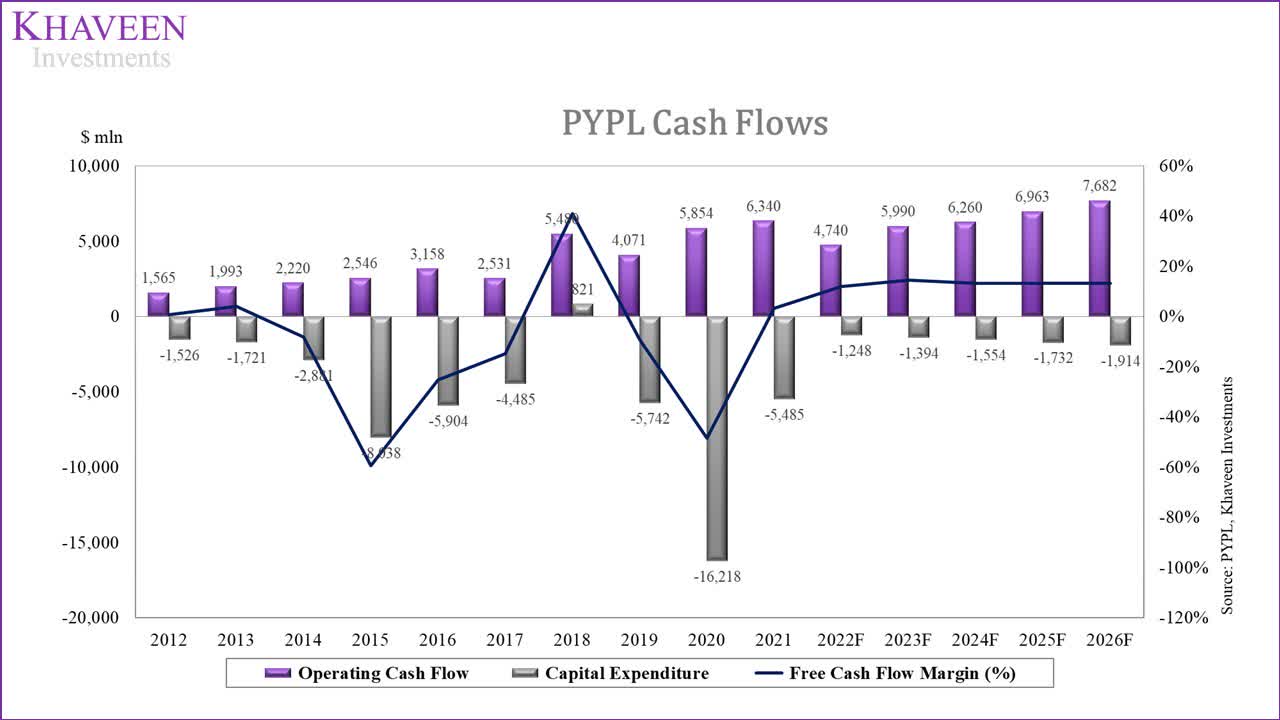
We used a DCF valuation to value the company as we expect it to have positive free cash flows and based our terminal value on the company’s 3-year average EV/EBITDA of 33.45x.
|
PayPal EV/EBITDA |
2017 |
2018 |
2019 |
2020 |
2021 |
Average |
|
EV/EBITDA |
27.77 |
28.37 |
30.09x |
41.82x |
39.2x |
33.45x |
Source: Gurufocus, Khaveen Investments
We projected its revenues for the transaction revenues as derived from our estimates above. For the Other Valued-Added Services segment, we projected it based on its 6-year segment revenue growth rate of 12.4% until 2025. In total, we revised our revenue projections to an average of 16% in the next 5 years.
|
PayPal TPV Forecast |
2019 |
2020 |
2021 |
2022F |
2023F |
2024F |
2025F |
|
Transaction Revenue |
16.10 |
19.92 |
25.16 |
27.88 |
31.08 |
34.61 |
38.49 |
|
Growth % |
17.43% |
23.72% |
26.30% |
10.85% |
11.47% |
11.34% |
11.23% |
|
Other value-added services ($ mln) |
1.67 |
1.54 |
1.73 |
2.17 |
2.48 |
2.83 |
3.23 |
|
Growth % |
-4.0% |
-8.2% |
12.4% |
12.4% |
14.1% |
14.1% |
14.1% |
|
Total revenue |
17.77 |
21.45 |
26.88 |
30.06 |
33.56 |
37.44 |
41.72 |
|
Growth % |
15.0% |
20.7% |
25.3% |
11.8% |
11.7% |
11.5% |
11.5% |
Source: PayPal, Khaveen Investments
Based on a discount rate of 8.1% (company’s WACC), we obtained an upside of 70.2%
Khaveen Investments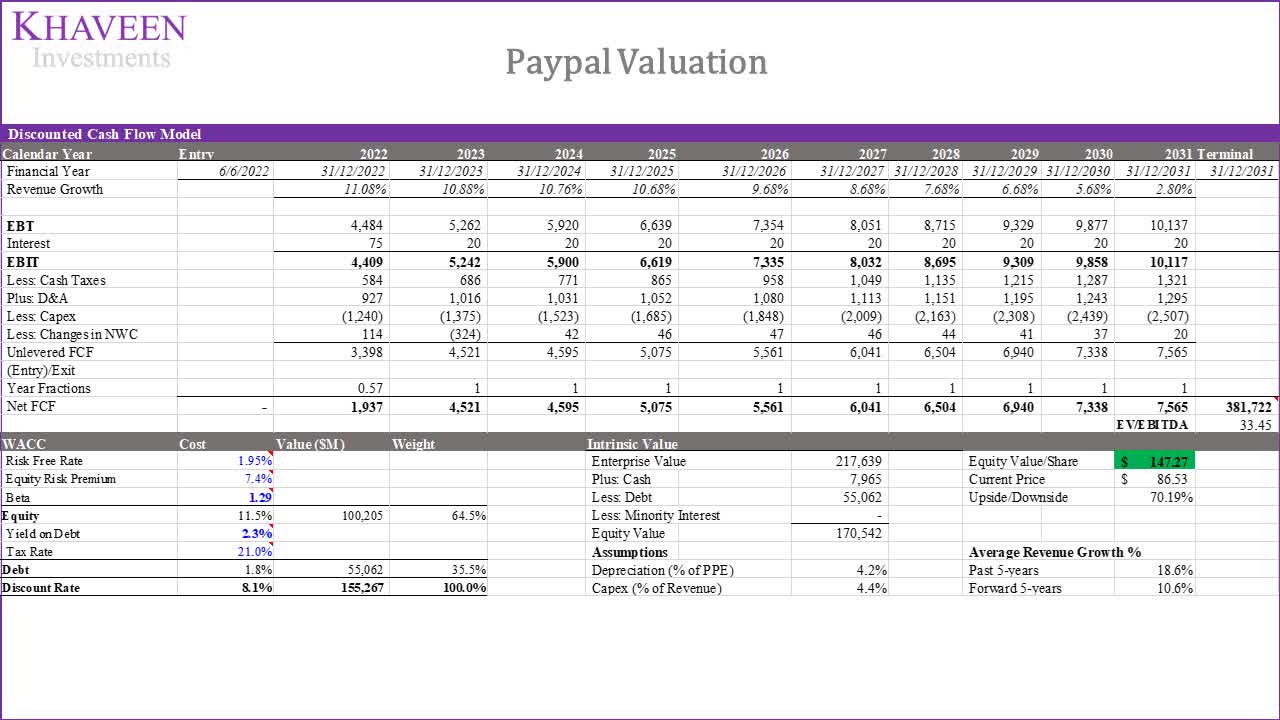
Verdict
We analyzed the company’s TPV growth driven by P2P transactions and payment acceptance. Its payment acceptance volume growth has decelerated following a surge in 2020 and 2021 and is expected to decline further as hinted by management’s guidance. However, its P2P transaction volume growth outlook remains robust, and we analyzed its P2P platform offerings where it has strengthened its features against Cash App. While its P2P transaction volume grew, its take rate has been weighed down by the lower take rate of its P2P platforms. Overall, we revised our revenue growth projections from 21.3% previously in 2022 to 11.8% and a 5-year average of 11.4% due to a lower growth forecast for its transaction revenue of 10.85% compared to 20.1% and a lower take rate assumption of 1.6% by 2025 compared to 1.97%. Also, we based its terminal value on a 3-year average EV/EBITDA of 37x. Overall, we rate the company as a Strong Buy with a target price of $147.27 as the company’s stock price had declined by 67% in the past 1 year.
Be the first to comment