

hapabapa/iStock Editorial via Getty Images
Introduction
In this article, I’m going to review my past coverage of Paychex (NASDAQ:PAYX) stock, then share my current valuation estimate for Paychex, and I’m also going to explain why Paychex’s current valuation is a classic example of what I call a “Sentiment Cycle.”
In June of 2019, in my article “Paychex: A 10-Year, Full-Cycle Analysis,” I warned investors about the stock’s high valuation and suggested they rotate into a more defensive position as a way to avoid a significant drawdown until Paychex traded at a better valuation at which point they could rotate back in. Here is what I had to say back then:
Based on this history, I think it’s fair to estimate that Paychex could fall between 45% and 55% during the next recession. If we apply that sort of decline to the optimistic price of $107.21 in two years, we get an expected recession price a few years from now of $48.24-58.97. That entire range is well below where the stock trades today, so I don’t see much risk in taking profits here if we have a recession within the next 2-3 years.
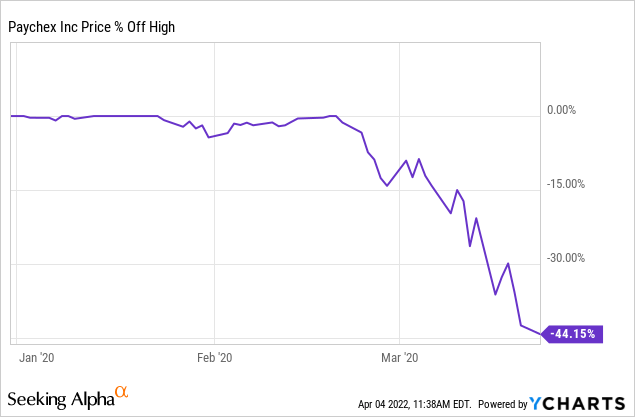
As it turned out, about 6-8 months later, Paychex fell as expected, bottoming at $47.87, and on March 23, 2020, I published an article where I noted that Paychex was then trading a little below fair value and if a person had rotated out after my first article, they could now rotate back in. (An investor who did so could have increased their Paychex position by about 54% without spending any additional money.)
I wouldn’t cover Paychex stock again until last December when I suggested Paychex was a ‘sell’ again in my article “Paychex Stock: It’s Time To Take Profits Again” because it had gotten overvalued. In between these articles, here is how Paychex stock performed:
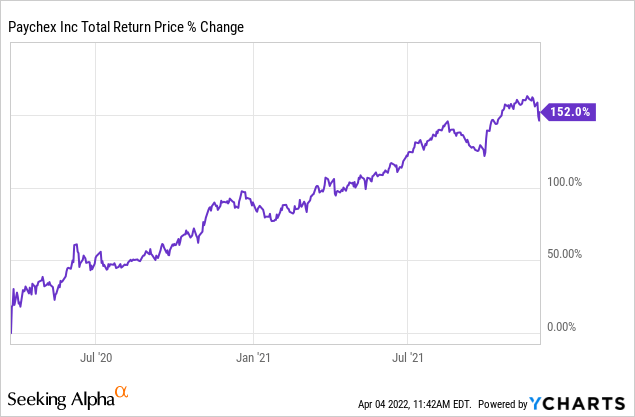
An investor who started with $10k in PAYX in June of 2019 and followed my strategy from 2019 until December of 2021 would have turned $10k into about $38k. However, since my last sell article in December, Paychex has gone on to make even higher highs and also outperformed the S&P 500, and investors who sold in December would have missed out on this upside.
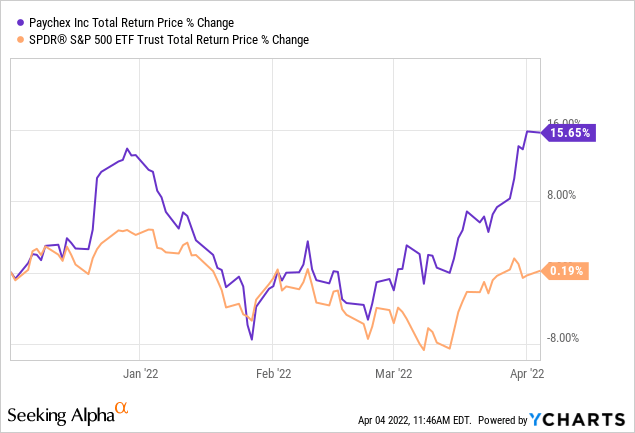
So, overall, I have a pretty good record valuing Paychex, but the stock has been very resilient lately, especially relative to the S&P 500. Next, I’ll examine Paychex’s valuation today in order to see if the current valuation is justified by the fundamentals.
How Cyclical is Paychex?
In this article, I’m going to perform a very similar analysis as the one I performed on Paychex in June of 2019 and March of 2020 in order to see where Paychex’s valuation stands today and what sort of future returns we might expect if Paychex’s long-term earnings trend stays intact. As part of the analysis, I calculate what I consider to be the two main drivers of future total returns: Market sentiment returns and business returns. I then combine those expected returns together in the form of a 10-year CAGR expectation and use that to value the stock.
Before I begin this analysis, I always check the business’ long-term earnings patterns in order to ensure that the business is a proper fit for this sort of analysis. If the historical earnings 1) don’t have a long enough history 2) are erratic in nature, or 3) are too cyclical, then I either avoid analyzing the stock altogether or I use a different type of analysis that is more appropriate.
FAST Graphs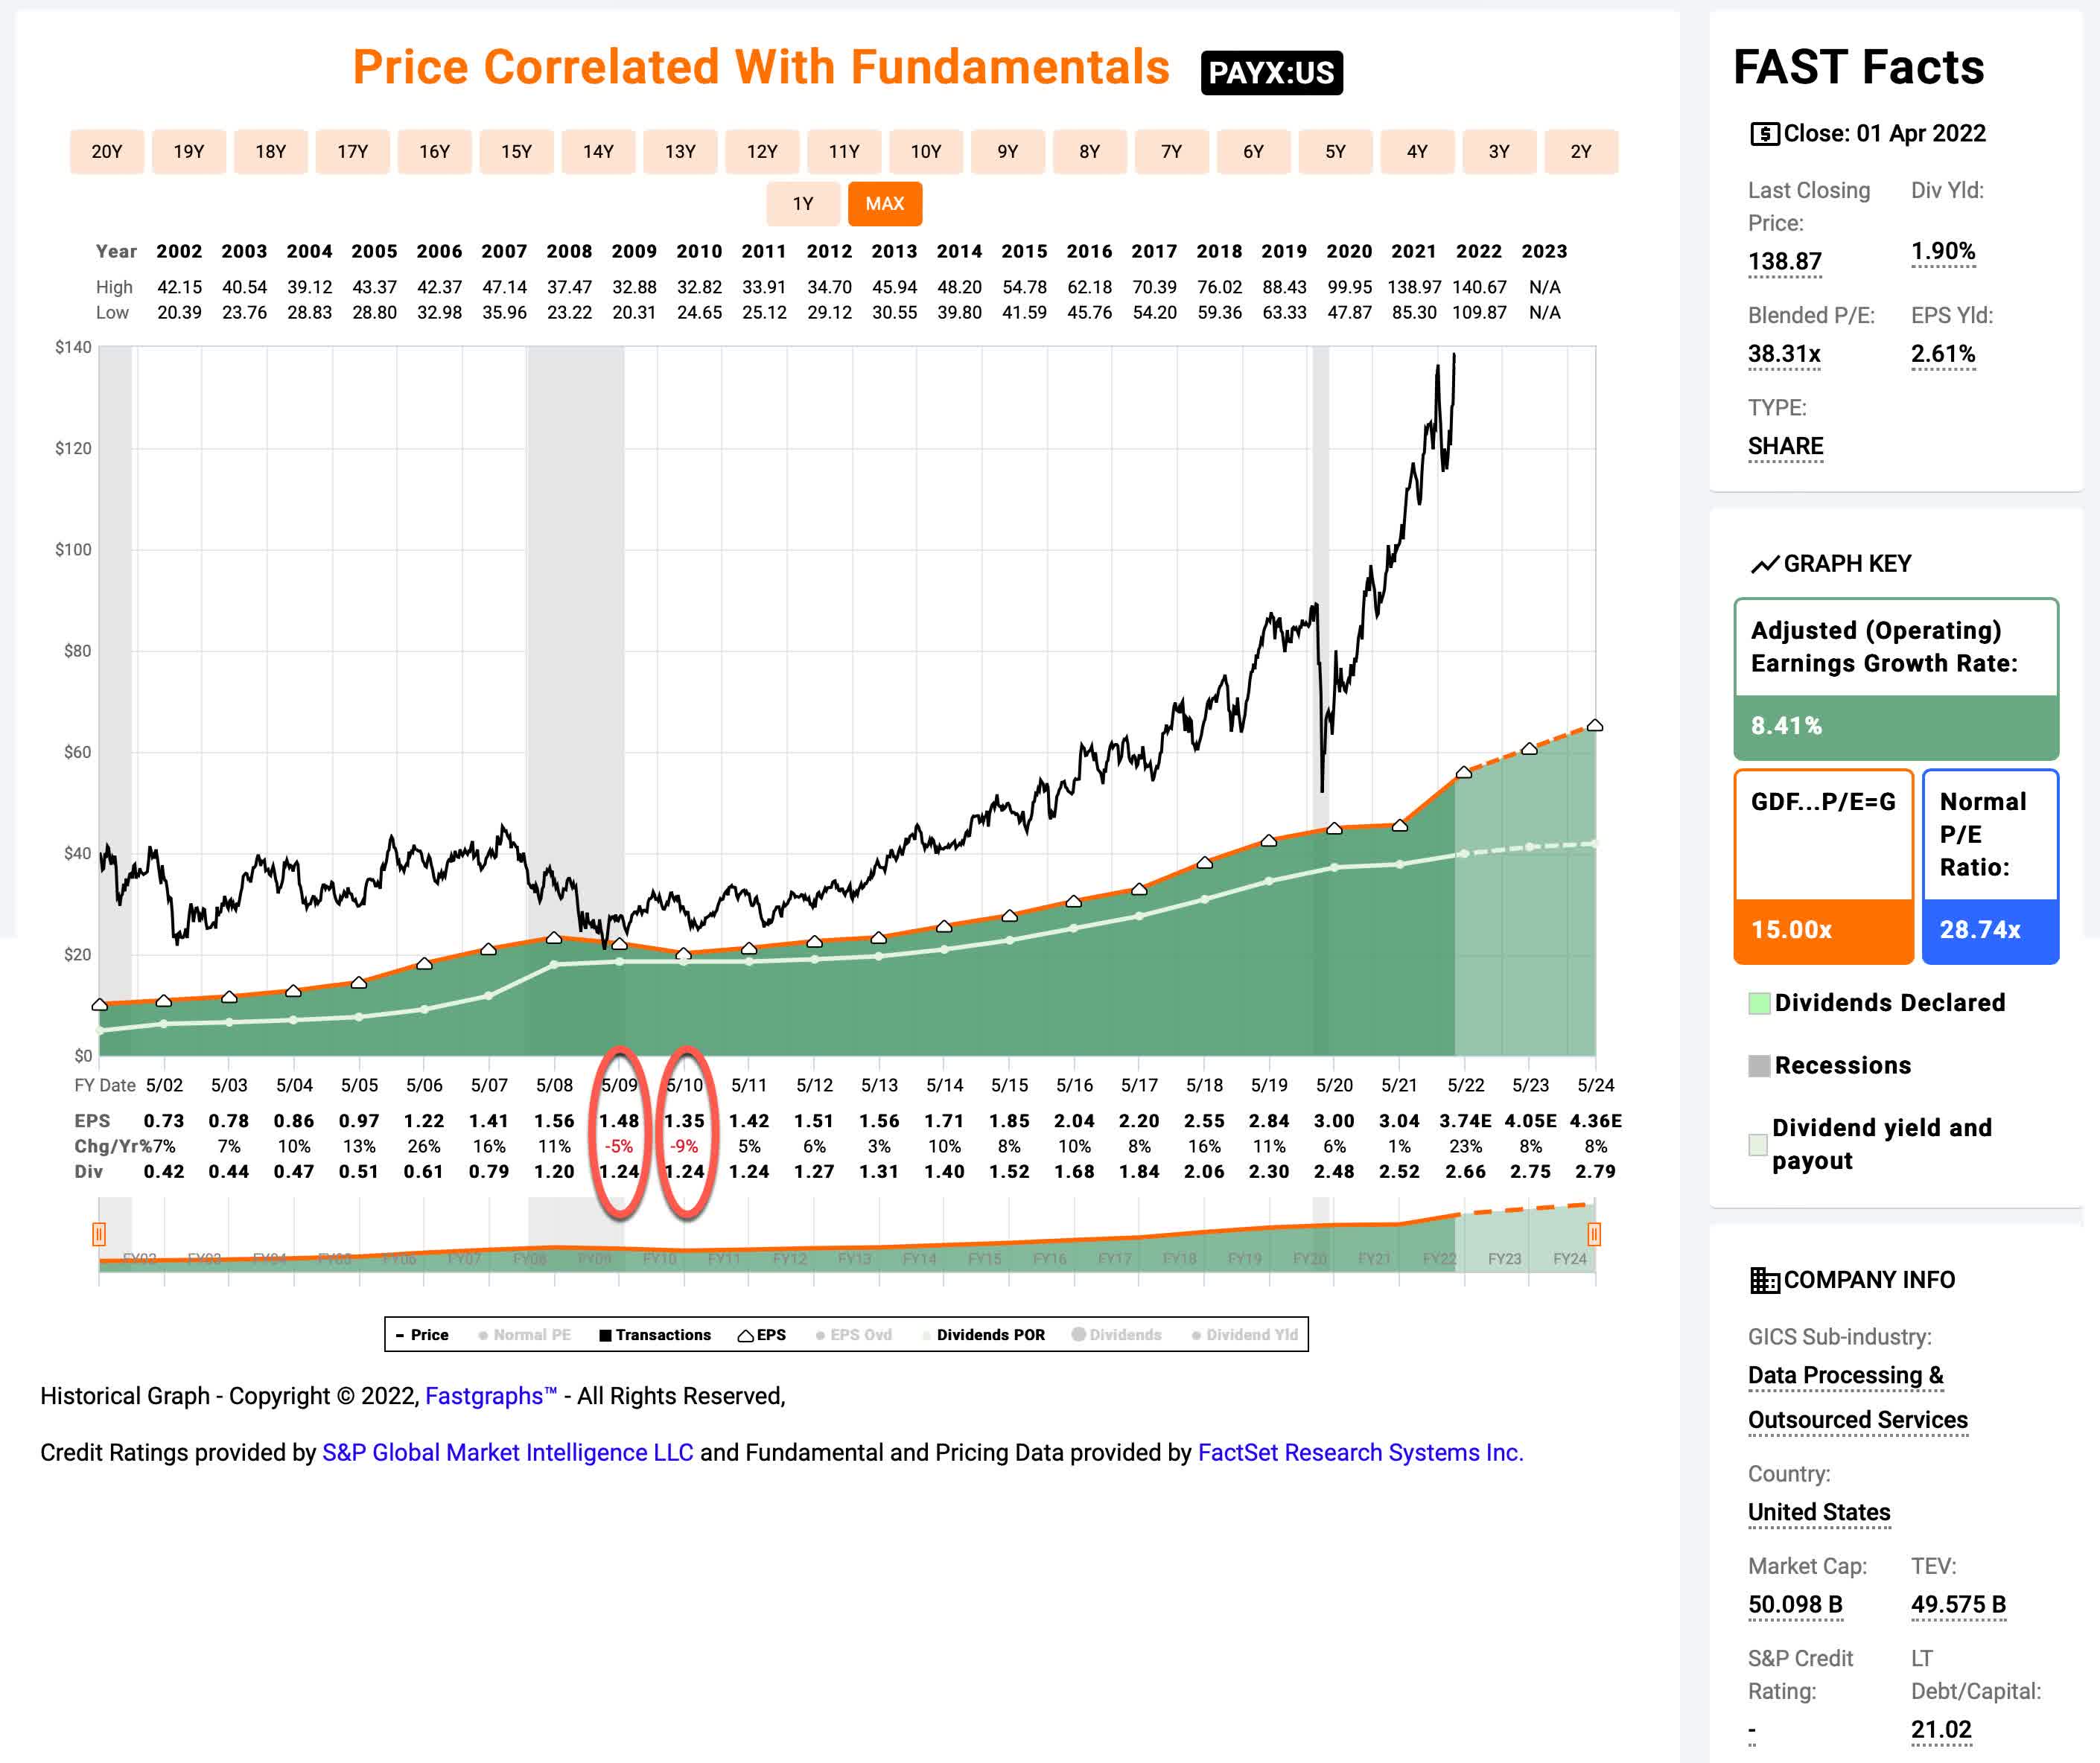
We have a full 20-year earnings history on FAST Graphs for Paychex, so there’s plenty of data. Earnings have been remarkably steady, which makes them relatively predictable. And earnings have only had two years of very modest declines during the Great Recession in 2009/10, so they aren’t very cyclical. Taking all this into account, Paychex meets all of the basic requirements for the Full-Cycle Analysis I’m about to share.
Market Sentiment Return Expectations
In order to estimate what sort of returns we might expect over the next 10 years, let’s begin by examining what return we could expect 10 years from now if the P/E multiple were to revert to its mean from the previous economic cycle. Since we have had a recent recession (albeit an unusual one) I’m starting this cycle in fiscal year 2015 and running it through 2022’s estimates.
FAST Graphs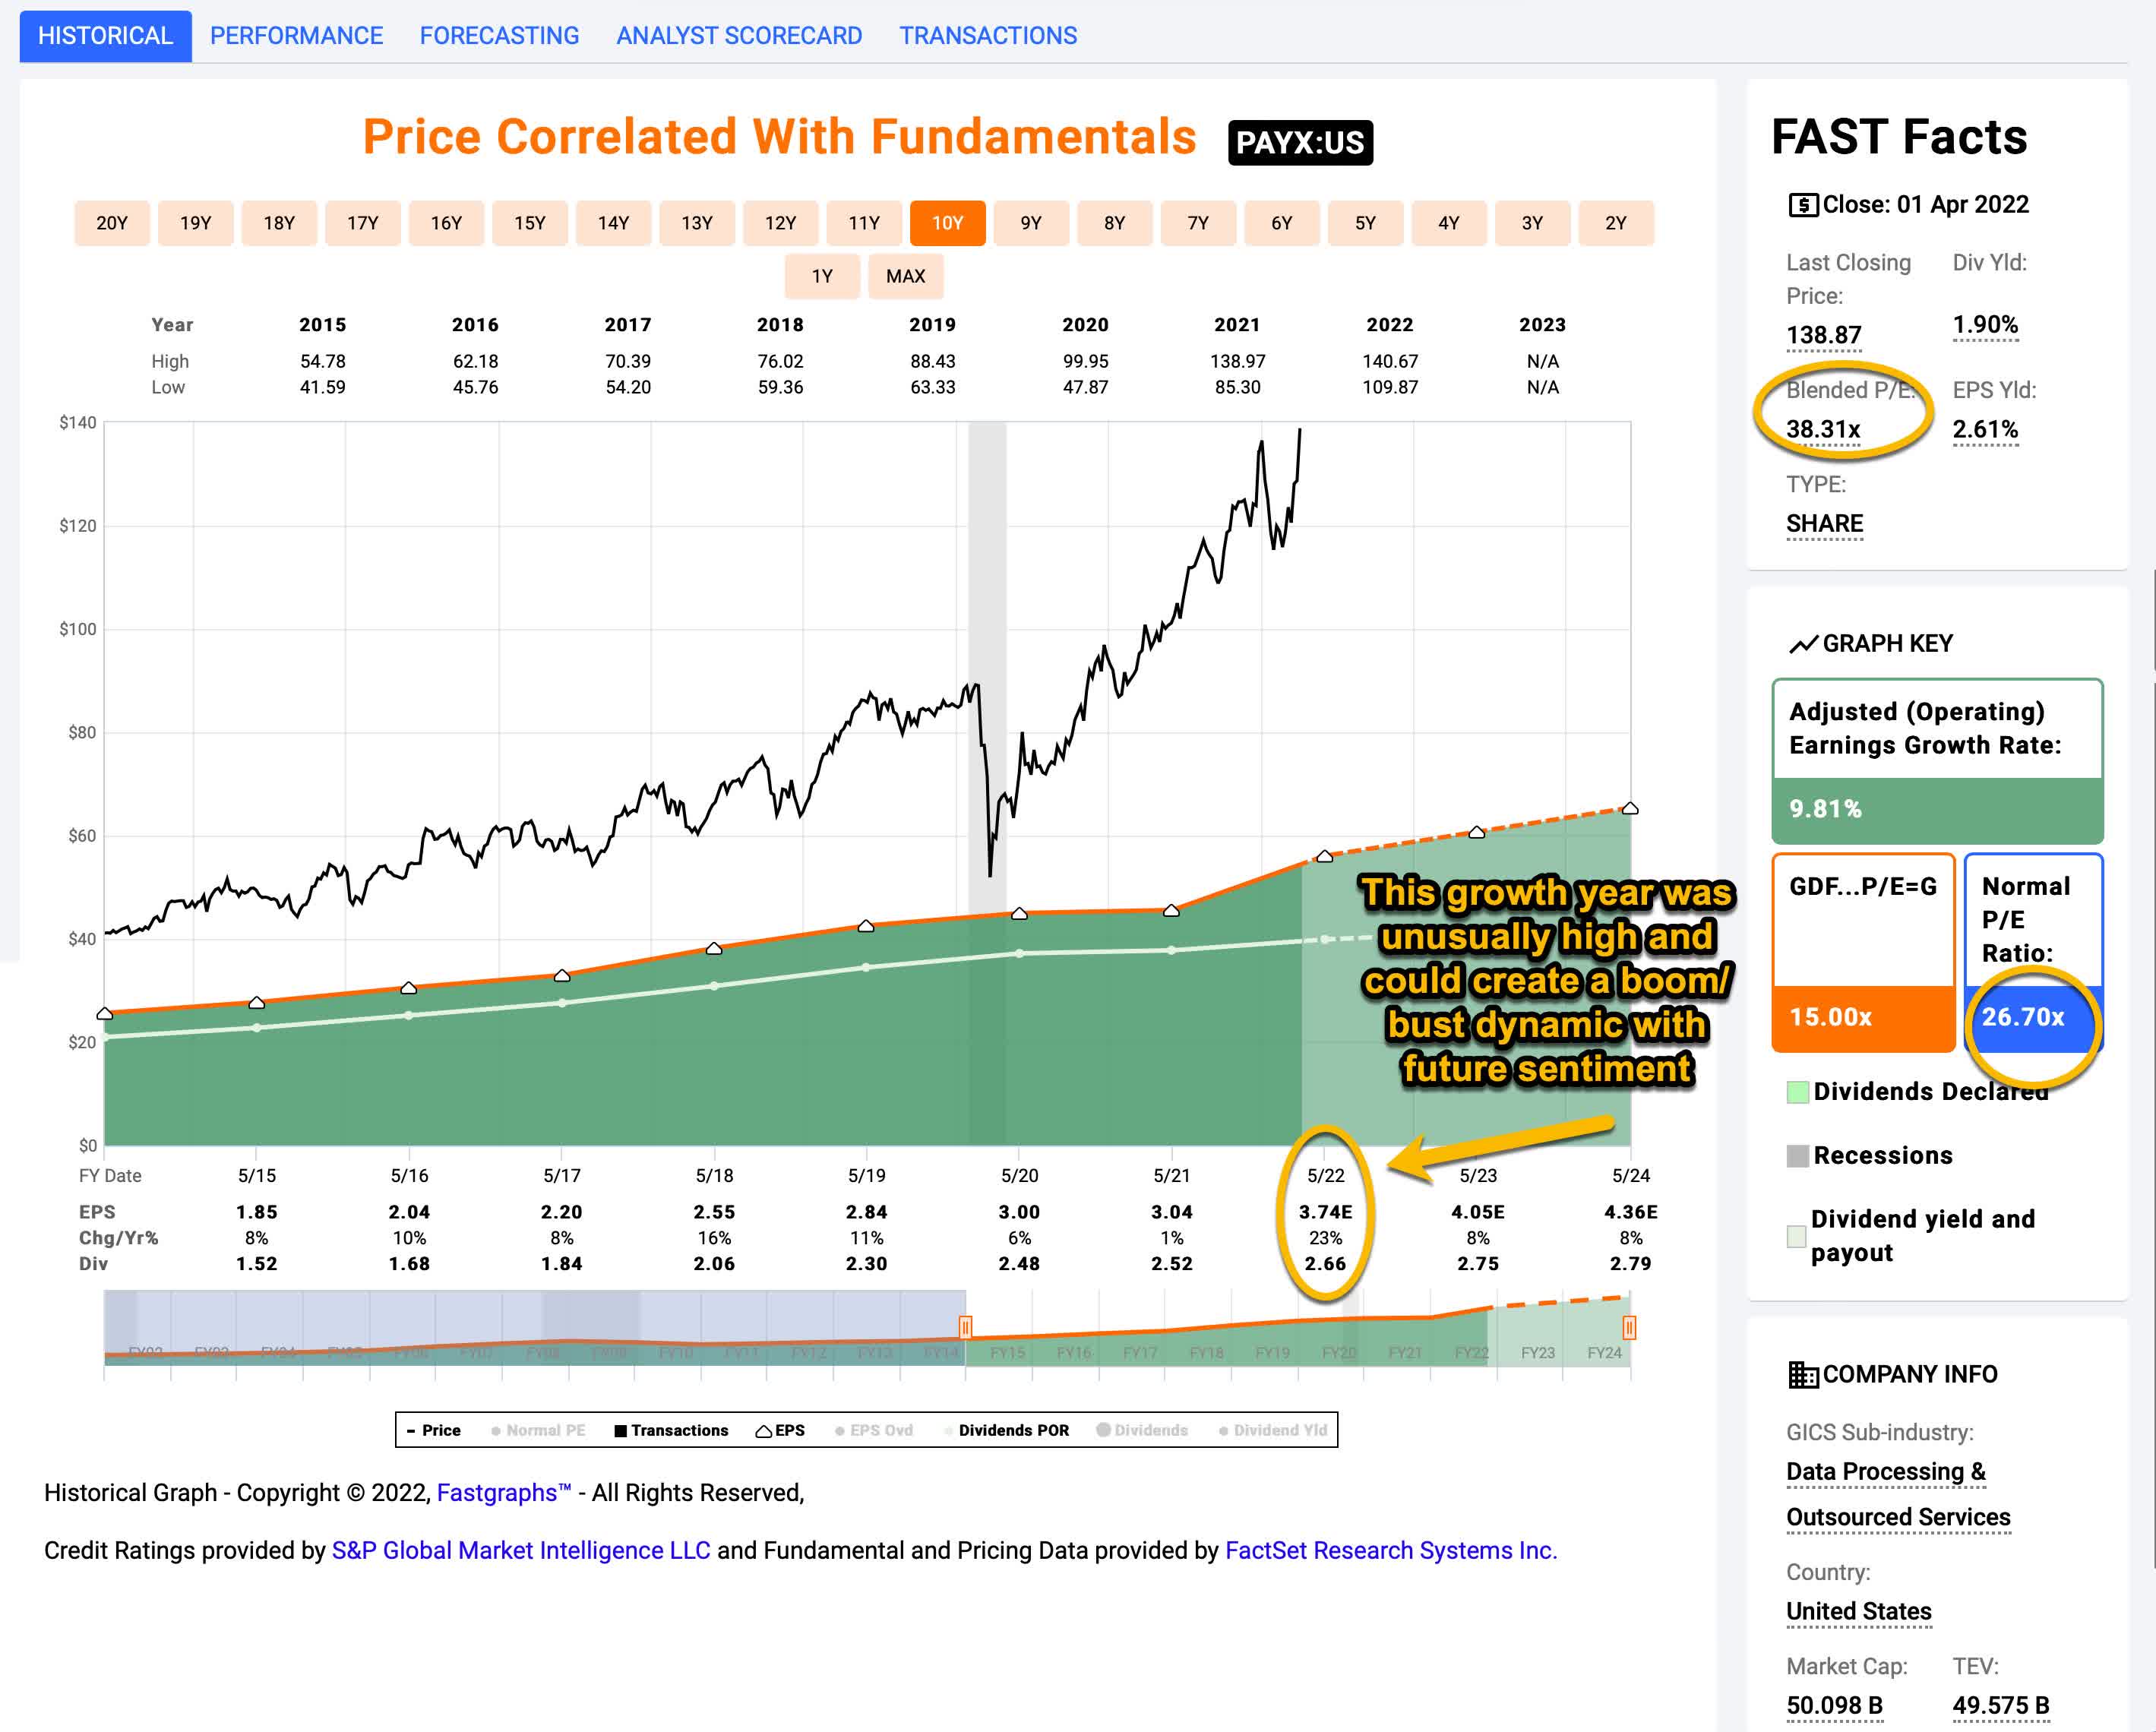
Paychex’s average P/E from 2015 to the present has been 26.70 (the blue bar circled in gold on the FAST Graph). Using 2022’s forward earnings estimates of $3.76 (also circled in gold), Paychex has a current P/E of 37.23. If that 37.23 P/E were to revert to the average P/E of 26.70 over the course of the next 10 years and everything else was held the same, Paychex’s price would fall and it would produce a 10-Year CAGR of about -3.23%. That’s the annual return we can expect from sentiment mean reversion if it takes ten years to revert. If it takes less time to revert, the losses could be quicker and steeper (as they were in 2020).
An additional factor worth noting that wasn’t clear back in December is that 2022’s earnings growth of 23% is a major historical outlier. While some of this might be from pent-up demand from 2021, it outpaces the earnings growth from both 2018 and 2019 which were pre-pandemic. I suspect some of this is directly related to one-time government stimulus, and I think it’s reasonable to think it might contract now that the stimulus has mostly ended. The difference isn’t as pronounced as it is with stocks like Apple and Alphabet (as I describe in this article), but it’s one additional downward risk factor for the stock during the next economic contraction. Given the short-term thinking in the current market, I wouldn’t be surprised if there are some shareholders who recently bought Paychex with the expectation of 20% earnings growth. Those investors will be sorely disappointed if they expect that kind of growth to continue beyond 2022, and it might cause them to exit the stock if earnings growth is slower.
Business Earnings Expectations
We previously examined what would happen if market sentiment reverted to the mean. This is entirely determined by the mood of the market and is quite often disconnected, or only loosely connected, to the performance of the actual business. In this section, I will examine the actual earnings of the business. The goal here is simple: We want to know how much money we would earn (expressed in the form of a CAGR %) over the course of 10 years if we bought the business at today’s prices and kept all of the earnings for ourselves.
There are two main components of this: The first is the earnings yield and the second is the rate at which the earnings can be expected to grow. Let’s start with the earnings yield (which is an inverted P/E ratio, so, the Earnings/Price ratio). The current earnings yield is about +2.70%. The way I like to think about this is, if I bought the company’s whole business right now for $100, I would earn $2.70 per year on my investment if earnings remained the same for the next 10 years.
The next step is to estimate the company’s earnings growth during this time period. I do that by figuring out at what rate earnings grew during the last cycle and applying that rate to the next 10 years. This involves calculating the EPS growth rate since 2015, taking into account each year’s EPS growth or decline, and then backing out any share buybacks that occurred over that time period (because reducing shares will increase the EPS due to fewer shares).
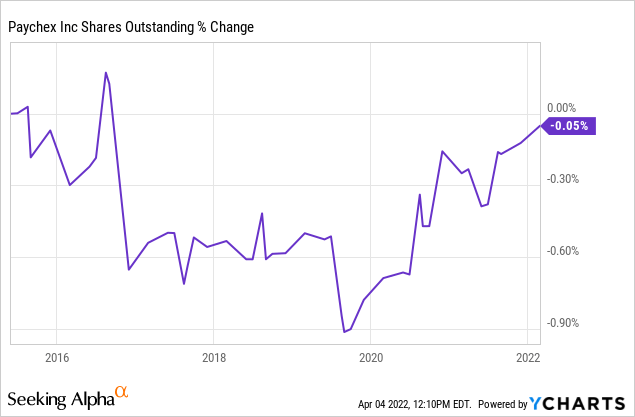
Paychex’s share count has essentially stayed the same for the past six years, so I don’t need to make much of an adjustment for buybacks. I typically also make adjustments for years in which EPS declined as well, but all of Paychex’s years over this period have positive EPS. I will factor in their slow 1% earnings growth in 2021, though. After doing that, I calculate an annual earnings growth rate of about +10.23% (which is very similar to the FAST Graphs estimate of +9.81%).
Next, I’ll apply that growth rate to current earnings, looking forward 10 years in order to get a final 10-year CAGR estimate. The way I think about this is, if I bought Paychex’s whole business for $100, it would pay me back $2.70 plus +10.23% growth the first year, and that amount would grow at +10.23% per year for 10 years after that. I want to know how much money I would have in total at the end of 10 years on my $100 investment, which I calculate to be about $147.91 (including the original $100). When I plug that growth into a CAGR calculator, that translates to a +3.99% 10-year CAGR estimate for the expected business earnings returns.
10-Year, Full-Cycle CAGR Estimate
Potential future returns can come from two main places: Market sentiment returns or business earnings returns. If we assume that market sentiment reverts to the mean from the last cycle over the next 10 years for Paychex, it will produce a -3.23% CAGR. If the earnings yield and growth are similar to the last cycle, the company should produce somewhere around a +3.99% 10-year CAGR. If we put the two together, we get an expected 10-year, full-cycle CAGR of +0.76% at today’s price.
My Buy/Sell/Hold range for this category of stocks is: Above a 12% CAGR is a Buy, below a 4% expected CAGR is a Sell, and in between 4% and 12% is a Hold. This makes Paychex a pretty strong selling candidate at today’s prices.
The Profile Of A Sentiment Cycle Stock
Back in 2019, I wrote a whole series of articles about what I call Sentiment Cycles. Unlike normal earnings-based cyclical stocks, in which the earnings of the businesses fluctuate dramatically with supply and demand, creating the category of stocks most people refer to as “cyclical,” the earnings of sentiment cycle stocks are actually very stable or only modestly cyclical. Instead of earnings fluctuating a lot, it’s actually sentiment that changes a lot over time so we see the change in sentiment reflected in the P/E ratio or earnings yield instead of earnings itself. Usually, sentiment cycles take a long time to form. My observation is that 15-20-year upcycles are the average. Below is a graph of Coca-Cola’s (KO) and Microsoft’s (MSFT) sentiment cycles as measured by their P/E ratios from about 1990 to 2014.
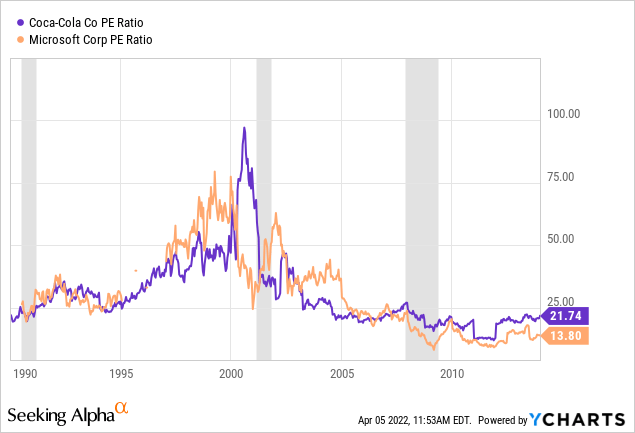
While there are always more factors working in the background since neither KO or MSFT have had particularly cyclical earnings, this huge spike we see in the 1990s in their P/E ratios mostly has to do with market sentiment, and when that sentiment changes then the stock prices, even for stable-earning companies, can fall pretty deeply.
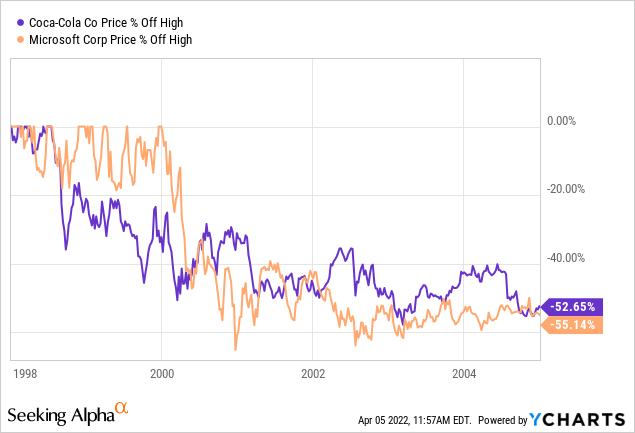
When the stocks came down off these sentiment cycles, they traded significantly lower than they did during the sentiment cycle highs.
It should be noted, however, that a dramatic price decline isn’t the only potential outcome. Another possible outcome is what I call a “Multiple Compression Cycle.” It’s caused for similar reasons, but instead of a big drawdown, the price essentially stagnates for many years until earnings eventually catch up to the price the market was willing to pay at the top of the cycle. I actually think a multiple compression cycle is the most likely outcome for Paychex because it’s such a steady and predictable earner. In the FAST Graph below I use Cerner (CERN) to illustrate what this cycle looks like.
FAST Graphs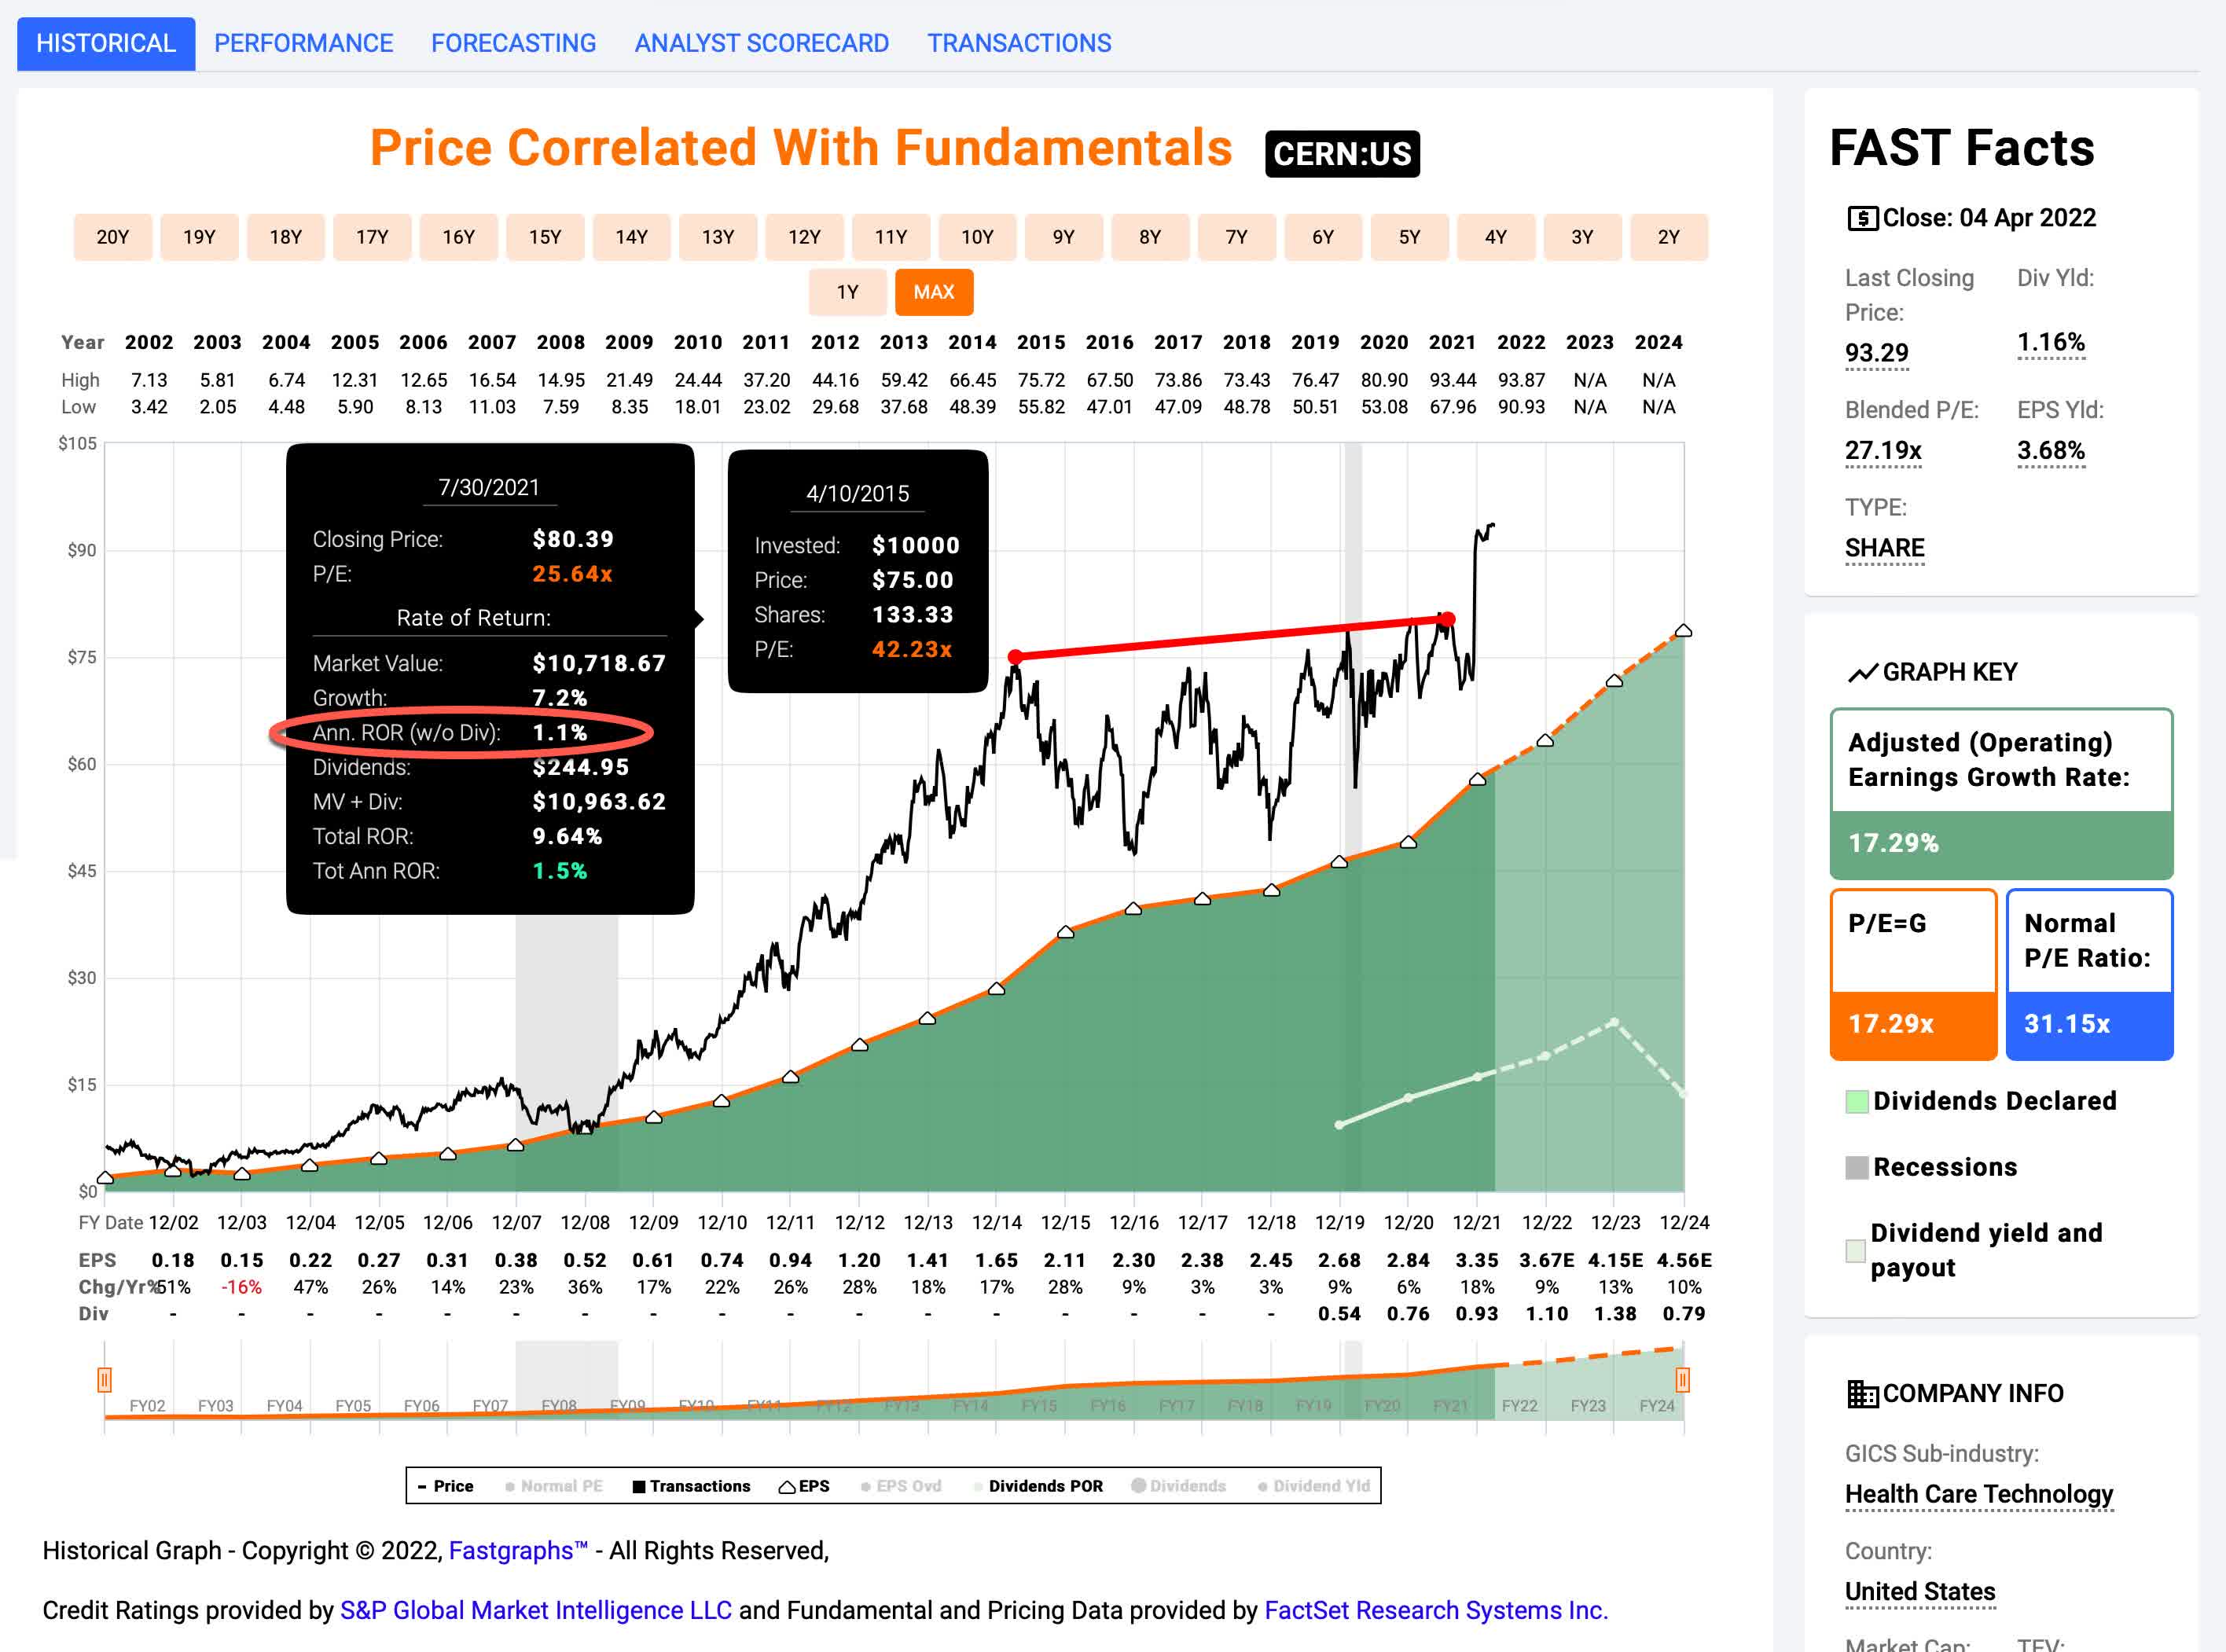
Cerner was a very steady-earning and growing business for more than decade leading up to 2015 when the P/E peaked out at about 40 or so (similar to where Paychex is now). After that, the stock price traded in a relatively tight range and never fell more than -30% off those highs, but it also didn’t return very much money as an investment, and it was basically flat over this time period (a period when the wider market grew fantastically).
A couple of years ago a put together a list of factors that I thought contributed to this sort of sentiment cycle, and I thought I would share them because many of them seem to fit Paychex quite well.
High Quality
I almost exclusively write about stocks that have been publicly traded for at least one full business cycle. So you will rarely see me write about stocks that have traded for shorter time periods than that. It’s pretty typical for newer businesses to trade at high P/E multiples, so it’s important to set those cases off to the side. They aren’t the stocks I’m writing about today. I’m writing about high-quality, established businesses.
What I’ve noticed anecdotally from watching the market and interacting with Seeking Alpha readers is that it becomes easier to disregard the price one is paying if the business is known to be high quality. For whatever reason, knowing that a stock has a low probability of losing money over a 20-year period makes it easier to justify paying an extremely high price for the stock. So, we can have situations like in 1999 when low-quality stocks like pets.com and high-quality ones like Microsoft, both trade at extremely high valuations. And the investors who chose Microsoft or Coca-Cola back then would indeed be better off than the pets.com investors. That little bit of insurance is enough for many investors to pay any price for a stock, even if it’s too high. So, ironically, the high quality of the business can lead to it becoming a bad investment (even if it avoids being the worst type of investment, one that goes to zero).
Long History of Steadily Rising Prices
Investors like stocks that never seem to go down and earnings that steadily rise. Many of the quality businesses that had traded at extremely high prices in 2000 had experienced a positive 20-year run from the early 1980s almost uninterrupted to the peak in 2000. When a stock almost never goes down, and in fact keeps going up year after year after year, a form of recency bias creeps in, and it’s easy to think it could keep going up for a long time without ever going down.
This also has the effect of creating a situation where more and more investors have deferred capital gains taxes build up in the stocks. This makes them reluctant to sell and pay those taxes and makes them more likely to keep holding the stock even though they would never consider buying more at such high valuations. The longer and steeper a stock’s rise goes on, the more of these investors there likely are.
A Good Narrative
Often stocks trading near cyclical peaks have good stories about future growth attached to them. Sometimes they are tied to the past and the long history of a rising stock price (or rising dividends). Other times the story is about something new, like international expansion for Coca-Cola, or the internet with Microsoft. But usually, there’s a story of some sort.
Interestingly, often at the time a major sentiment cycle is occurring, there will be classes of stocks that can’t find a story or that don’t have a long history of steadily rising prices or dividends. These stocks can sometimes trade at reasonable levels while a major sentiment cycle is occurring. This happened in the late 90s with tobacco stocks, some oil stocks, cyclicals that weren’t technology companies, boring value stocks, and banks. They just couldn’t find a compelling narrative the way tech stocks and “blue chips” could.
Brand Recognition
There are actually quite a few stocks I’ve found that aren’t household names that still go through sentiment cycles, but quite often I see these cycles with name brands. Sometimes this can matter from an investing standpoint. For example, let’s say the narrative about increasing air travel being in a secular uptrend is correct. And that because of this narrative investors flock to airline stocks and Boeing (BA), etc., because they recognize those names. It’s often the case that the stocks of smaller suppliers that benefit from the same secular trend will be able to be purchased at much better prices than the name-brand stocks that everyone has heard of before.
I’ve noticed less of this dynamic in the current cycle, and I think that probably is because the internet allows investors to screen more obscure stocks, but I still think having a brand name contributes a little bit to overvaluation.
Late Cycle
It’s hard to find times when we are early or mid business cycle when a large number of high-quality stocks are trading at premium P/E multiples. And it makes sense that we would find these premium P/Es during the later stages of the business cycle. During the late cycle, people are making more money and therefore have more money to invest. So it makes sense P/Es would be driven up by a strong economy.
I sometimes read posts by writers who take a weekly look at macro-economic data and opine on it. It utterly baffles me when they post chart after chart and data point after data point that shows how strong the economy is, but that also clearly mirror what we saw in early 2000 or in 2007, and then go on to tell their readers to do nothing but say the course. They discourage “getting defensive” as I have mostly been suggesting is a wise move the past year-and-a-half, and instead adopt a “do-nothing” attitude. It’s precisely this sort of thinking that will sink many investors who fail to see that we are in the latter stages of the business cycle.
The cycle can still go on for a while, and there might not necessarily be a big crash at the end, but to pretend that the cycle doesn’t exist is wishful thinking at best, and lunacy at worst.
Fortunately, it’s mostly unnecessary to make big macro-economic predictions in this matter, because the implied future returns based on the earnings yields of the individual businesses tell the story themselves. Whenever you find yourself requiring low-interest rates forever in order to justify holding a stock, 9 times out of 10, you’re better off selling. Thankfully, you don’t need a ton of macro-data to make that sort of decision. But when you start seeing dozens and dozens of stocks with very low implied returns, it’s as good of sign as any we are getting later in the business cycle.
Technology Will Negate the Past
Another theme that seems to contribute to sentiment cycles is that previous methods of valuation are made obsolete because of technology. Sometimes, there’s some truth to this. Growth of Internet companies is less restricted compared to big industrial businesses because of lower expenses and better scalability, for example. But typically what happens with a sentiment cycle is that the math gets really fuzzy. We never get really hard numbers on how this time will be different because of technology, and usually, the hype doesn’t match the reality.
Importantly, this doesn’t just apply to “technology companies.” If we take an established business like Starbucks (SBUX) for example, and let’s say their ability to connect with customers through smartphones enhances the growth in their business for a couple of years. That could lead to the assumption that this technology has fundamentally changed the core business and that it can go on growing at that rate forever. This assumption can lead to rising multiples and investors overpaying for Starbuck’s stock because they over-extrapolate the benefit of the technological advancement.
There’s an irony, that these technological advances are most dangerous when they are true. That’s what makes them work to build up the sentiment. There aren’t good arguments against the technology bulls except with regard to the sustainability and degree with which the technology improves long-term earnings for the businesses in question. And imaginations can then start inputting whatever projections they wish in order to justify the high prices being paid for the stock.
Momentum Traders
It’s widely known that stocks whose prices are rising tend to keep rising, and stocks whose prices are falling tend to keep falling. There are all sorts of traders and algorithms designed to take advantage of this phenomenon. These aren’t necessarily value-sensitive strategies. So they can theoretically become contributing factors to sentiment cycles both on the way up, and on the way down.
Not all of these would apply perfectly to PAYX, but most of them do, and I think in the current environment I would add one more, and that’s investors using the stock as a bond proxy. There are lots of boomers in and entering retirement and bond yields have been near historic lows. PAYX is the type of stock that can almost certainly pay its dividend and raise it to cover inflation over the next decade. That makes it attractive as a bond replacement. And if we look at Cerner’s multiple compression cycle, if they had paid a dividend the whole time, an investor who just wanted the dividend would have done okay. However, now bond yields are rising rapidly, and Paychex’s 1.90% dividend yield might not continue to look as attractive as it did when it was 3%.
Conclusion
Paychex is a great and steadily growing business just as it has been for years. But sometimes the sentiment simply gets too high given the likely future returns an investor will ultimately receive. Every business has some price that’s too high to pay, and I think Paychex is at that level now. With the Federal Reserve rapidly raising rates and government stimulus likely finished for the next three years, the odds of an economic slowdown by 2023 and a corresponding bear market are higher than average. That means that within the next couple of years, it’s likely Paychex stock will trade at a more reasonable price. I have the fair value range for Paychex at about $72 to $95 per share, and for value investors who would like a margin of safety like myself, my current buy price for the stock is $63.70, and at that point, I would likely be a buyer myself. I think there is an above-average chance it trades down to that fair value range within the next two years. It will probably take a full recession and bear market for it to hit my buy price, and the chances of that happening are lower, but still in the realm of possibility.
Be the first to comment