

Ivan Zhaborovskiy/iStock via Getty Images
Introduction
Paramount Resources (OTCPK:PRMRF) is a Canadian natural gas producer with a substantial by-product credit from condensate and NGLs (in fact, although liquids only made up 42% of the oil-equivalent production rate in Q2, they represented 70% of the revenue). The high natural gas price in the first half of the year has boosted the cash flows but the second semester could perhaps be even better as the production rate will increase by about 40%. And this is just the set-up for a long-term plan with a 7% annual production growth which will be fully funded by the incoming operating cash flow. It has been ages (more than six years!) since I last published an article on Paramount, and the company has completely changed in these years.
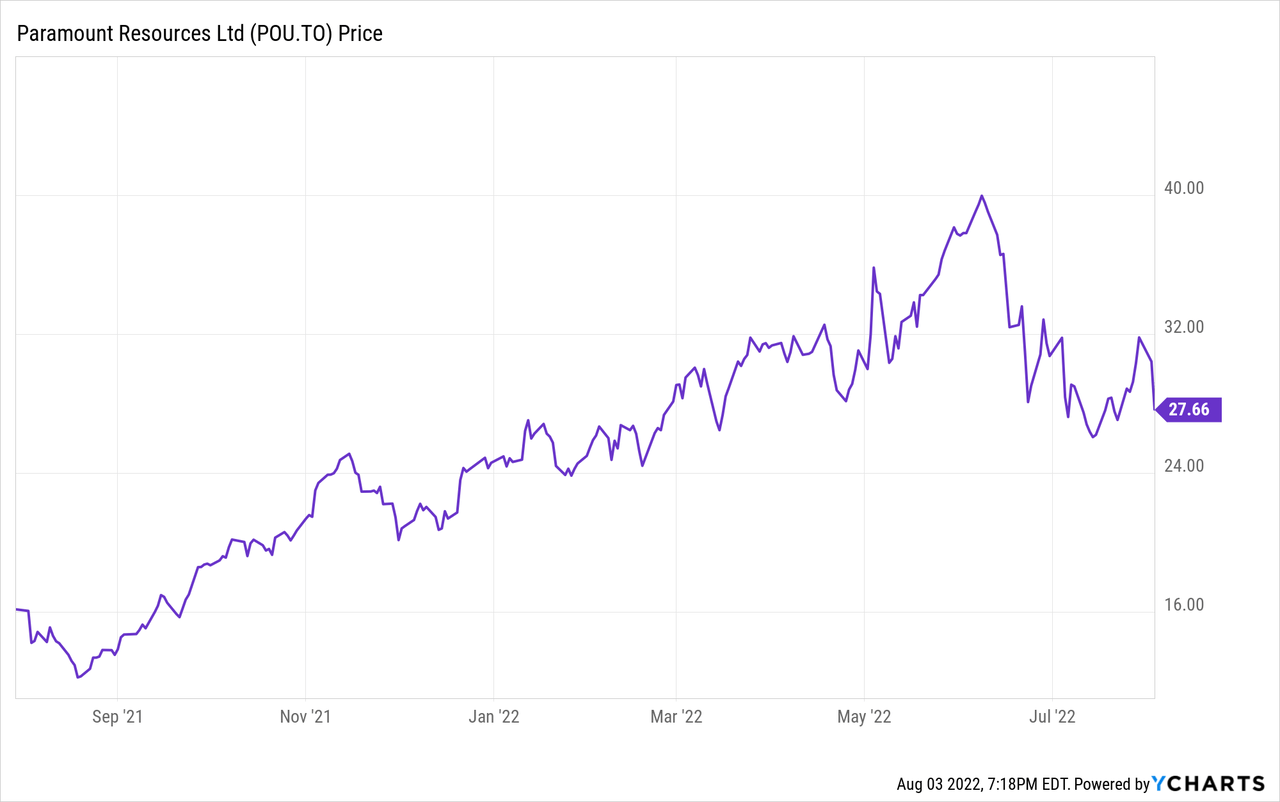
Paramount’s primary listing is on the Toronto Stock Exchange where the stock is trading with POU as its ticker symbol. With an average daily volume of almost 500,000 shares, the TSX listing is by far the best choice to trade in the company’s shares. On top of that, that listing has options available which could be a useful tool due to the high volatility levels.
The Q2 results are just a warming-up for what will be an exciting second semester
Before diving into the numbers I’d like to make sure you know the Q2 (and H1) results are not representative of Paramount Resources right now. The average production rate in Q2 was ‘just’ 77,300 barrels of oil-equivalent per day while the July production result already jumped about 20% higher to 92,000 boe/day with a July exit rate of 100,000 boe/day (+30% compared to the Q2 production rate. And that’s still just the start as Paramount has confirmed it expects an average production rate in H2 of 102-106,000 boe/day, the midpoint of 104,000 boe/day and the known July production result means the average production rate in the remaining five months of the year will be just over 106,000 boe/day.
Paramount Resources Investor Relations
Keep that in mind when you continue reading as the Q2 results are already massively outdated by now.
In the first half of the year, the company reported a total revenue of C$966M and after deducting the C$193M hedge losses, the net revenue was approximately C$773M. This is based on an average realized natural gas price of just under C$6/Mcf and a condensate and oil price of C$126M on average.
With total operating expenses of C$511M, the pre-tax income was approximately C$262M with a reported net income of C$199M. With a current share count of
Paramount Resources Investor Relations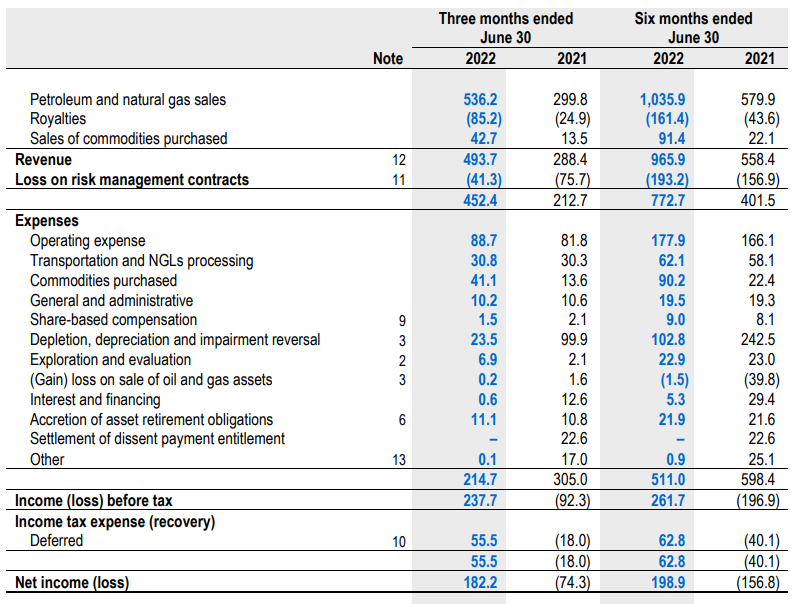
As you notice above, the second quarter of the year was substantially stronger than the first quarter due to the stronger natural gas price and the reversal of a historical impairment charge to the tune of in excess of C$45M. This is hidden in the relatively low depletion and depreciation charges.
And although the current situation is already substantially different from the H1 or even Q2 performance, I’d like to pull up the cash flow statement to explain what we can expect for this year.
The total operating cash flow was approximately C$470M excluding changes in the working capital. Even after deducting the C$4M in lease payments, the adjusted operating cash flow was approximately C$466M.
Paramount Resources Investor Relations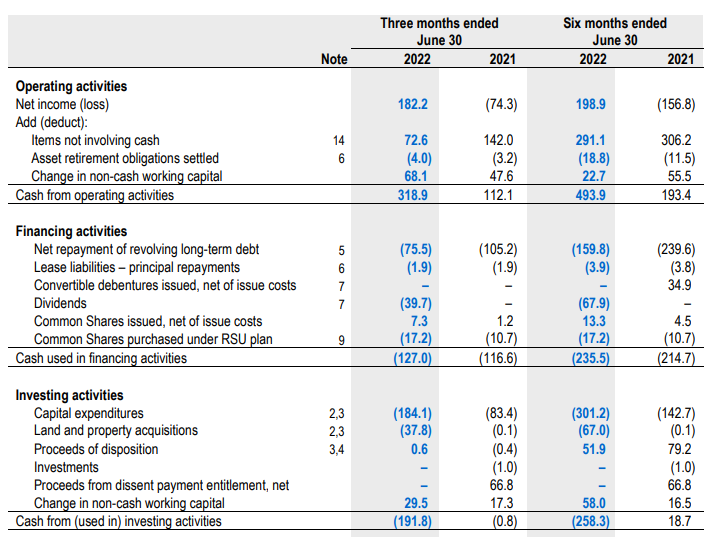
The total capex bill came in at C$368M resulting in a free cash flow result of approximately C$98M. Note, this includes a C$110M realized loss on hedges, and excludes the C$63M in taxes which are entirely deferred. In fact, due to existing tax assets, Paramount thinks it won’t have to pay a dime in taxes for the next three years. So excluding the realized losses on hedges, the H1 operating cash flow would have been approximately C$580M.
If we would now indeed assume the H2 production rate increases by 35%, the H2 operating cash flow would come in at C$780M for a full-year cash flow performance of roughly C$1.3B (excluding any hedging losses). As Paramount is now guiding for a full-year capex of C$600-640M, the second semester performance will be very strong given the strong production increase and lower capex of approximately C$250-280M. This means that even if the average natural gas price drops to less than C$5, Paramount will still generate a few hundred million dollar in free cash flow in the current semester. This means Paramount will very likely end the year with no net debt. The net debt came in at C$375M as of the end of June but be warned Paramount also includes a working capital deficit in its net debt calculation but it excludes the asset retirement obligations.
The plans for 2023 are perhaps even more exciting
What really intrigued me are the updated plans for 2023. And this slide from the corporate presentation is very important to explain my investment thesis.
Paramount Resources Investor Relations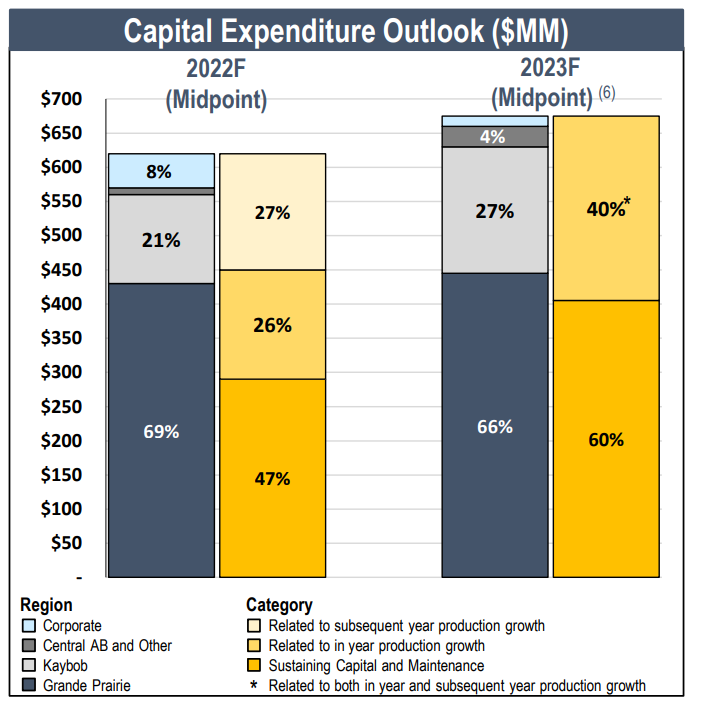
We see the total capex for next year is estimated at approximately C$675M of which approximately 60% is sustaining capex. That’s roughly C$400M. We also know Paramount is expecting to generate an adjusted funds flow of just over C$1.4B in 2023, resulting in a sustaining free cash flow result of approximately C$1B.
Paramount Resources Investor Relations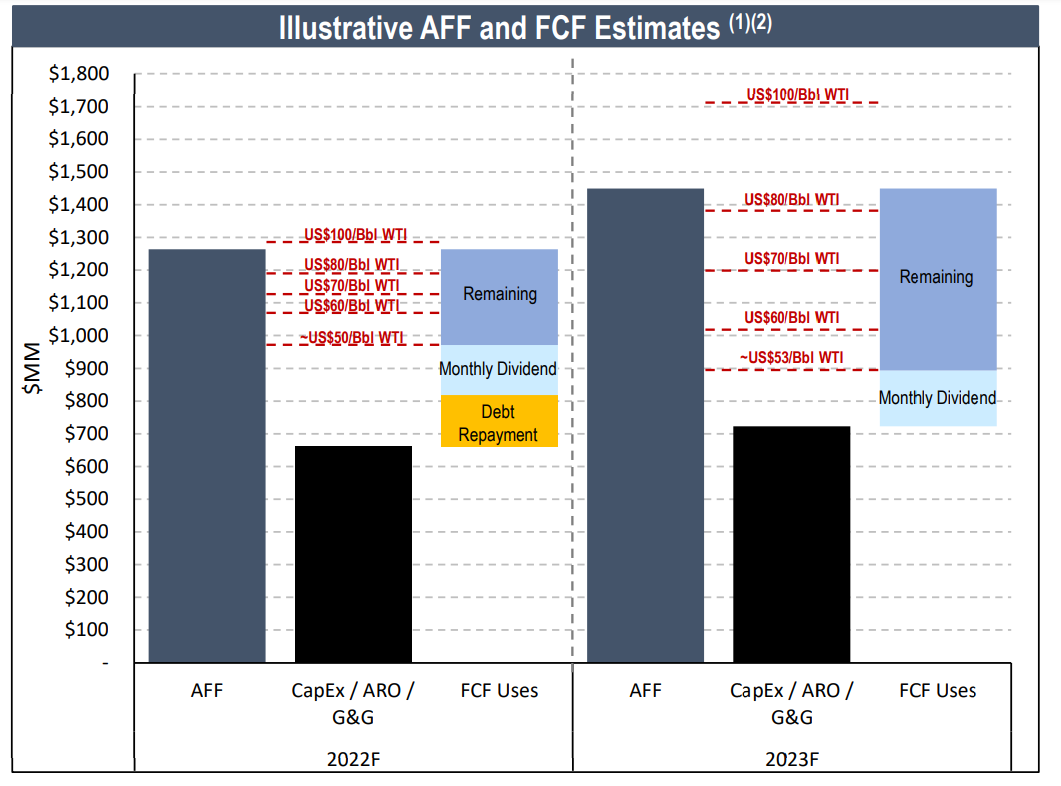
Of course it’s easy enough to create a chart, it all depends on the commodity prices used in the projections. In Paramount’s case, the company is using US$84 WTI and C$5.06 AECO/US$5.68 NYMEX as natural gas price. Even if the commodity prices would fall by 15% compared to the base case scenario, the adjusted funds flow would still come in at approximately C$1B with a free cash flow result of C$350M and a sustaining free cash flow result of C$600M. That sounds less appealing, but keep in mind the share count has dropped to just 141M shares. So even at a 15% lower commodity price across the board, the free cash flow result per share would still be C$2.5 including growth capex and about C$4.25 per share based on just the sustaining capex.
Paramount figures it can continue to grow its production rate by 7% per year using approximately C$650M per year in capex. And using strip prices, this should result in C$3.9B in cumulative free cash flow. Which is the current market capitalization of the company.
Paramount Resources Investor Relations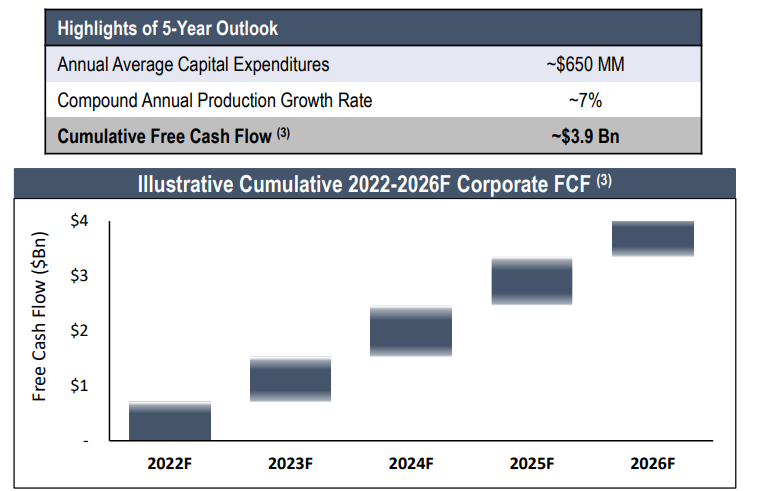
Investment thesis
Paramount is in an excellent position to capitalize on the very high fossil fuel prices. We should see a very strong third quarter and if the oil and gas prices cooperate, 2023 could be the company’s best year on record with a revenue of around C$2.5B and a sustaining free cash flow of C$1B. That could pave the way to either accelerate production growth or increase the shareholder rewards beyond the current monthly dividend of C$0.10/share.
The 2P reserves as of the end of last year underpin a 17 year reserve life (using the anticipated exit rate of in excess of 100,000 boe/day. The after-tax PV10 value of the proved reserves represents C$3.5B or C$25/share while the probable reserves add an additional C$2.06B or C$14.5/share to that. These calculations are based on a WTI oil price of around US$70-72 and a Henry Hub and AECO natgas price of respectively around US$3.30-3.40 and C$3.30 per MMBtu.
Despite the share price evolution in the past few quarters, I think there’s more upside potential here.
Be the first to comment