


Friends watching movies together at home
demaerre
Introduction
When searching for fresh investment ideas on Seeking Alpha, I came across Paramount Global (NASDAQ:PARA) (NASDAQ:PARAA), which had two consecutive ‘Strong Buy’ ratings by recent Seeking Alpha analysts:
Paramount Global Strong Buy Ratings (Seeking Alpha)
Intrigued, I decided to take a closer look at the numbers and narratives:
My View on Paramount
I make three key observations:
- Subscriber growth in Paramount+ and Showtime OTT is strong
- All round weakness in TV Media execution
- Positive surprises and cost levers may spell a better margin outlook
Subscriber growth in Paramount+ and Showtime OTT is strong
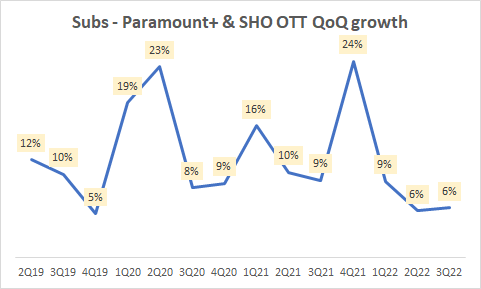
Subscribers – Paramount+ & SHO OTT QoQ growth (Company Filings, Author’s Analysis)
Domestic Paramount+ and Showtime OTT subscribers make up almost 61% of the subscriber base as of Q3 FY22.
As can be seen in the chart above, despite a rather sharp QoQ growth rate decline since Q4 FY21, Paramount+ & Showtime OTT is still tracking a very healthy rate of 6% QoQ growth. This corresponds to more than 25% YoY growth.
The strong growth from domestic subscribers has been a key driver of the overall business’ growth, which is tracking around 4% QoQ CAGR and a high teens YoY CAGR.
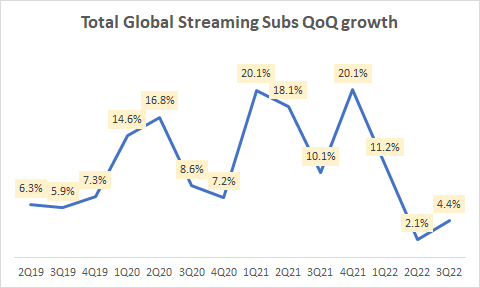
Total Global Streaming Subscribers QoQ growth (Company Filings, Author’s Analysis)
Thus, I contend that subscriber growth is strong in Paramount’s core DTC business. This is a silver lining to partially offset a more worrying fact:
All round weak TV Media growth
As of Q3 FY22, 71.1% of Paramount’s revenues came from its linear TV Media segment. Over the last few quarters, this business has de-grown, even after accounting for seasonality effects (see 4-period moving average decline):
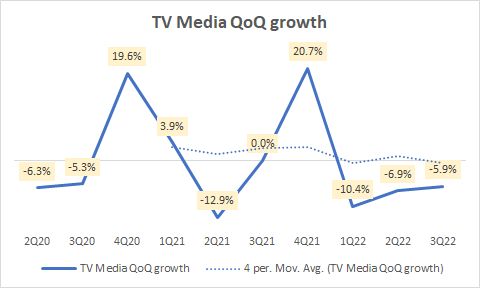
TV Media QoQ growth (Company Filings, Author’s Analysis)
This has been due to slow advertising performance, which makes up almost 40% of TV Media revenues. This is evidenced by the downtick in the 4-period moving average line in the chart below:
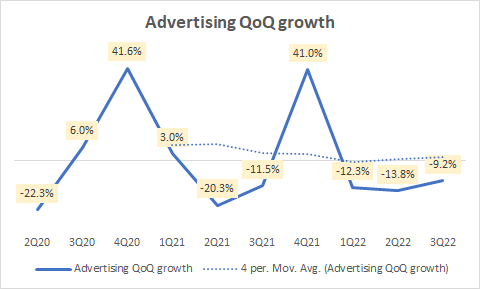
Advertising QoQ growth (Company Filings, Author’s Analysis)
Affiliate and subscription sales within the TV Media segment also makes up roughly 40% of the mix. This too has been declining:
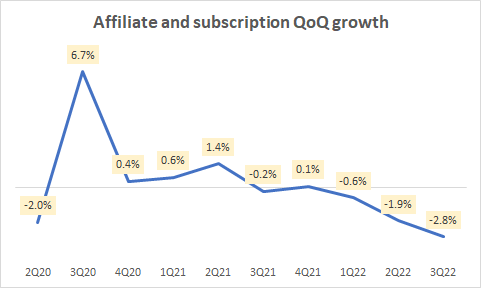
Affiliate and subscription QoQ growth (Company Filings, Author’s Analysis)
Finally, licensing revenues, which makes up the remainder 20% of TV Media sales mix has also been ticking down as of late:
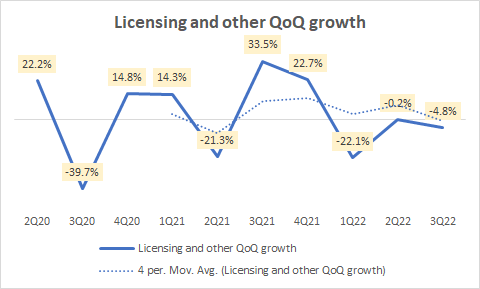
Licensing and other QoQ growth (Company Filings, Author’s Analysis)
This spells all-round weakness in Paramount’s core business. Moreover, in the Q3 FY22 earnings call, the company noted that it expects advertising performance to be worse in Q4 FY22.
These results are consistent with structural declines in advertising spends in US TV. According to data from eMarketer and Statista, US TV ad spends are expected to de-grow at 1.3% CAGR over the next 5 years, from $68.4bn to $64.9bn:
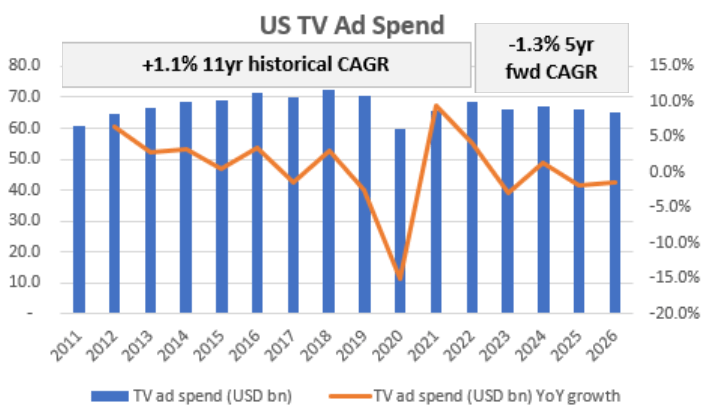
US TV Ad Spends (eMarketer, Statista, Author’s Analysis)
I believe the outlook for advertising revenues in linear TV is bleak is because the demographical consumer behavior patterns are a key headwind. As the chart below shows, out of 2,200 people surveyed across generations, it was found that almost half of Gen Z (born during 1997 – 2012) adults find linear TV ads to have low effectiveness in influencing their buying patterns:
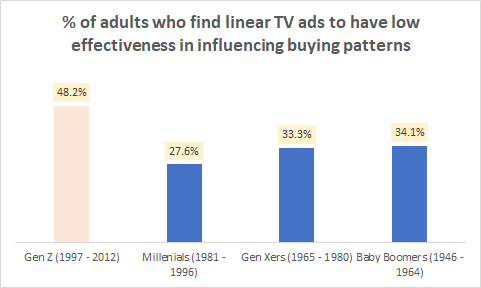
Effectiveness of linear TV ads (Morning Consult Survey September 2021, Author’s Analysis)
Overall, the poor execution against structural headwinds make me very cautious on Paramount’s core business.
Positive surprises and cost levers may spell a better margin outlook
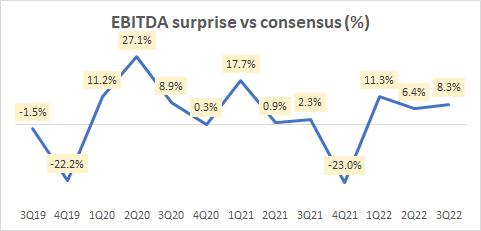
EBITDA surprise vs consensus (%) (Company Filings, Seeking Alpha, Author’s Analysis)
For the past 3 quarters, there have been meaningful margin beats of 11.3% in 1Q FY22, 6.4% in 2Q FY22 and 8.3% in 3Q FY22. Indeed, despite the weaker revenue growth, EBITDA margins have been relatively more resilient in the current environment over the 2022 quarters:
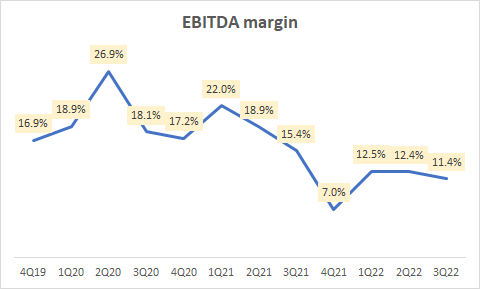
EBITDA margin (Company Filings, Author’s Analysis)
To add to this resiliency, I believe we will see margin levers from cost efficiencies realized from the consolidation of Paramount+ and Showtime as they are both businesses with complementary offerings. Just last month in December 2022, the company launched a bundle subscription of these two offerings. I believe this is evidence of the fact that the company would realize marketing efficiencies going forward.
Thus, I am a little bit more constructive on my margins outlook.
Valuation
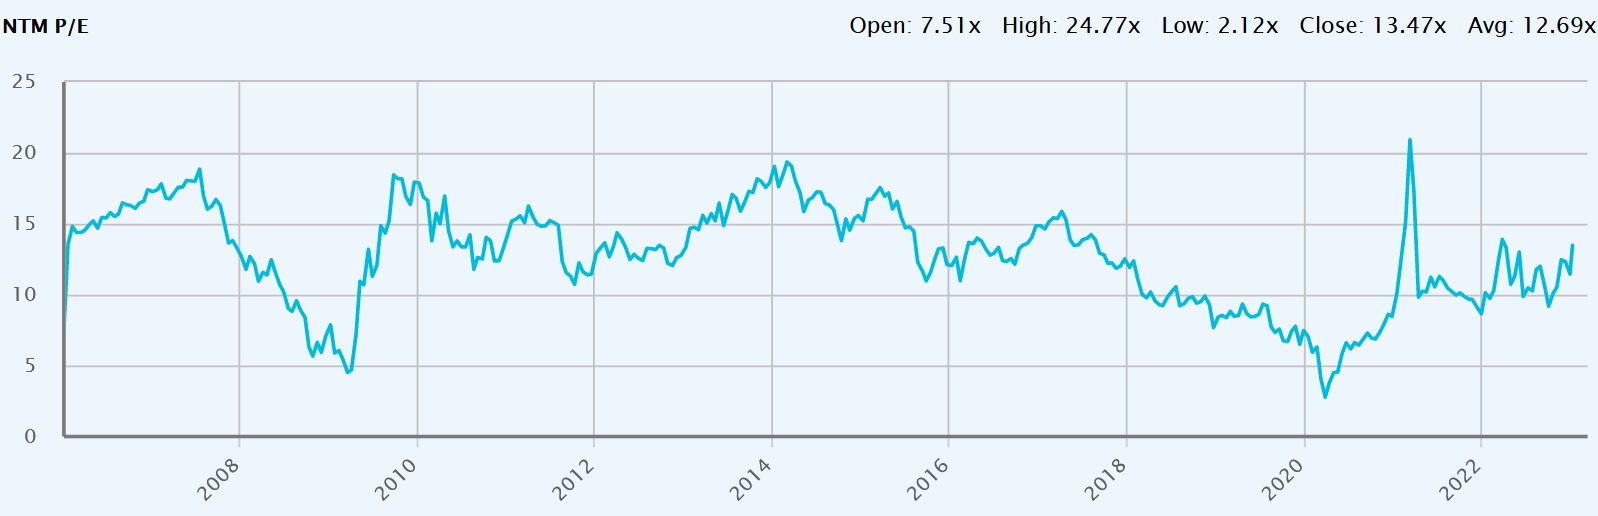
Paramount 1-yr fwd PE (Capital IQ)
Paramount currently trades at a 1-year forward PE of 13.47, which is a 6.1% premium to its longer term average. Considering the structurally unfavorable positioning in the core advertising business coupled with weak execution ad revenue execution over the past few quarters, I believe justifying this premium would cost some margin of safety in the investment.
Technical Analysis
If this is your first time reading a Hunting Alpha article using Technical Analysis, you may want to read this post, which explains how and why I read the charts the way I do, utilizing principles of Flow, Location and Trap.
Relative Read of PARA vs SPX500
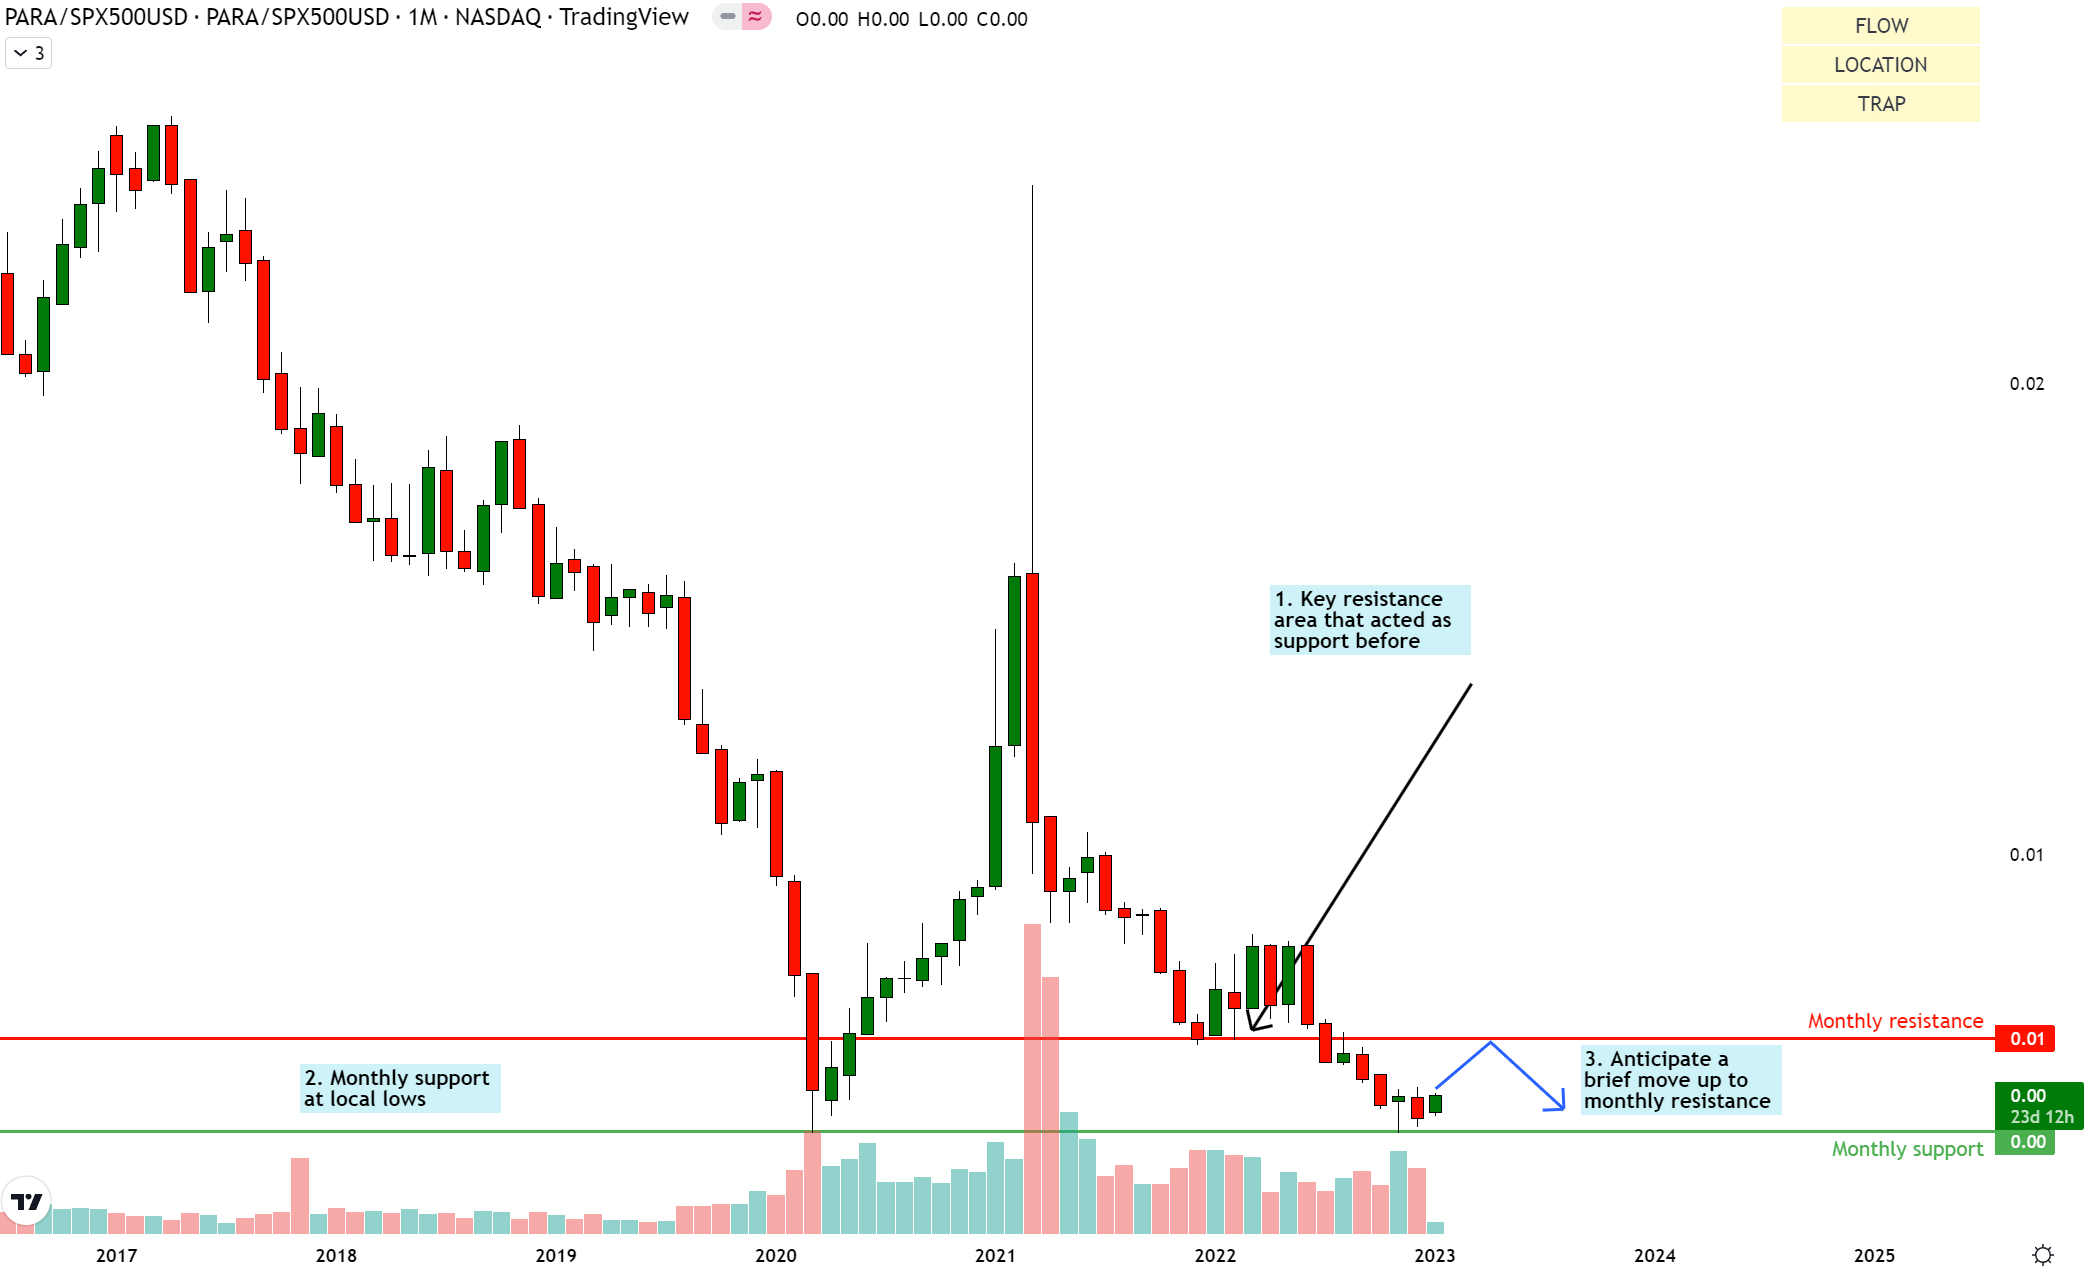
PARA vs SPX500 Technical Analysis (TradingView, Author’s Analysis)
On the relative chart of PARA and the S&P500 (SPY) (SPX), the sellers are slowing down and buyers are forming a base. I anticipate a move up to test the newly formed monthly resistance for the first time before another move down to establish a larger foundation for buyer consolidation.
Standalone Read of PARA
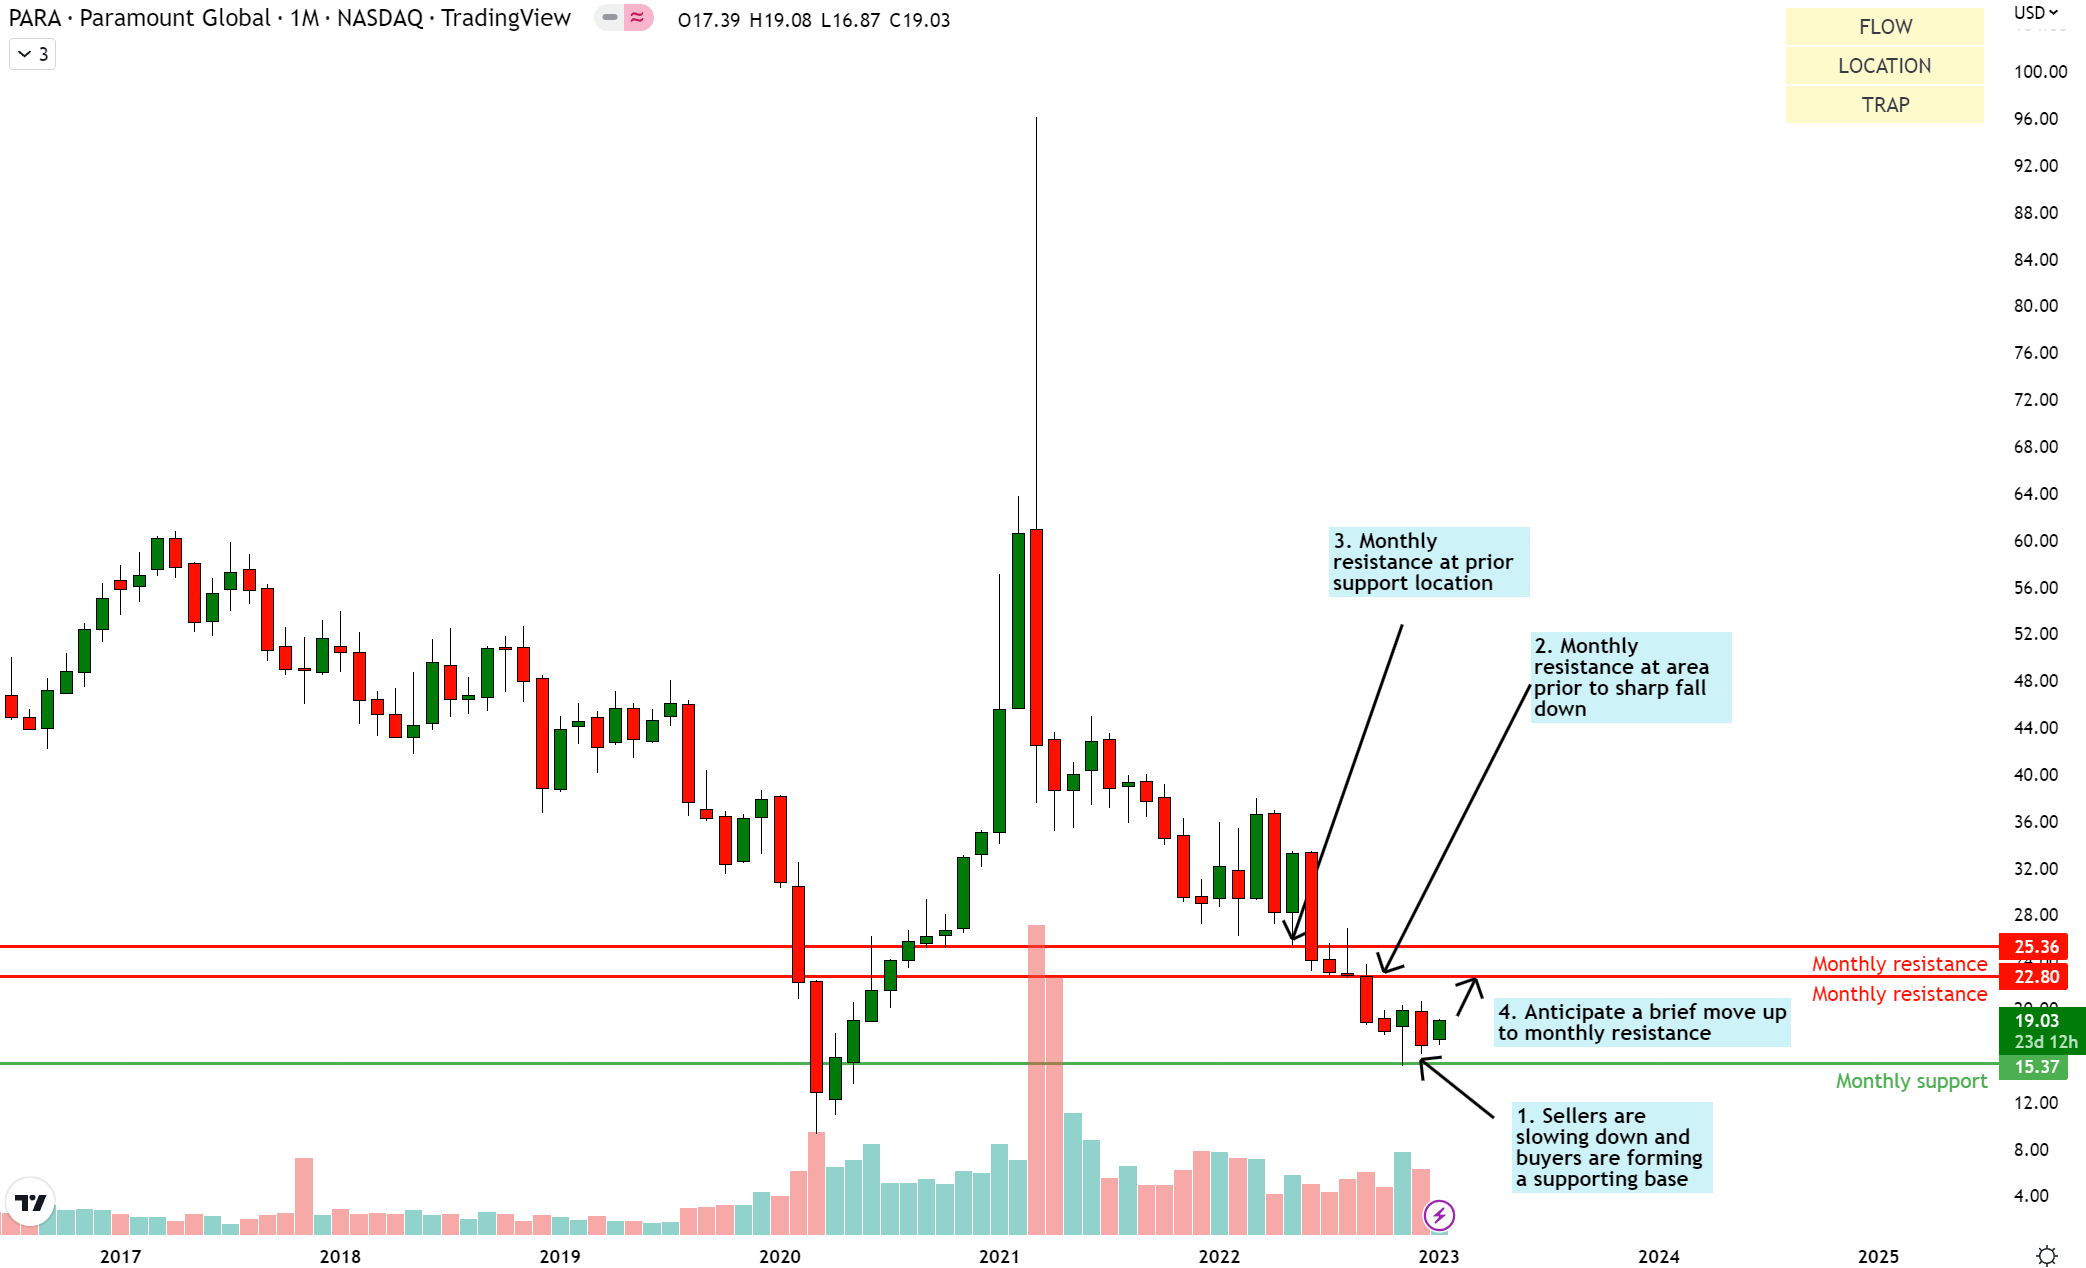
PARA Technical Analysis (TradingView, Author’s Analysis)
On the absolute chart of PARA, I see a similar structure where the sellers are slowing down in their descent and buyers are revving up to move up towards the monthly resistance at $22.80.
Key Monitorables
Recovery in the advertising market is a key monitorable, in addition to subscriber growth traction in DTC. I will also track margin performance closely to see if the incremental cost efficiency levers materialize.
Mixed Signals
Overall, I’m getting very mixed reads on Paramount; a weak advertising environment dragging down the core business, but good subscriber growth in DTC with margin levers on the horizon. Given this backdrop, the valuations seem stretched but the technicals lean bullish.
These contradictory signals reduces my confidence to take a directional bet on a buy. Hence, I opt to keep this on my watchlist until I see meaningful evidence of advertising spend improvement, or at least, realization of margin improvements.
Be the first to comment