

baona
Investment Thesis
Paramount Global (NASDAQ:PARA) has recovered by a miraculous 26.59% from the recent bottom in early November by no virtue of its own. The company recently reported an underwhelming FQ3’22 earnings call with top and bottom lines misses, continuing its mixed performance for the past few quarters.
The recovery is obviously attributed to the upbeat October CPI report, which triggered 75.8% of analysts to predict a potential Fed pivot by December. The recent optimism is already factored in by those who had observed the Bank of Canada’s recent moderation with a 50 basis points hike. Though terminal rates would also be raised to tamp down on the rising inflation, I suppose a market-wide recovery is rewarding enough after the tragic blood-bath witnessed since November 2021. After all, all this pessimism is already baked in, potentially triggering a slow but steady market revival ahead, lifting most boats up at the same time.
PARA Continues To Face Tremendous Margin Headwinds
PARA Revenue, Net Income ( in billion $ ) %, EBIT %, and EPS
S&P Capital IQ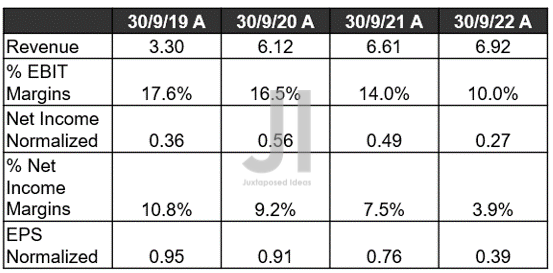
In its recent FQ3’22 earnings call, PARA reported revenues of $6.92B and EBIT margins of 10%, indicating another QoQ decline of -11.06% and -1.2 percentage points. Otherwise, a notable 4.68% increase though a fall of -4 percentage points YoY, respectively. Despite the management’s valiant efforts in managing cost efficiencies, expenses continued to increase by 9.68% YoY despite declining by -2.3% QoQ.
Thereby, impacting PARA’s profitability by the latest quarter, with a -37.06%, -1.6 percentage points, and -39.06% QoQ decline in its net income, net income margins, and EPS. Otherwise, a tragic -44.89%, -3.6 percentage points, and -48.68% YoY plunge, respectively. It is apparent that media companies are getting hammered, since WBD reported a similarly underperforming quarter recently. Thereby, triggering a -22.39% plunge in the days post-earnings calls, as also experienced by PARA at -18.98%, prior to the release of the October CPI report.
PARA Cash/ Equivalents, FCF ( in billion $ ) %, Debt, and Dividends
S&P Capital IQ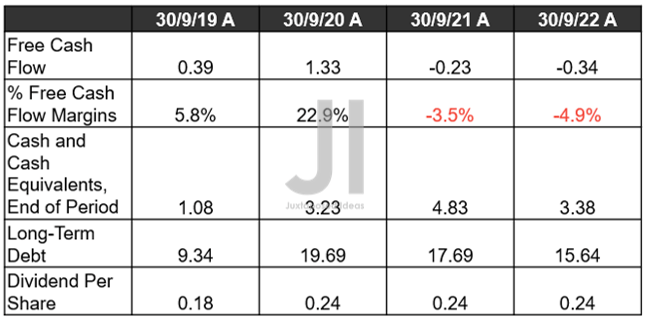
As a result, it is not a surprise that PARA reported negative Free Cash Flow (FCF) generation -$0.34B and FCF margins of -4.9% for FQ3’22. However, due to its aggressive restructuring efforts, the company has also reported “sizeable cost savings.” This may have aided the continued deleveraging efforts thus far, despite the minimal cash flow and elevated restructuring costs. By FQ3’22, the company reported total long-term debts of $15.64B, indicating a notable moderation of -11.58% YoY. Otherwise, an excellent -20.6% from peak debt levels of $19.7B in FQ4’20.
Impressive indeed, since the strategy has also contributed to PARA’s lower interest expenses of $942M by the latest quarter as opposed to $1.04B. Furthermore, its long-term debts are remarkably well-laddered through FY2062, with only $209M due by 2023 and $1.09B by 2024. That is one big difference to WBD’s current debt levels of $48.61B indeed. Thereby, freeing PARA’s immediate liquidity for its strategic restructuring process, despite the uncertain economic condition.
PARA Projected Revenue, Net Income ( in billion $ ) %, EBIT %, and EPS
S&P Capital IQ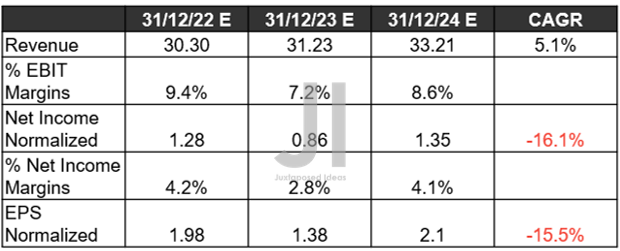
Over the next three years, PARA is expected to report revenue and EPS growth at a CAGR of 5.1% and -15.5%, respectively. Unfortunately, its EBIT and net income margins will continue to suffer as well, against pre-pandemic levels of 18.3% and 11.1%.
It is apparent that market analysts are uncertain about the success of PARA’s transition from Pay TV to the D2C segment, since the latter continues to report a minimal OIBDA margin of -27.97% in the latest quarter. Thereby, further draining the profits from its other segments, such as TV Media at OIBDA margins of 24.78% and filmed entertainment at 5.23%.
Other media companies are not delivering on their D2C segment as well, since DIS continues to report operating margins of -30% and WBD -27.4% in Q3’22. As pointed out by many other observers, it remains interesting how NFLX was able to deliver 19.3% at the same time, despite the intense competition. No wonder that Mr. Market continues to reward the market leader with an NTM P/E of 30.79x, despite the tragic -68.20% correction since November 2021.
PARA Projected FCF ( in billion $ ) %, Debt, and Dividends
S&P Capital IQ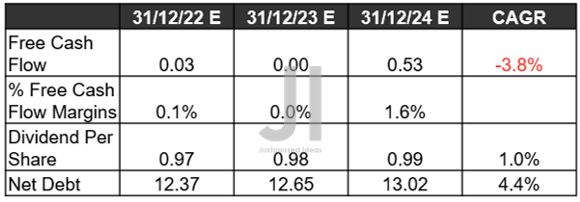
Though some investors were concerned about its dividend safety, market analysts are quietly optimistic that the PARA management will continue to pay out a more than decent yield ahead. The company has an excellent track record of 15 years of consecutive dividend payments, despite its elevated debt through the worst of the pandemic. In addition, those who had added PARA at the recent bottom would have enjoyed a speculative dividend yield of 6.38% by FY2024. Otherwise, still an acceptable 5.03% based on current stock prices. Not too bad indeed, since its net debt levels are expected to sustainably remain at these levels through peak recessionary fears in 2023.
So, Is PARA Stock A Buy, Sell, Or Hold?
PARA 5Y EV/Revenue and P/E Valuations
S&P Capital IQ
PARA is currently trading at an EV/NTM Revenue of 0.89x and NTM P/E of 13.18x, lower than its 5Y EV/Revenue mean of 1.56x though massively elevated from its 5Y P/E mean of 9.37x. Against its peers, such as Fox Corporation (FOXA) at 9.01x and Warner Bros. Discovery (NASDAQ:WBD) at -27.21x, the stock is also trading at a comparatively elevated P/E valuation, though somewhat reasonable if compared to Disney (DIS) at 23.57x and Netflix (NFLX) at 30.79x. However, it is also important to note that the other two companies deserve their premiums due to the success of their theme parks and D2C profitability, respectively.
PARA YTD Stock Price
Seeking Alpha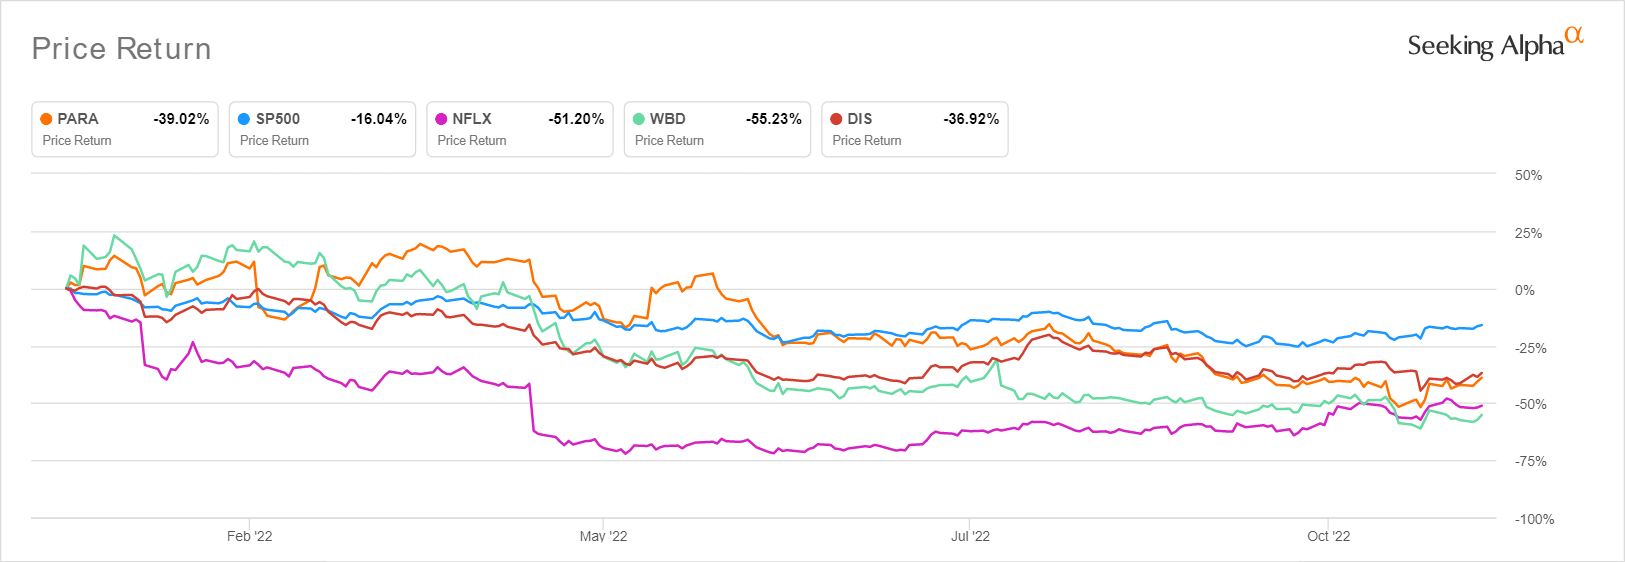
PARA is also trading at $19.66, down -49.85% from its 52 weeks high of $39.21, though at a premium of 28.58% from its 52 weeks low of $15.29. Nonetheless, the stock has also maxed out its potential from the consensus estimates’ price target of $19.60, despite trading at 2011 levels. Anyone who bought in ten or five years ago would have been disappointed with the minimal returns as well, at total price returns of -34.5% and -60.6%, respectively.
Combined with PARA’s uncertain profitability through FY2024, anyone who adds at this level will have a minimal margin of safety for portfolio growth ahead. One would be wiser to wait for another mid $10s, since the Feds will continue hiking rates through 2023 anyway. This optimism will be digested sooner or later, since the company will continue its underperformance over the next few quarters. Therefore, we rate PARA stock as a Hold for now.
Be the first to comment