

RHJ
Introduction
Vancouver-based Pan American Silver Corp. (NASDAQ:PAAS) released its second-quarter 2022 results on August 10, 2022.
Note: I have been covering PAAS regularly quarterly since June 2019. This article is an update of my preceding article published on May 24, 2022.
1 – 2Q22 results snapshot
PAAS reported a loss per share of $0.83 in the second quarter of 2022, or $173.98 million, missing analysts’ expectations, compared to an income of $0.34 a year ago.
Pan American Silver’s revenues were down 10.9% year-over-year to $340.47 million in 2Q22. The estimates for silver and gold production have been reaffirmed but are expected to be at the low end of the ranges, primarily due to the production shortfall at the Dolores mine.
PAAS 2Q22 Highlights Presentation (Pan American Silver)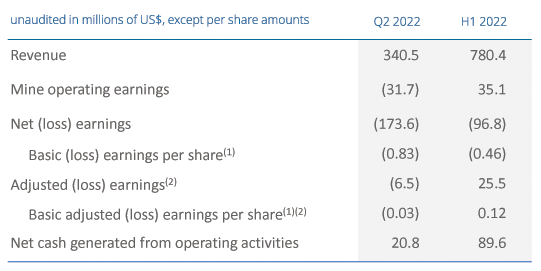
Michael Steinmann, President, and Chief Executive Officer, said in the conference call:
Gold production was 128,300 ounces in Q2. Despite lower-than-expected production at Dolores from Phase 9B, which also reduced consolidated silver production. Q2 gold production was within our expected range for the quarter. Dolores had a marked impact on our Q2 results. This stems from the shortfall in grades from Phase 9B and the resulting production year to date being less than expected, which triggered an analysis for impairment.
Revenues from gold represented approximately 56% of the total revenues in 1Q22. However, the total mineral reserves for silver are 48%, while gold is 29%. We can deduce that PAAS is more a “gold” miner than a silver miner. I will stay valid until Escobal mine starts to produce again.
2 – Investment Thesis
PAAS is an excellent long-term investment in the gold and silver segment, and it has not changed this quarter despite the Dolores hiccup.
PAAS has a solid balance sheet, with net cash of $241.26 million and substantial growth potential with the Escobal mine in Guatemala and the skarn project at La Colorada in Mexico. Mineral Reserves are significant, with P3 reserves of 3.6 Au Moz and 14.9 Ag Moz.
PAAS Reserves (Pan American Silver)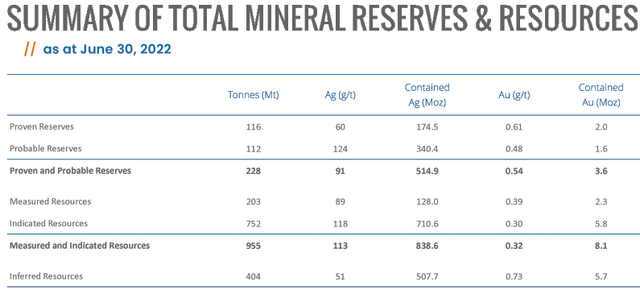
Furthermore, the Escobal mine is now on care & maintenance, waiting for approval of the mine.
Because of a highly volatile environment in the gold and silver sector, your investment in PAAS requires short-term trading using the LIFO method to turn it profitable and less risky.
The solution is to trade PAAS short-term LIFO using at least 50% of your entire position, while keeping a core long-term position for a much higher target.
This two-level strategy is recommended in my marketplace, “The Gold And Oil Corner,” and I believe it is the most rewarding way to profit. Sadly, only US investors can use LIFO. Please read my note at the end of this article.
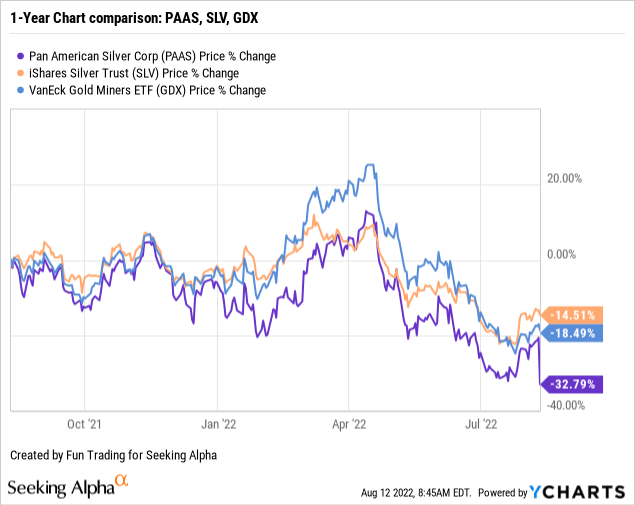
3 – Stock Performance: PAAS Took A Dive
PAAS suffered a steep selloff after releasing its second-quarter results, and is now down 33% on a one-year basis. PAAS is underperforming both iShares Silver Trust (SLV) and the VanEck Vectors Gold Miners (GDX).
PAAS – Balance Sheet And Production In 2Q22 – The Raw Numbers
| Pan American Silver | 2Q21 | 3Q21 | 4Q21 | 1Q22 | 2Q22 |
| Total revenue in $ Million | 382.13 | 460.35 | 422.17 | 439.89 | 340.47 |
| Net income in $ Million | 70.94 | 20.25 | 14.04 | 76.52 | -173.98 |
| EBITDA $ Million | 170.16 | 159.11 | 120.10 | 173.69 | -91.42* |
| EPS diluted in $/share | 0.34 | 0.10 | 0.07 | 0.36 | -0.83 |
| Operating cash flow in $ Million | 87.14 | 157.02 | 118.10 | 68.76 | 20.84 |
| CapEx in $ Million | 63.17 | 62.19 | 70.15 | 61.45 | 71.80 |
| Free cash flow in $ Million | 23.97 | 94.83 | 47.95 | 7.30 | -50.97* |
| Total cash $ Million | 240.37 | 315.45 | 335.27 | 326.29 | 241.26 |
| Total debt in $ Million | 47.70 | 44.98 | 45.86 | 47.05 | 63.22** |
| Dividend per share in $ | 0.10 | 0.10 | 0.12 | 0.12 | 0.11 |
| Shares outstanding (diluted) in Million | 210.30 | 210.42 | 210.45 | 210.55 | 210.51 |
| Gold/Silver Production | 2Q21 | 3Q21 | 4Q21 | 1Q22 | 2Q22 |
| Gold production K Oz | 142.3 | 142.6 | 156.7 | 131.0 | 128.3 |
| Silver production M oz | 4.484 | 4.831 | 5.276 | 4.619 | 4.537 |
| AISC $/Oz by-product Silver | 16.36 | 16.30 | 13.57 | 13.41 | 17.30 |
| Gold price realized $/Oz | 1,809 | 1,782 | 1,792 | 1,880 | 1,850 |
| Silver price realized $/Oz | 26.88 | 24.16 | 23.33 | 24.03 | 22.03 |
Data Source: Company filings
* Estimated by Fun Trading
** Total debt is calculated as the total current and non-current portions of long-term debt, finance lease liabilities, and loans payable.
Part 1 – Silver And Gold Production Details For The First Quarter Of 2022
1 – Total Gold/Silver production
1.1 – Quarterly production was 128.3K Au Oz and 4,537K Ag Oz
PAAS Quarterly Gold and Silver production history (Fun Trading)
Operations at our flagship asset, La Colorada, have improved significantly, with silver production rising to approximately 1.7 million ounces in Q2.
However, Pan American’s Q2 results were markedly impacted by the underperformance at Dolores and our determination that recording an impairment of this asset was required.
We continue to expect consolidated production to be weighted to the back half of 2022, especially for the Gold Segment due to mine sequencing at Shahuindo and La Arena.
1.2 – Details per mine below
PAAS Quarterly Production per mine in 2Q22 (Fun Trading)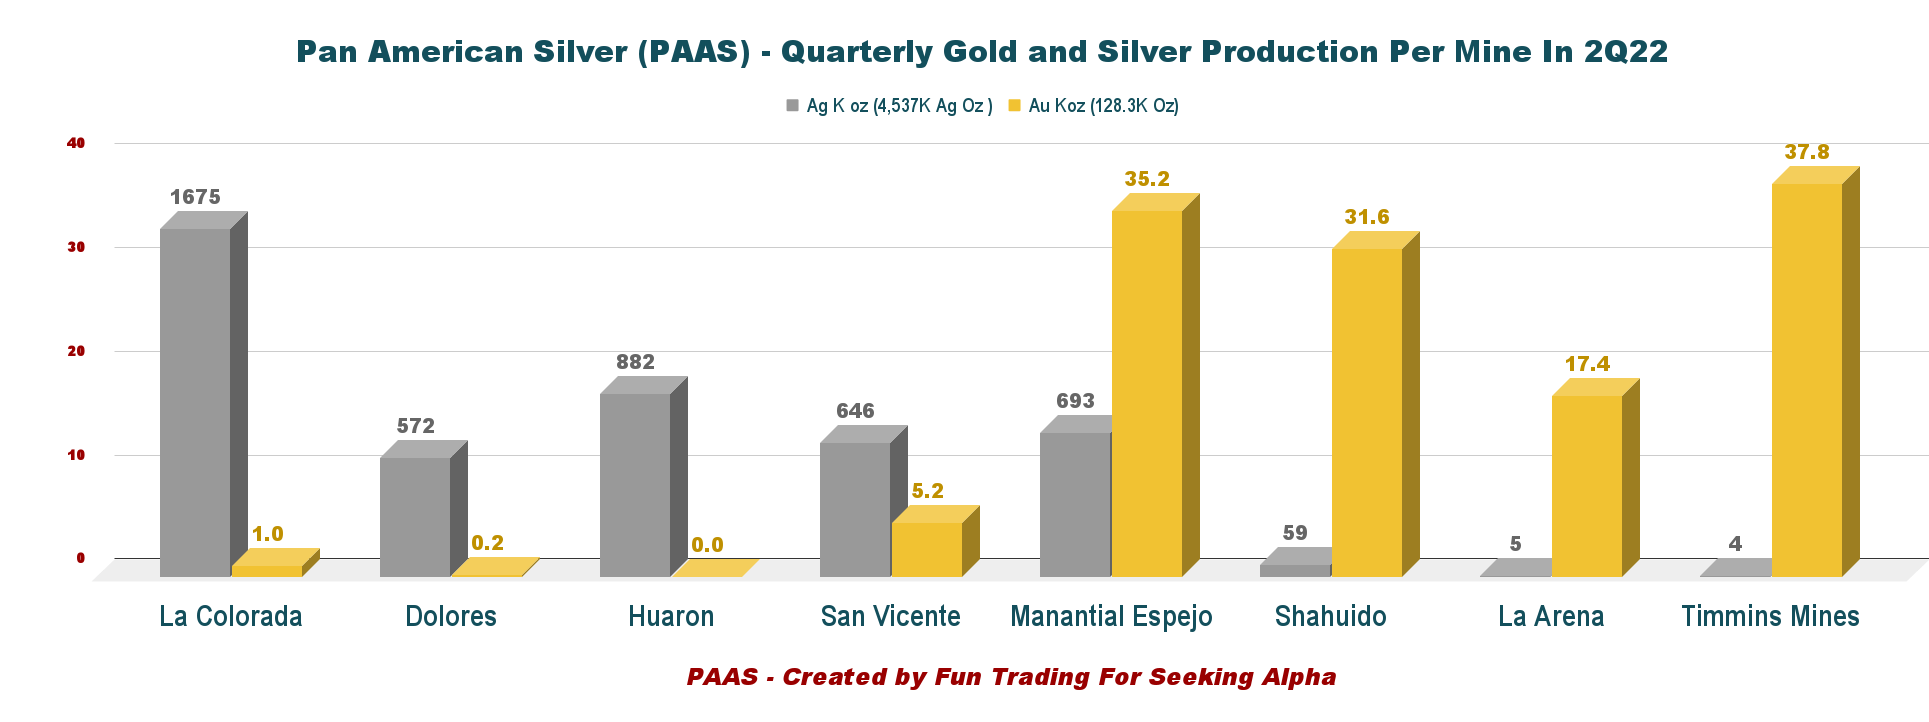
1.3 – The company produced zinc, lead, and copper, as indicated below
PAAS Quarterly Co-product 2Q22 (Fun Trading) PAAS AISC Ag and Au 1Q22 versus 2Q22 (Fun Trading)

1.4 – The Contingent Value Right (CVR) trading under PAASF.
The contingent value right is attached to the Escobal mine’s uncertain re-opening. Progress is slow but looks positive. I think this process will take about a year and a half before the company can restart the silver mine, but I have no doubt it will reopen. Hence, patience is required.
CEO Michael Steinmann said in the conference call:
At Escobal, the ILO 169 consultation has now progressed to the consultation phase from pre-consultation with the next meeting scheduled for August 21. We look forward to participating in the next phase of the consultation process and listening to the Xinka people regarding their perceptions of that Escobal in an open, inclusive and respectful process.
Below is the TA Chart:
PAASF TA Chart short-term (Fun Trading)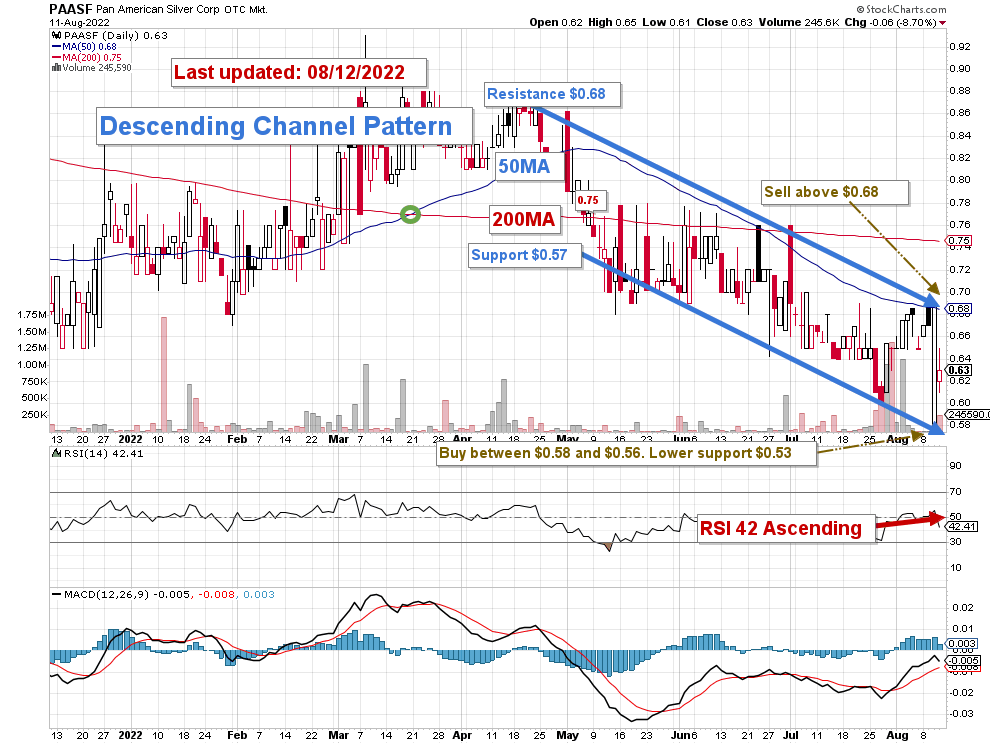
2 – Updated 2022 Guidance
The company reaffirms its 2022 operating outlook for silver and gold production. The company expects 19.0 Moz-20.5 Moz for silver and 550K-605K Oz for gold. It was no change from the preceding quarter, but now the company indicates that it will reach only the lower range of the guidance.
Silver segment cash costs are anticipated to be $10.7-$12.20 per Ag ounce, and AISC for silver is $14.50-$16.00. For the gold segment, AISC increased between $1,450 and $1,550 per ounce.
PAAS Updated 2022 Guidance (Pan American Silver)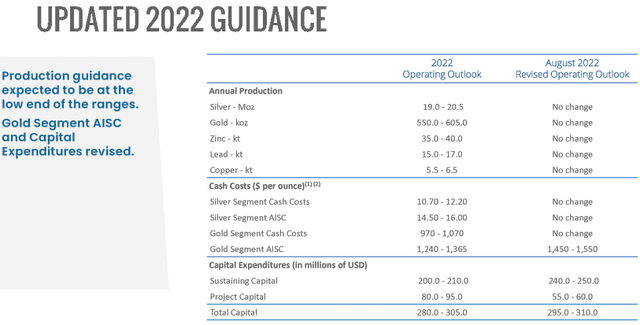
Part 2 – Pan American Silver: Financial Analysis
1 – Total revenue was $340.47 million in 2Q22
PAAS Quarterly revenues history (Fun Trading)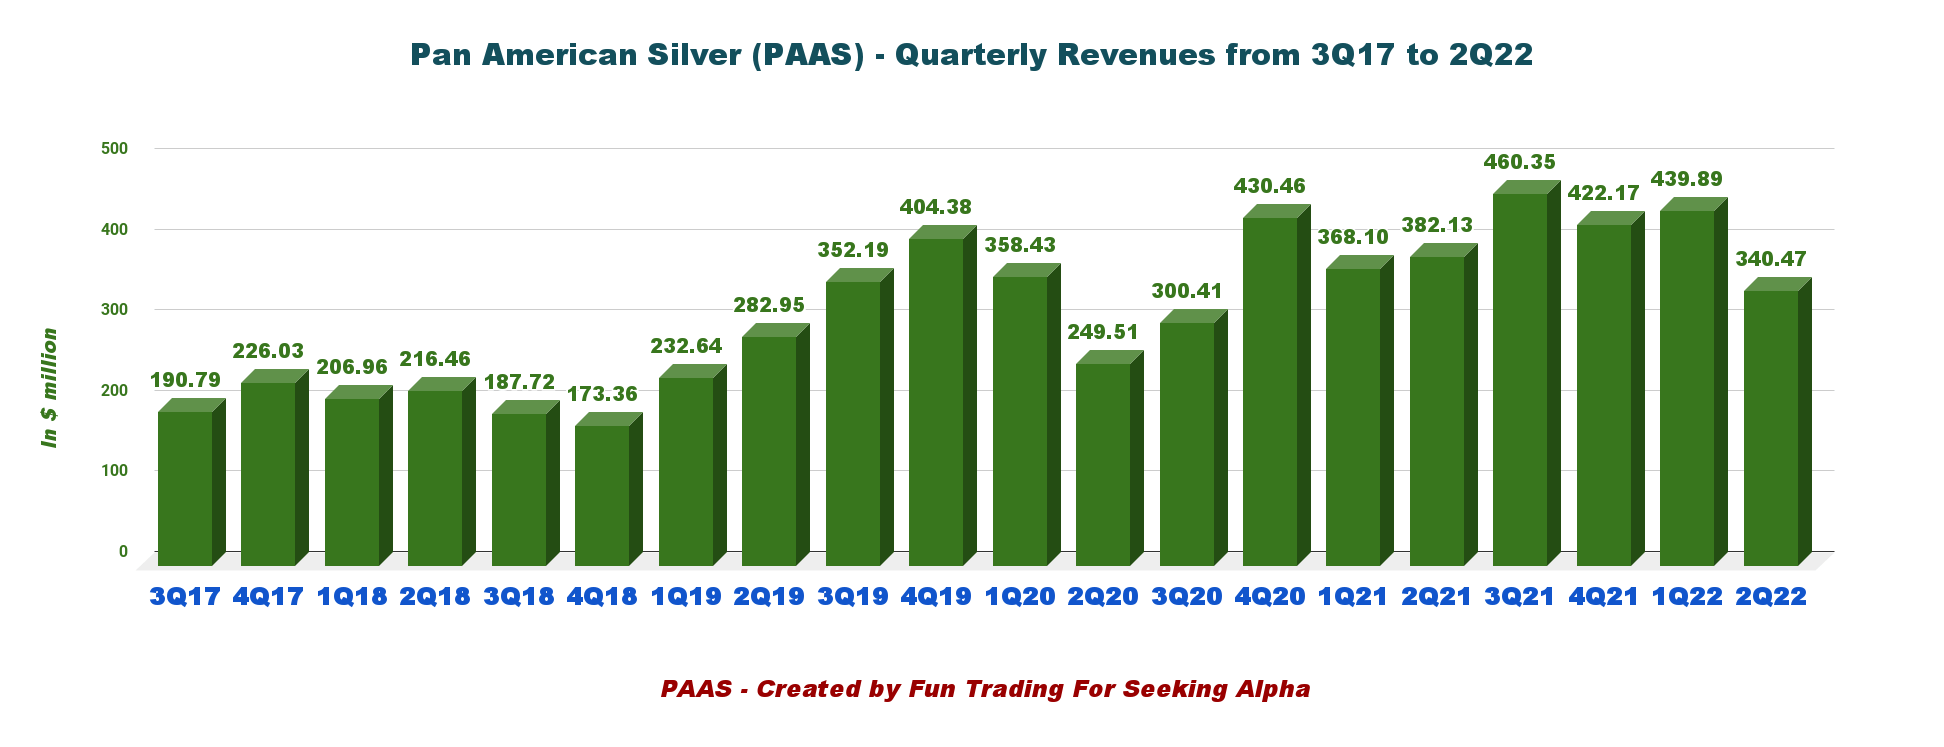
The Canadian company reported a second-quarter loss of $173.98 million ($0.83 earnings per diluted share).
Revenues were $340.47 million in 2Q22, down from last year’s same quarter. The adjusted loss was $6.5 million or $0.03 basic adjusted earnings per share, compared to an income of $46.6 million or $0.22 per share last year.
The company recorded a loss of $244.9 million quarter-over-quarter decrease:
- a $99.1 million impairment charge to the Dolores mine assets
- a $134.7 million decrease in mine operating earnings from the previously described lower revenue and higher production costs, as well as increased depreciation. Included in higher production costs is a $70.0 million negative variation in quarter-over-quarter NRV inventory adjustments, largely related to a writedown of inventory on the heap as part of the new life of mine update for Dolores
- an $18.3 million negative investment loss variance, reflecting a Q2 2022 loss of $7.7 million compared with income of $10.6 million in Q2 2021, primarily due to the fair value mark-to-market adjustments on short-term investments in equity securities, largely New Pacific Metals Corp.
- and a $10.9 million negative variance from lower gains and income from associates, lower gains on sale of mineral properties, plant and equipment, and higher foreign exchange losses
- These factors were partially offset by a $22.7 million decrease in income tax expense, primarily due to the quarter-over-quarter decrease in income before tax of $267.6 million
2 – Free cash flow was a loss estimated at $50.97 million in 2Q22
PAAS Quarterly Free cash flow history (Fun Trading) Note: Generic free cash flow is the cash flow from operation minus CapEx.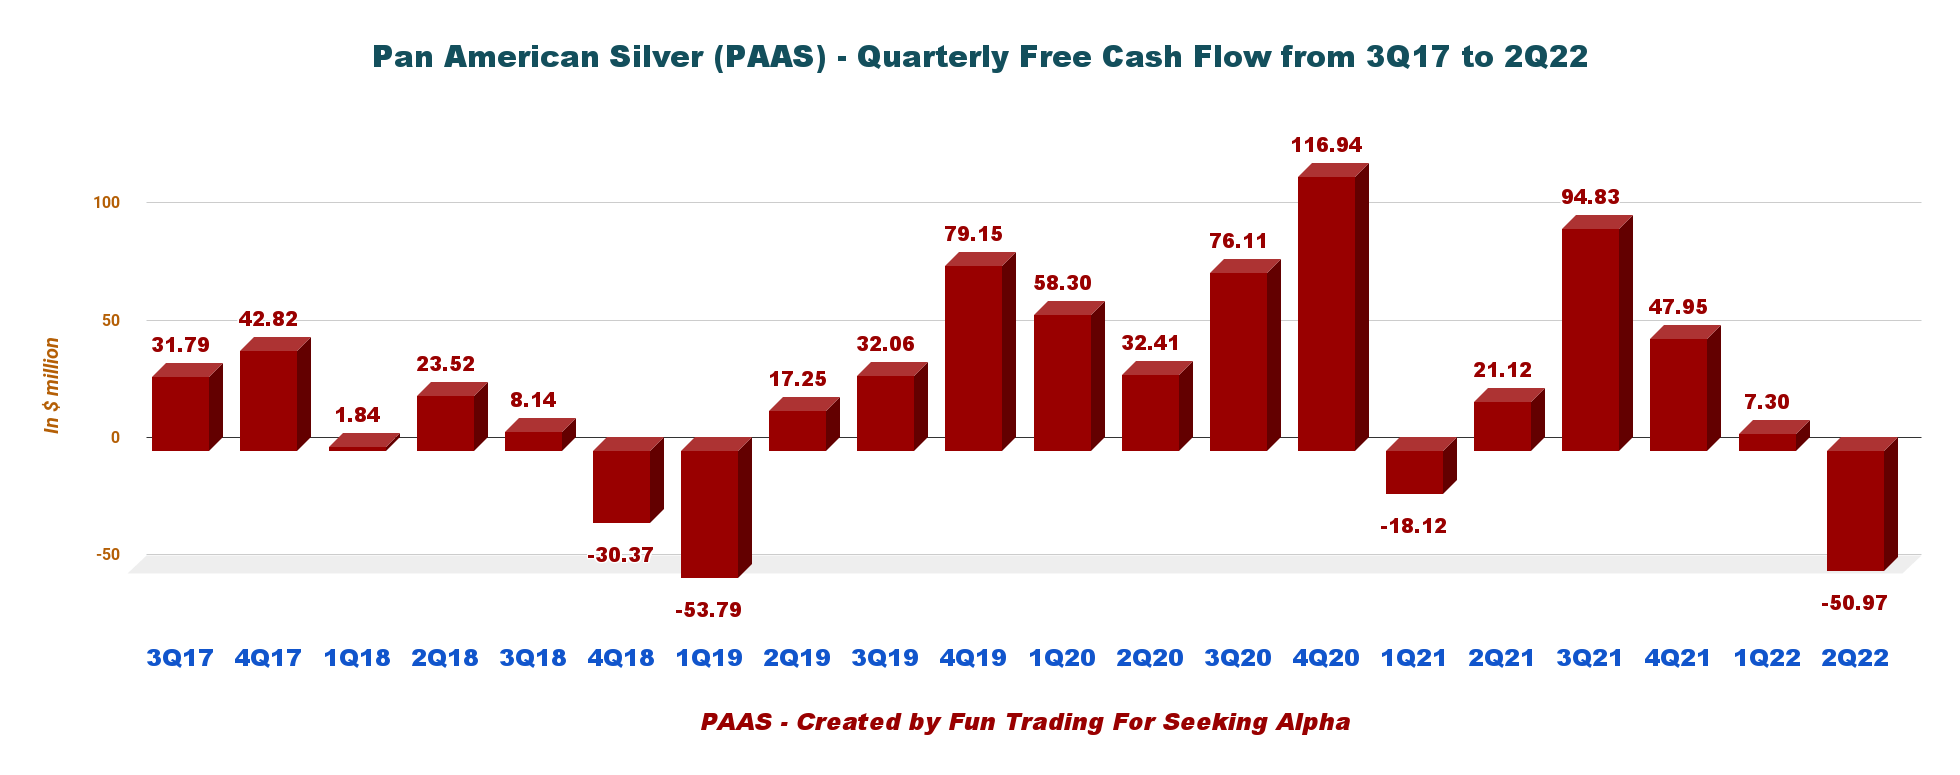
Trailing 12-month free cash flow is $99.11 million, with a loss estimated at $50.97 million in the second quarter of 2022.
The Board of Directors has approved a cash dividend of $0.11 per common share in 2Q22.
The company uses 27% of its free cash flow to pay a dividend and another 8% for a share buyback program.
This quarter the dividend went slightly down from $0.12 per share to $0.11 per share. See below the repartition.
PAAS Free cash flow distribution Presentation (Pan American Silver)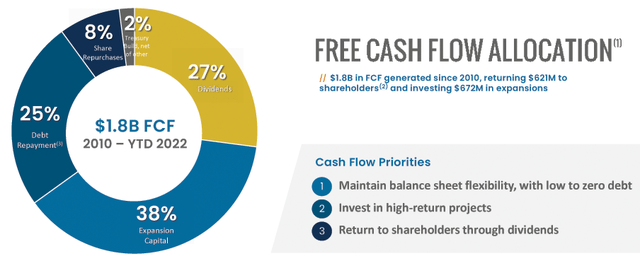
3 – PAAS is net debt-free. Total cash is $241.26 million in 2Q22. Good profile.
PAAS Quarterly Cash versus Total debt history (Fun Trading)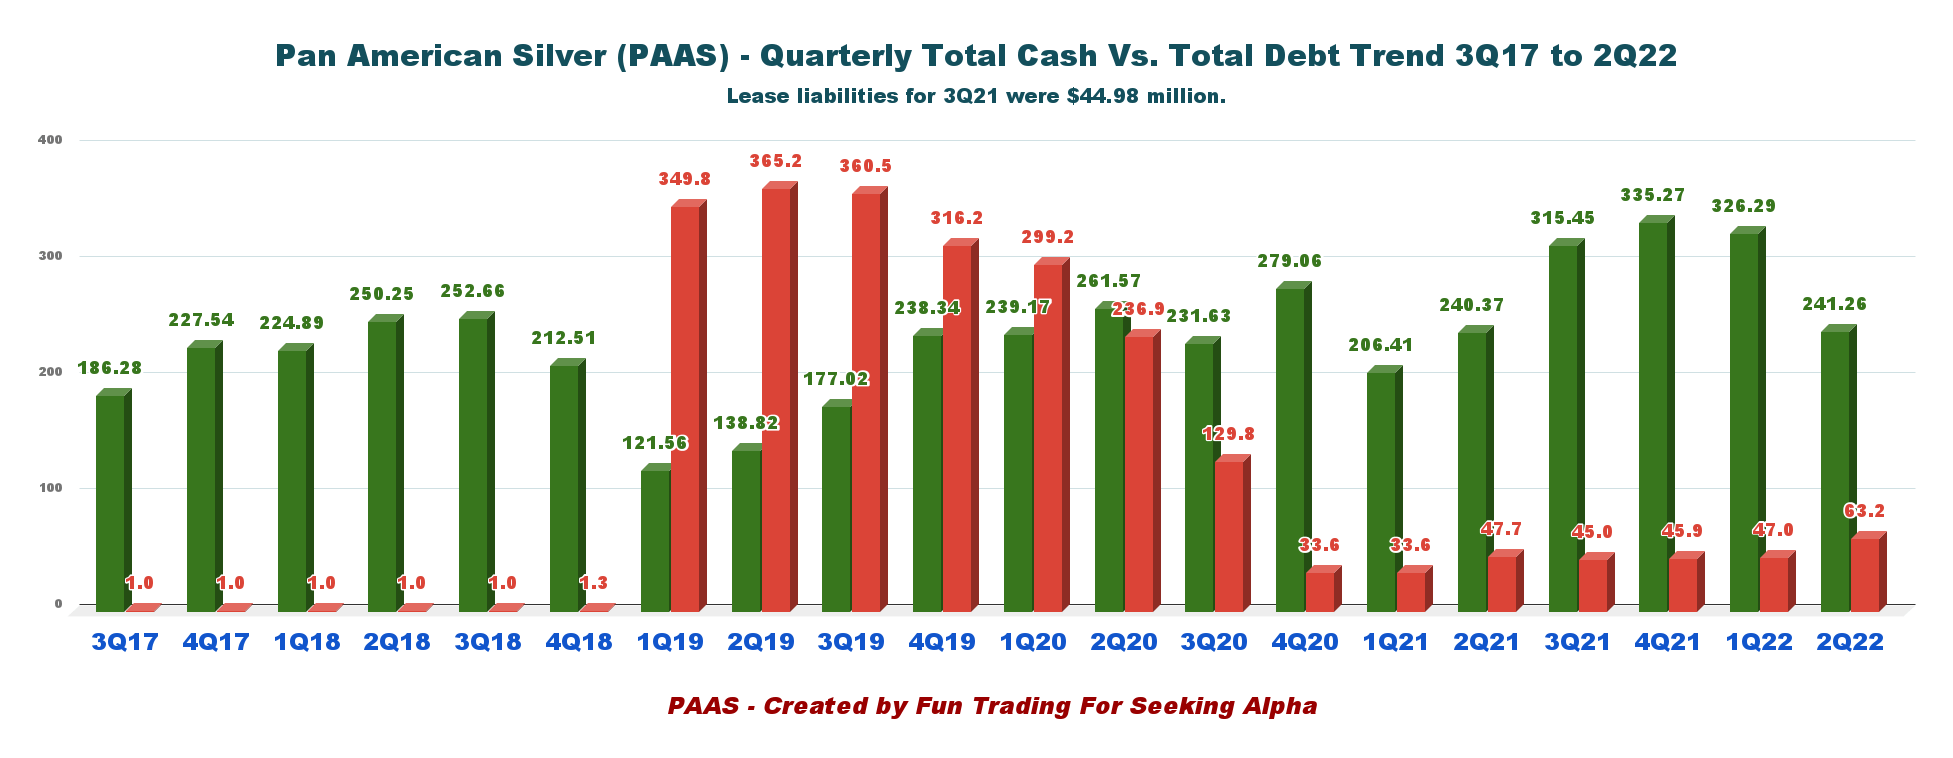
As of June 30, 2022, the company had cash and short-term investment balances of $241.26 million. The total debt, including equipment leases, is $63.22 million. Available liquidity is down this quarter to $741.3 million.
PAAS has $500.0 million available under its revolving credit facility.
PAAS Balance sheet presentation 2Q22 (Pan American Silver Presentation)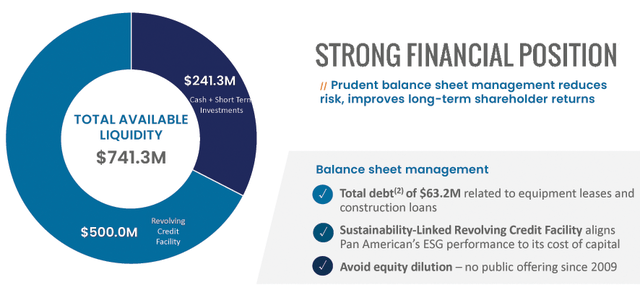
Note: Investment in Maverix was $112.472 million as of June 2022.
Part 3 – Technical Analysis And Commentary
PAAS TA Chart short-term (Fun Trading)
Note: The chart is adjusted for the dividend.
PAAS forms a descending channel pattern with resistance at $21.0 and support at $17.75. The strategy is to trade about 50% of your position LIFO and keep a core long-term for $30 and above.
I recommend accumulating PAAS at or below $18.5 and selling about 20% of your position starting at $20.4 (50MA) and gradually selling to $21.5.
If the gold price turns bullish in the next few weeks, PAAS could eventually reach $23.6. It will depend mainly on the FED’s decision.
Conversely, If the gold price turns bearish and falls below $1,725 per ounce, the next lower support is $16.75.
Watch gold and silver prices like a hawk.
Note: The LIFO method is prohibited under International Financial Reporting Standards (IFRS), though it is permitted in the United States by Generally Accepted Accounting Principles (GAAP). Therefore, only US traders can apply this method. Those who cannot trade LIFO can use an alternative by setting two different accounts for the same stock, one for the long term and one for short-term trading.
Warning: The TA chart must be updated frequently to be relevant. It is what I am doing in my stock tracker. The chart above has a possible validity of about a week. Remember, the TA chart is a tool only to help you adopt the right strategy. It is not a way to foresee the future. No one and nothing can.
Author’s note: If you find value in this article and would like to encourage such continued efforts, please click the “Like” button below as a vote of support. Thanks.
Be the first to comment