

RomoloTavani/iStock via Getty Images
Q2 recap and thesis
Both Palantir (NYSE:PLTR) and The Trade Desk (NASDAQ:TTD) reported their Q2 earnings earlier this month. The results for PLTR were somewhat mixed. Topline grew 26% YoY. While the bottom line remained negative for yet another quarter (a negative $0.01 EPS). TTD’s results are more upbeat. Its topline grew to $376M, a spectacular 34% YoY and also beating consensus estimates by more than $11. The bottom line dialed in at $0.20 as consensus estimates expected.
The market responded with a stark bifurcation as you can see from the following chart. TTD’s share prices surged by more than 10% after the earnings report (“ER”). And despite the correction in recent days, its stock prices are still about 12% higher since the ER as of this writing. In contrast, PLTR’s stock prices have been under pressure since the ER and are about 12% lower since the ER.
Seeking Alpha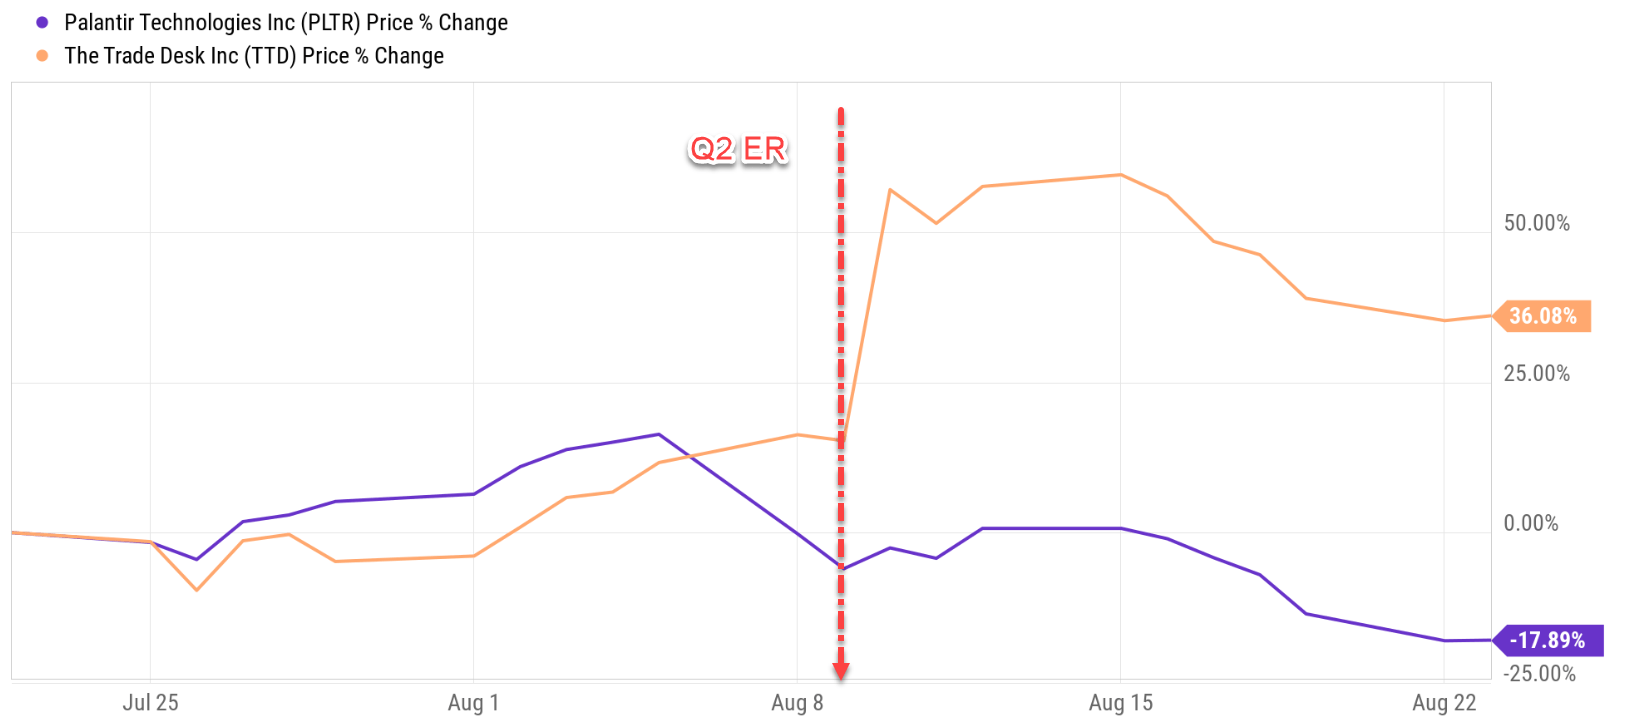
Besides the above Q2 results and market responses, they are other differences in their fundamentals too. Even though both run a software business, PLTR’s main focus is software platforms for the intelligence community with government agencies as its main customers, while TTD’s main focus is software platforms to enable corporate customers to manage and optimize their digital advertising campaigns. These differences have been thoroughly discussed in other SA articles already (and some of my own too) and I won’t further add on here.
Instead, the thesis of this article is to focus on the similarities, especially the similarities of these financials under the surface of the Q2 bifurcation. Both companies have been enjoying high growth rates in the past (at least in terms of revenues) and they kept growing these topline at rapid rates in Q2 (in the range of 26% to 34% YoY). And their current market valuations are still expecting high growth rates ahead too for both of them as you can see from the table below. PLTR’s FY1 PE is currently 148x and TTD is 64x.
Such elevated valuations reflect another similarity between these two stocks (and other high-growth SaaS stocks too): the difficulty to price their growth. For example, in terms of the TTM earnings, PLTR is still in the red as aforementioned, hence the TTM PE is not even applicable. And for TTD, its TTM PE on a Non-GAAP basis is about 63x and PE on GAAP basis is in the range from 792x to 913x, not that meaningful.
And the reminder of this article will show a method to value their projected growth by adjusting the growth CAPEX. And you will see another hidden similarity once this adjustment is performed. Their valuations are actually quite similar (67.3x vs 61.5x as shown below) based on their owners’ earnings (“OE”).
Seeking Alpha
Palantir and The Trade Desk: not all CAPEX are expenses
Readers familiar with our writings know that not all CAPEX spendings are not costs. Part of the CAPEX spending is cost (the maintenance part) and the remainder is growth CAPEX. The growth CAPEX should not be considered a cost. It should be added back to the accounting earnings to calculate the owners’ earnings. For more mature businesses like Google (GOOG), the maintenance part typically represents the majority of the total CAPEX expenses. And as a result, the owners’ earnings are typically not that different from the accounting earnings. For example, in GOOG’s case, my estimate is that its owners’ earnings are higher than its accounting earnings by about 20% to 30%. And thus, its PE based on owners’ earnings would be about 20% to 30% lower than its nominal PE and my estimate is around 17.6x.
However, for high-growth stocks like PLTR and TTD, the above concepts could make a much larger difference because the majority of their CAPEX expenses are growth expenses. As we will see next.
To fuel their growth, both PLTR and TTD have been spending aggressively on CAPEX in the past as summarized in the chart below. The top panel of the chart shows PLTR CAPEX spending in the past few quarters. Its CAPEX expenditures have been on average around $1M on a quarterly basis during 2020 and 1H of 2021. And then it surged to over $5M in later 2021 and then over $15M in Q1 of 2022. Its recent ER reported a CAPEX expenditure of $5.45M, a large decline sequentially, but still a pretty high level compared to 2 years ago.
The picture for TTD is quite similar as seen in the bottom panel. It has been ramping up its CAPEX expenditures in recent quarters rapidly too to accommodate its growth. Its CAPEX expenditures have been on average around $8M on a quarterly basis during 2018 and 2019. And then it surged to the $20M level starting in 2020 and peaked at over $25M in Q3 of 2021. Its recent ER reported a CAPEX expenditure of $5.75M, a large decline compared to its peak value. But still, a quite substantial amount especially when compared to its accounting earnings.
Seeking Alpha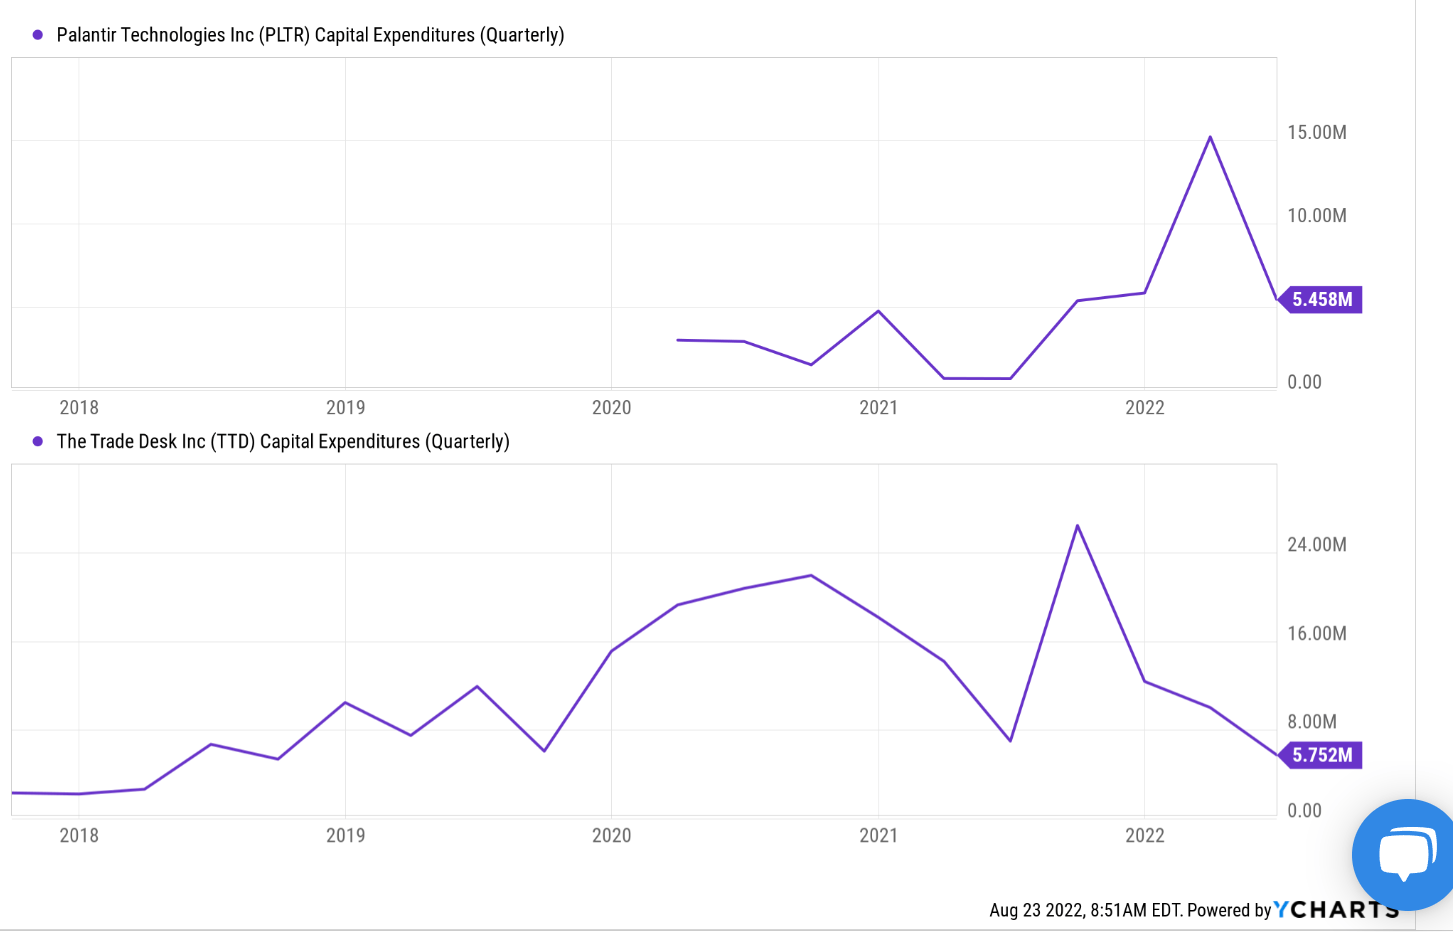
It remains to be seen whether their CAPEX requirements have peaked and if the relatively lower expenditures reported in Q2 2022 are the new norm. But what’s certain to me is that as software businesses, neither TTD nor PLTR needs to spend too much on maintenance CAPEX and a large portion of the above CAPEX expenditures is for growth. As you can see from the chart below, if we approximate its maintenance CAPEX with total depreciation and amortization, then PLTR’s maintenance CAPEX cost is only on average about $4M per quarter in recent quarters, and TTD’s maintenance CAPEX cost is only on average about $10M in recent quarters.
And next, we will quantify the implications of such growth CAPEX.
Seeking Alpha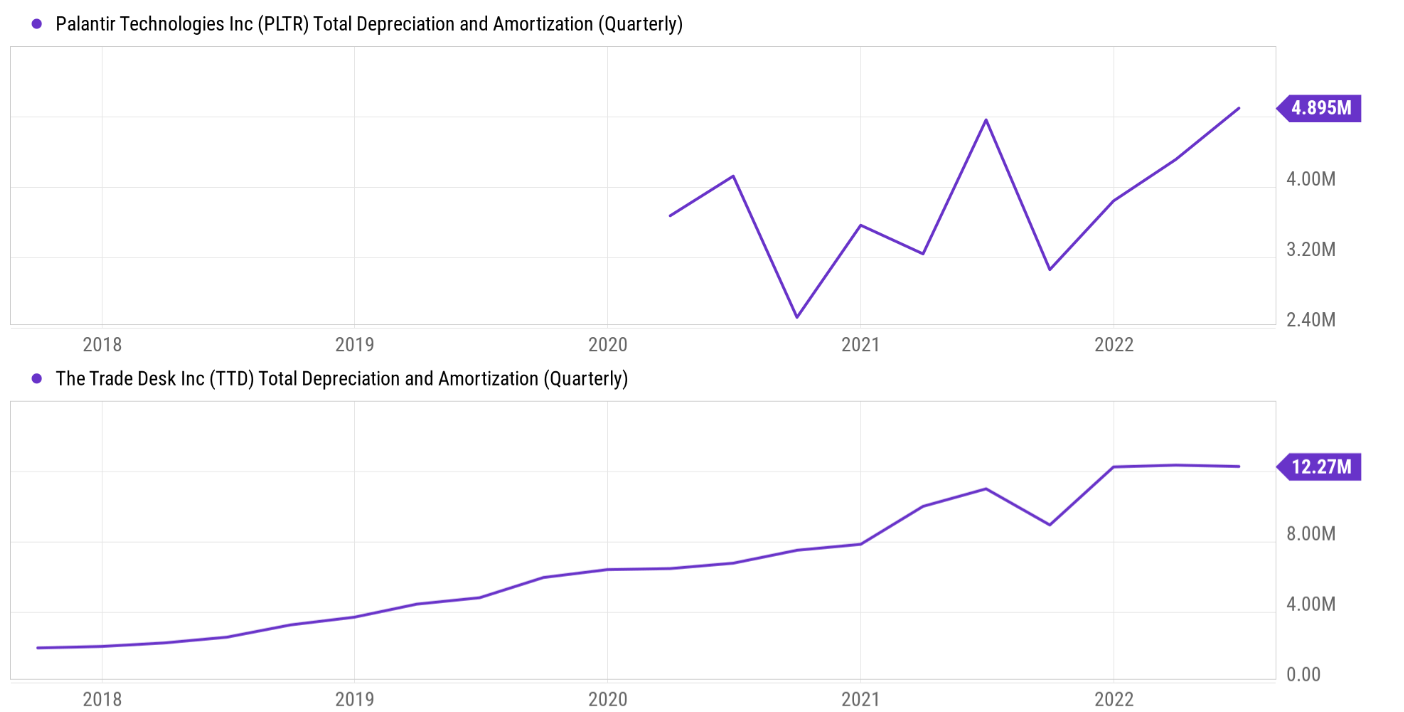
PLTR and TTD: the growth CAPEX
As a quick and dirty approximation, we can just take the total depreciation and amortization (“D&A”) as the maintenance CAPEX. And the difference between the total CAPEX and the D&A would be the growth CAPEX. We can then add the growth CAPEX back to the accounting earnings to obtain the OE.
I will skip this relatively simple analysis here and use a more thorough approach (the so-called Bruce Greenwald’s approach. The details of the approach are provided in my earlier article on AAPL and/or Greenwald’s book entitled Value Investing. A brief summary is provided below:
First, calculate the ratio of PPE (properties, plants, and equipment) to sales for each of the five prior years and find the average. We use this to indicate the dollars of PPE it takes to support each dollar of sales. We then multiply this ratio by the growth (or decrease) in sales dollars the company has achieved in the current year. The result of that calculation is growth CAPEX. We then subtract it from total CAPEX to arrive at maintenance CAPEX.
Using this approach, the key results for TTD are shown below in the following two charts.
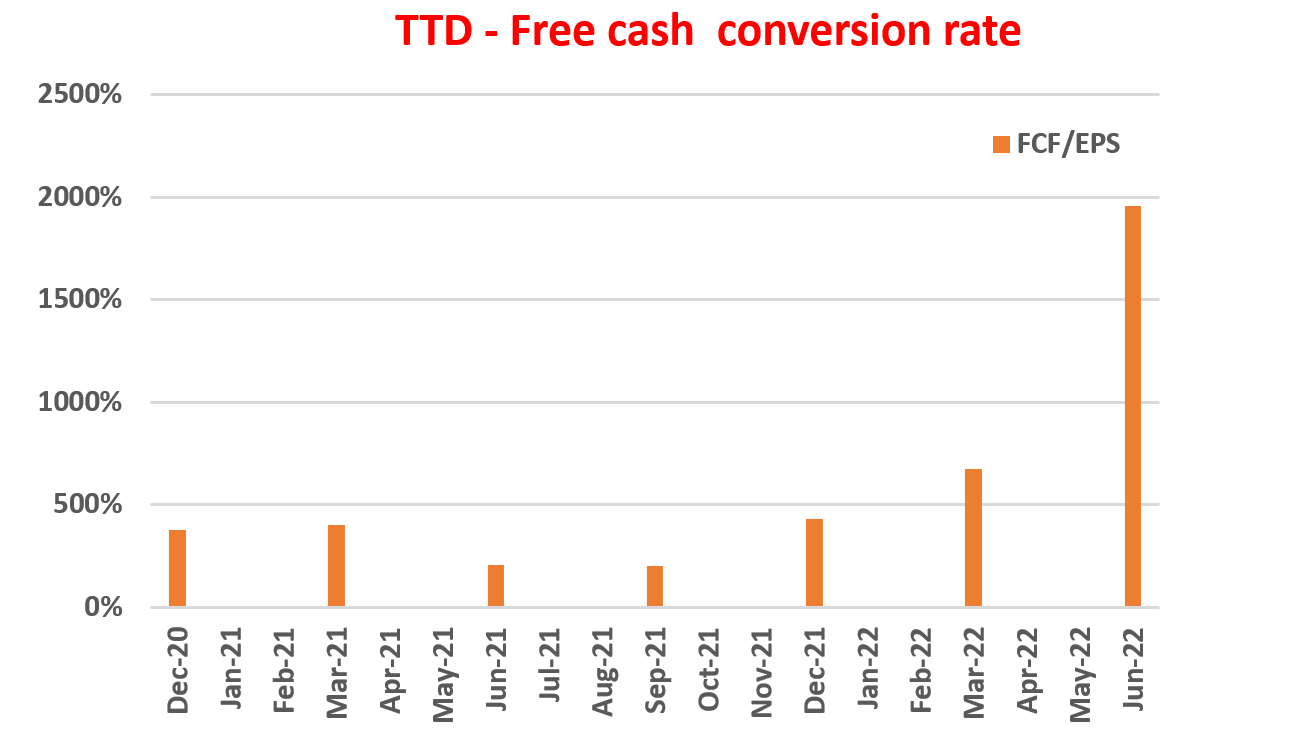
As shown, TTD’s owners’ earnings have been systematically higher than both its accounting EPS and its FFC in the past. As of TTM 2022, its owners’ earnings are about $1.04 per share, far above its accounting EPS of $0.05 per share. Even when compared to its free cash flow of $0.98 per share, its OE is about 6% higher. We probably can already appreciate the discrepancy between true economic earnings and accounting earnings by simply comparing the free cash flow and accounting EPS. Their conversion ratio is shown in the second chart below. And you can see that the FCF to EPS conversion ratio was more than 500% in the past quarter and almost 2000% this quarter.
As a result, TTD’s true valuation is not as high as it seems on the surface (recall that its PE is in the range of 700x to 900x on GAAP metrics).
Author Author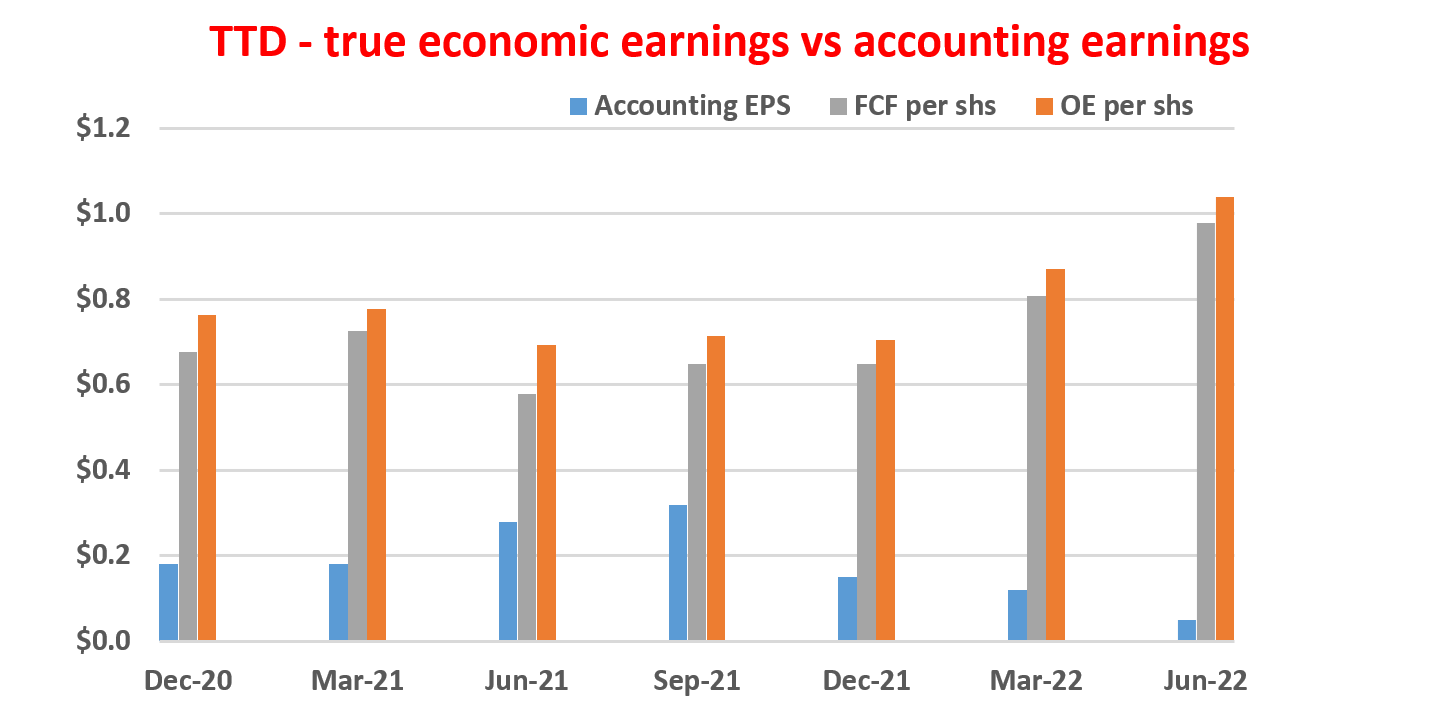
The picture for PLTR is quite similar, as shown in the next figure below. The figure again shows a comparison of the accounting EPS, the OE, and the free cash flow on a TTM basis. As we already know, its accounting EPS remains in the red, although its free cash flow has turned positive since the March quarter of 2021. And currently, it stands around $0.11 per share. And its true economic earnings are even better than its free cash flow. As an illustration, consider the most recent quarter. According to my estimate, its OE for the trailing 12 months was around $0.12 per share. The accounting EPS, in comparison, is a negative $0.10 per share. Additionally, the FCF is around $0.11 per share, which is about 10% less than its OE.
As a result, its valuation would be also lower than what is on the surface, as to be detailed next.
Author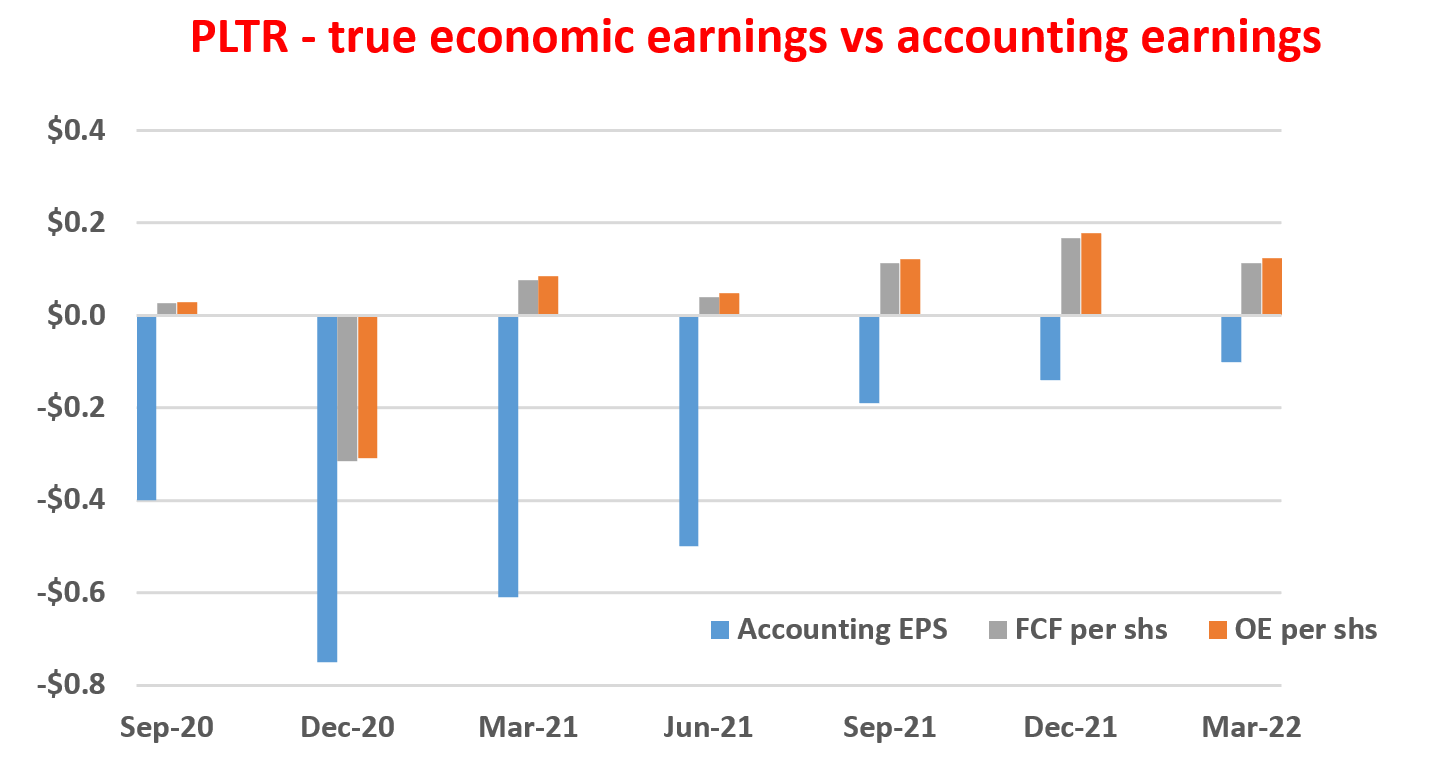
PLTR and TTD: Summary
This brings us back to the following table that opened this article. To summarize, due to their small or negative accounting EPS, the commonly quoted PE ratios are not too meaningful here.
However, once we value them based on the OE as analyzed above, we can see that their valuations are quite in-line with each. PLTR’s PE based on its TTM OE is about 67.3x and TTD about 61.5x. Also as aforementioned, GOOG’s OE is about 20% to 30% higher than its accounting earnings, and as a result, its PE based on OE would be about 17.6x.
In other words, the market is pricing both PLTR and TTD at about 3x to 4x premium compared to GOOG (3.8x for PLTR and 3.5x for TTD to be more exact). To me, this implies that the marketing is expecting both to grow at a pace 3x to 4x faster than GOOG (or the other mature SaaS-oriented businesses). Assuming a 10% annual growth rate for GOOG-like businesses, the market is expecting PLTR and TTD to grow at about 35% to 40% CAGR. To me, such implied growth rates are not entirely impossible, but it is a quite aggressive assumption and leaves little margin of safety.
Seeking Alpha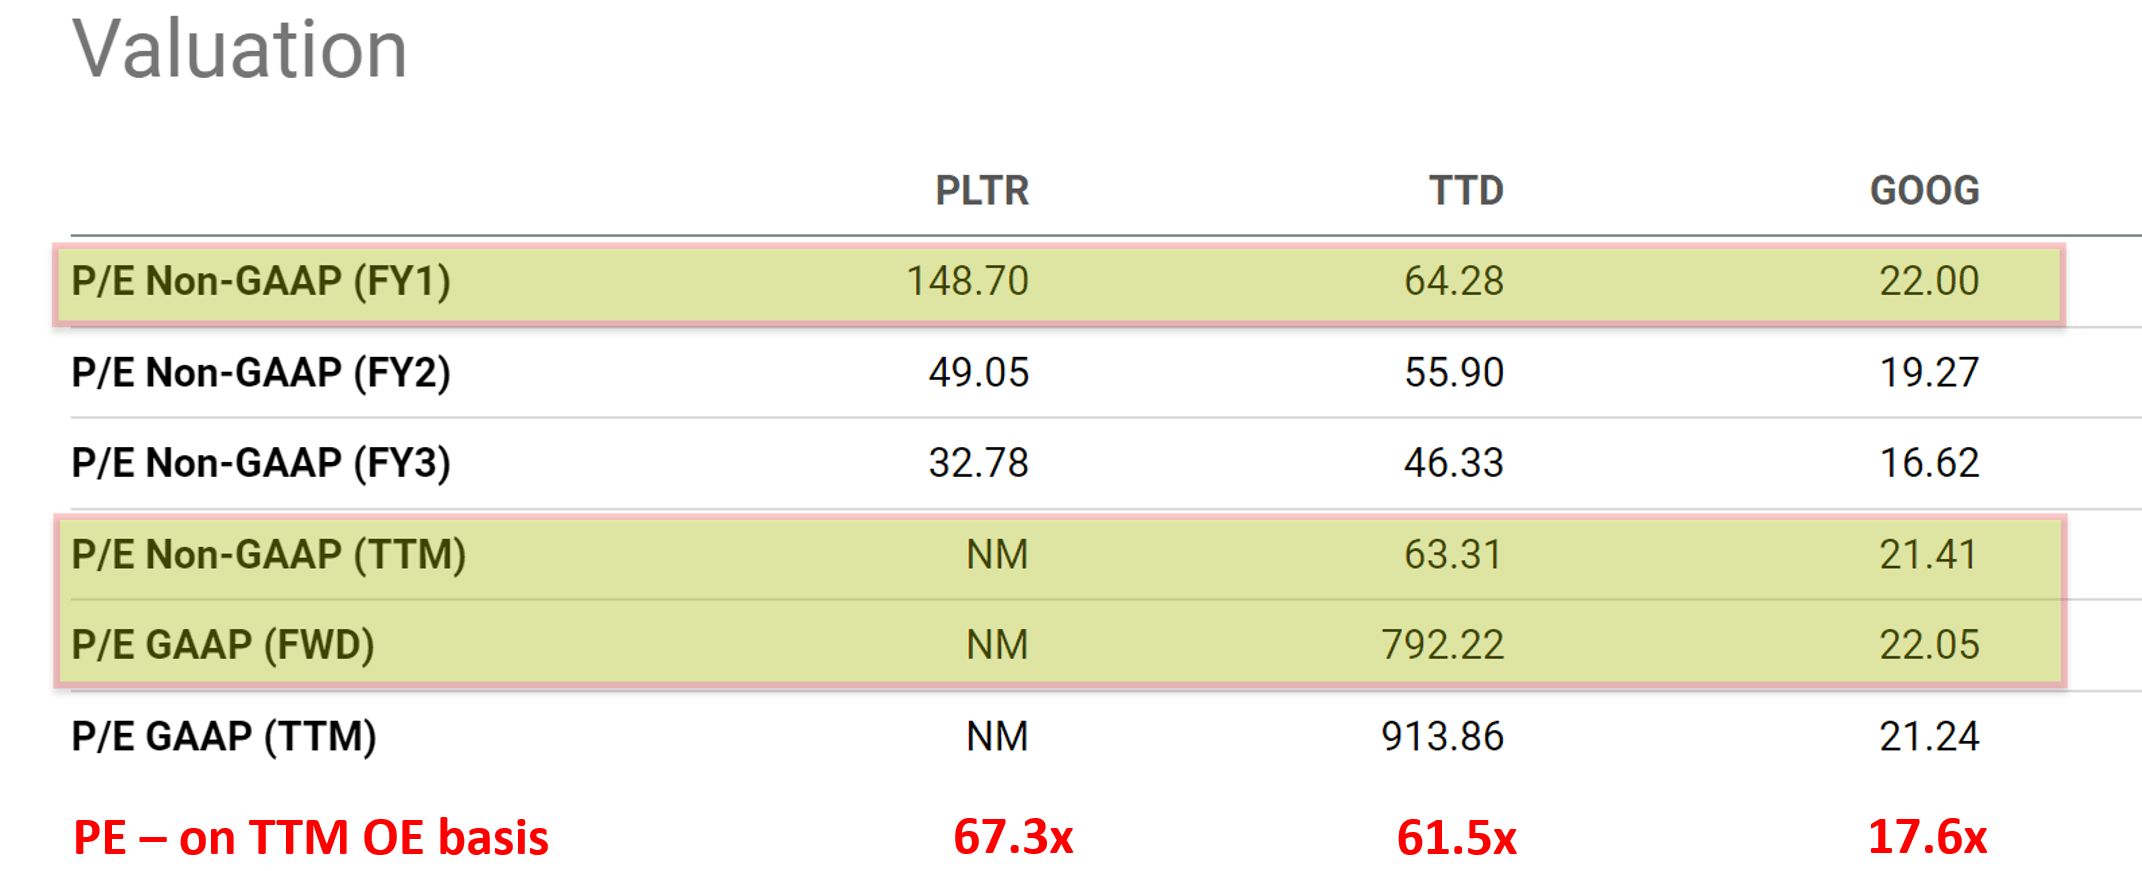
Final thoughts and risks
To conclude, good businesses are always tricky to value. And both TTD and PLTR are representative examples. Due to their high growth rates, light capital requirement, and scalable business model, commonly quoted valuation multiples are meaningful, or even worse, misleading. For these businesses, investors should dissect their CAPEX expenditures and adjust for the growth part. And the analyses here show that such adjustments following the Greenwald approach, PLTR and TTD’s valuations are actually quite similar (67.3x vs 61.5x), and both imply about 35% to 40% of expected growth rate for the next few years. Not entirely infeasible, but quite aggressive growth assumptions.
Finally, risks. Specific risks facing either business have been detailed in other SA articles (and also in my own past articles) already. So here, I will just focus on a generic risk in the Greenwald method itself. The method was developed for “old” businesses where CAPEX expenses are the main capital expenditures. However, for “new” businesses such as SaaS companies, the method should be revised and expanded. As these companies are so capital-light and scalable that their operation expenses (“OPEX”) should be dissected into the maintenance part and growth part, and the growth part should be added back to the OE too. For both PLTR and TTD, their R&D expenses are a good part of their OPEX. And as seen in the chart below, the R&D expenses alone already dwarf their total CAPEX expenditures. And at least part of the R&D expenses should be adjusted too. A good topic for future research. And inputs from readers with more intimate experiences with software development are greatly appreciated!
Seeking Alpha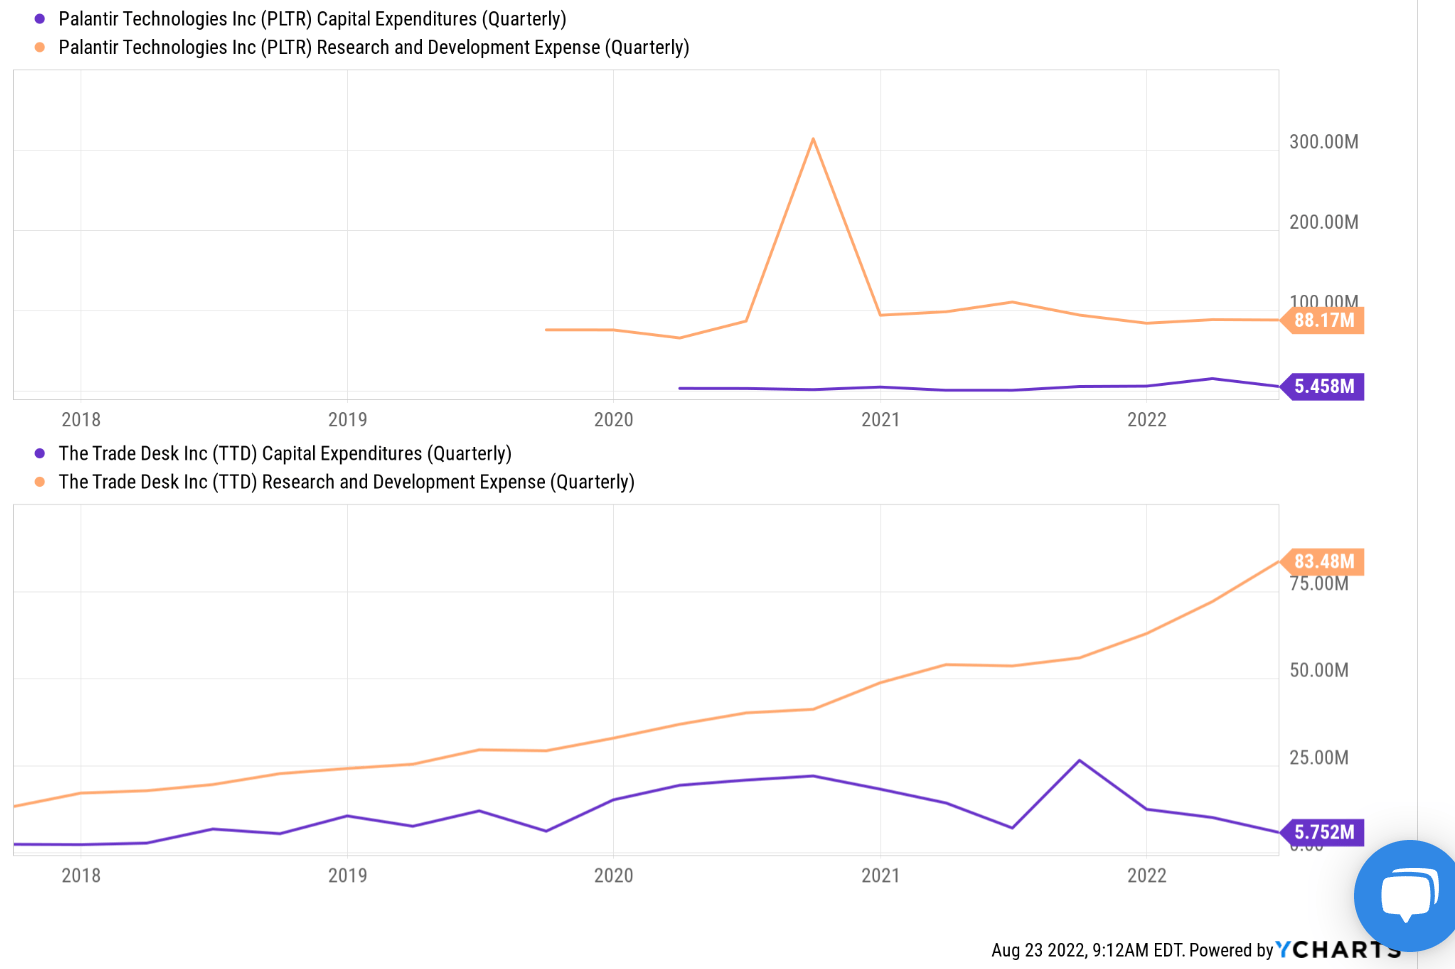
Be the first to comment