

Michael Vi
Q3 recap and thesis
Palantir Technologies (NYSE:PLTR) released its Q3 earnings report (“ER”) last Monday (Nov. 7). The results missed consensus estimates on both lines. It earned an adjusted EPS of $0.01 and total revenue of $477.8M. In comparison, consensus estimates expected an EPS of $0.02 on revenues of $480.6M.
Looking ahead, there are concerning signs that the company will likely miss its own 30% annual revenue growth rate target too. In its Q3 ER, it provided updated guidance for Q4 sales to be in a range of $503M to $505M, below the estimates of $505.9M. In my view, I even doubt if it can meet its lowered guidance. Palantir posted mixed results in Q2 already. It reported a per-share deficit of $0.09, more than last year’s $0.07 loss per share for two main reasons. First, the company incurred a one-time loss on its investments in marketable securities. And second, its total operating expenses continued to be on the high end. I do not see the cost issues abating given the persisting inflation and macroeconomic environment. While at the same time, its top-line growth is showing signs of slowing down.
Source: PLTR Q3 ER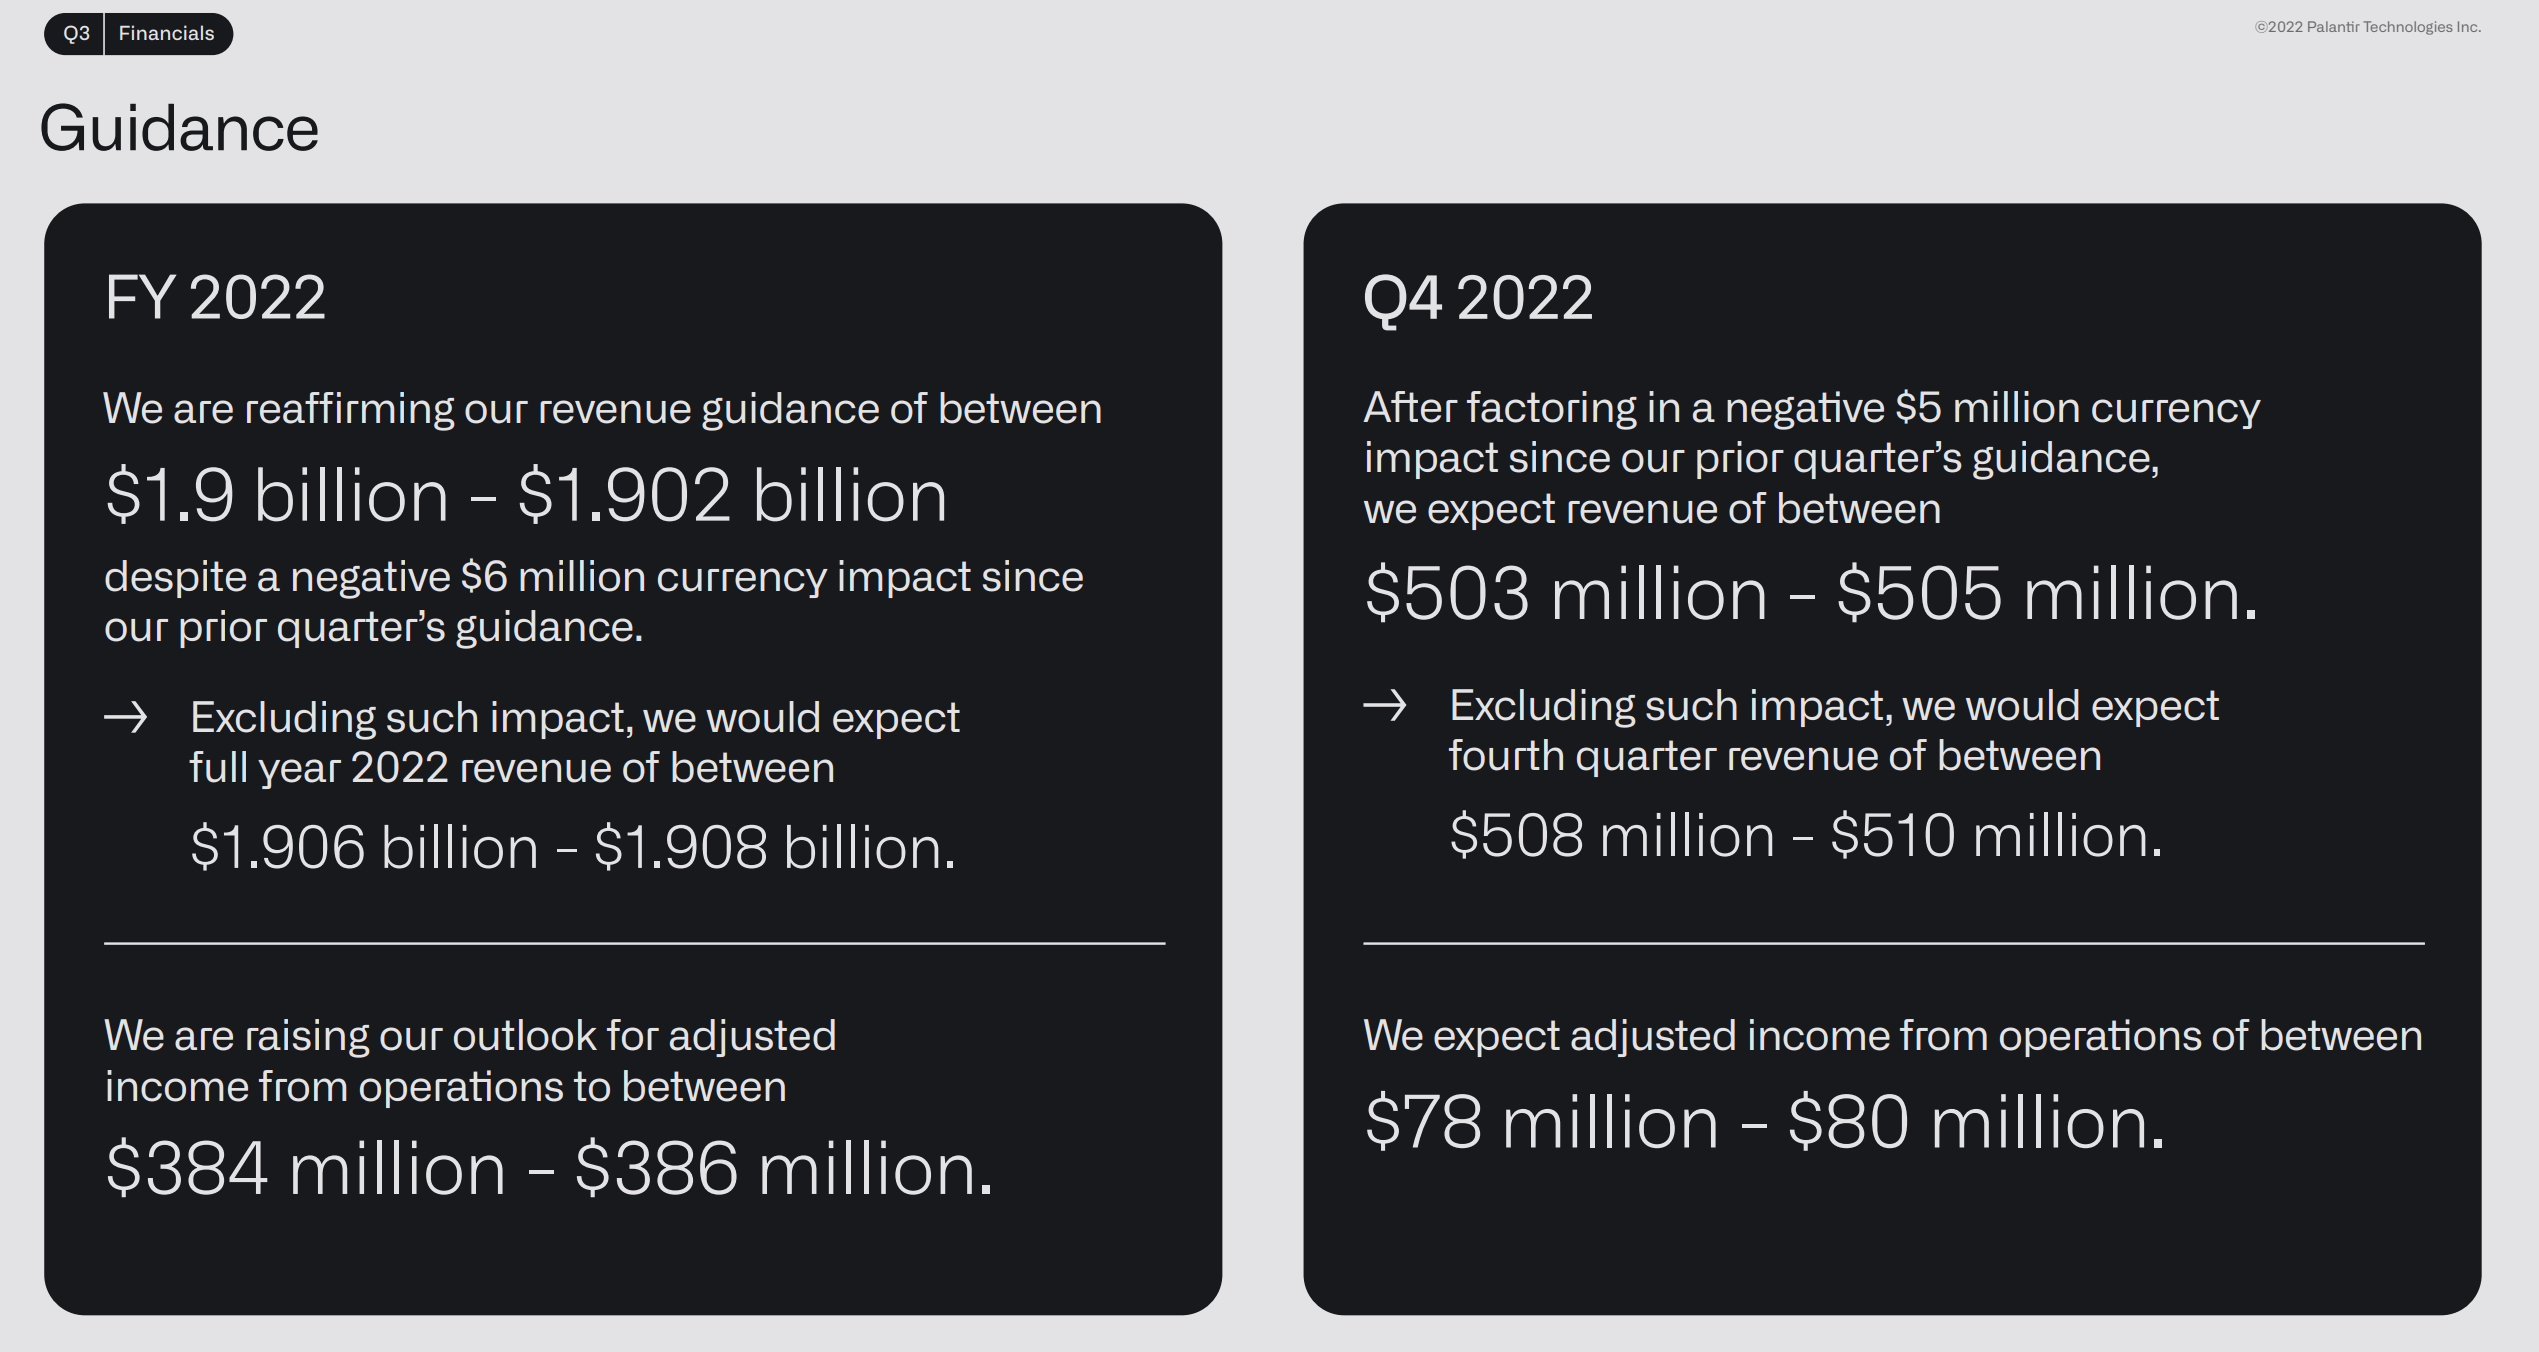
Furthermore, its revenue mix is currently dominated by government customers. Its initiatives toward widening the customer base to include early- and growth-stage companies are still at an earlier stage. These efforts also face uncertainties given the current macroeconomic conditions. Ultimately, large government clients are also subject to a number of uncertainties themselves in terms of budgetary issues and policy changes.
Under these uncertainties, the stock has been under intense selling pressure lately, both in the open market (as shown in the figure below) and in insider transactions (to be elaborated on in the next section). To be more specific, in the open market, the stock has been trapped in a single-digit price range since May. To make the large share price plunges even worse, the plunges also occurred under heavy trading volume. As you can see, the dominant selling volume occurred in a range from $7.5 to $8.5 (as highlighted in the green box below), effectively forming a ceiling for its stock prices in the near term.
And next, we will see that insider activity adds another confirmatory evidence to the above range too. And the thesis of this article is that I see these sell decisions, both in the open market and among the insiders, to be the right call according to a Kelly bet analysis.
Source: Author based on data from stockcharts.com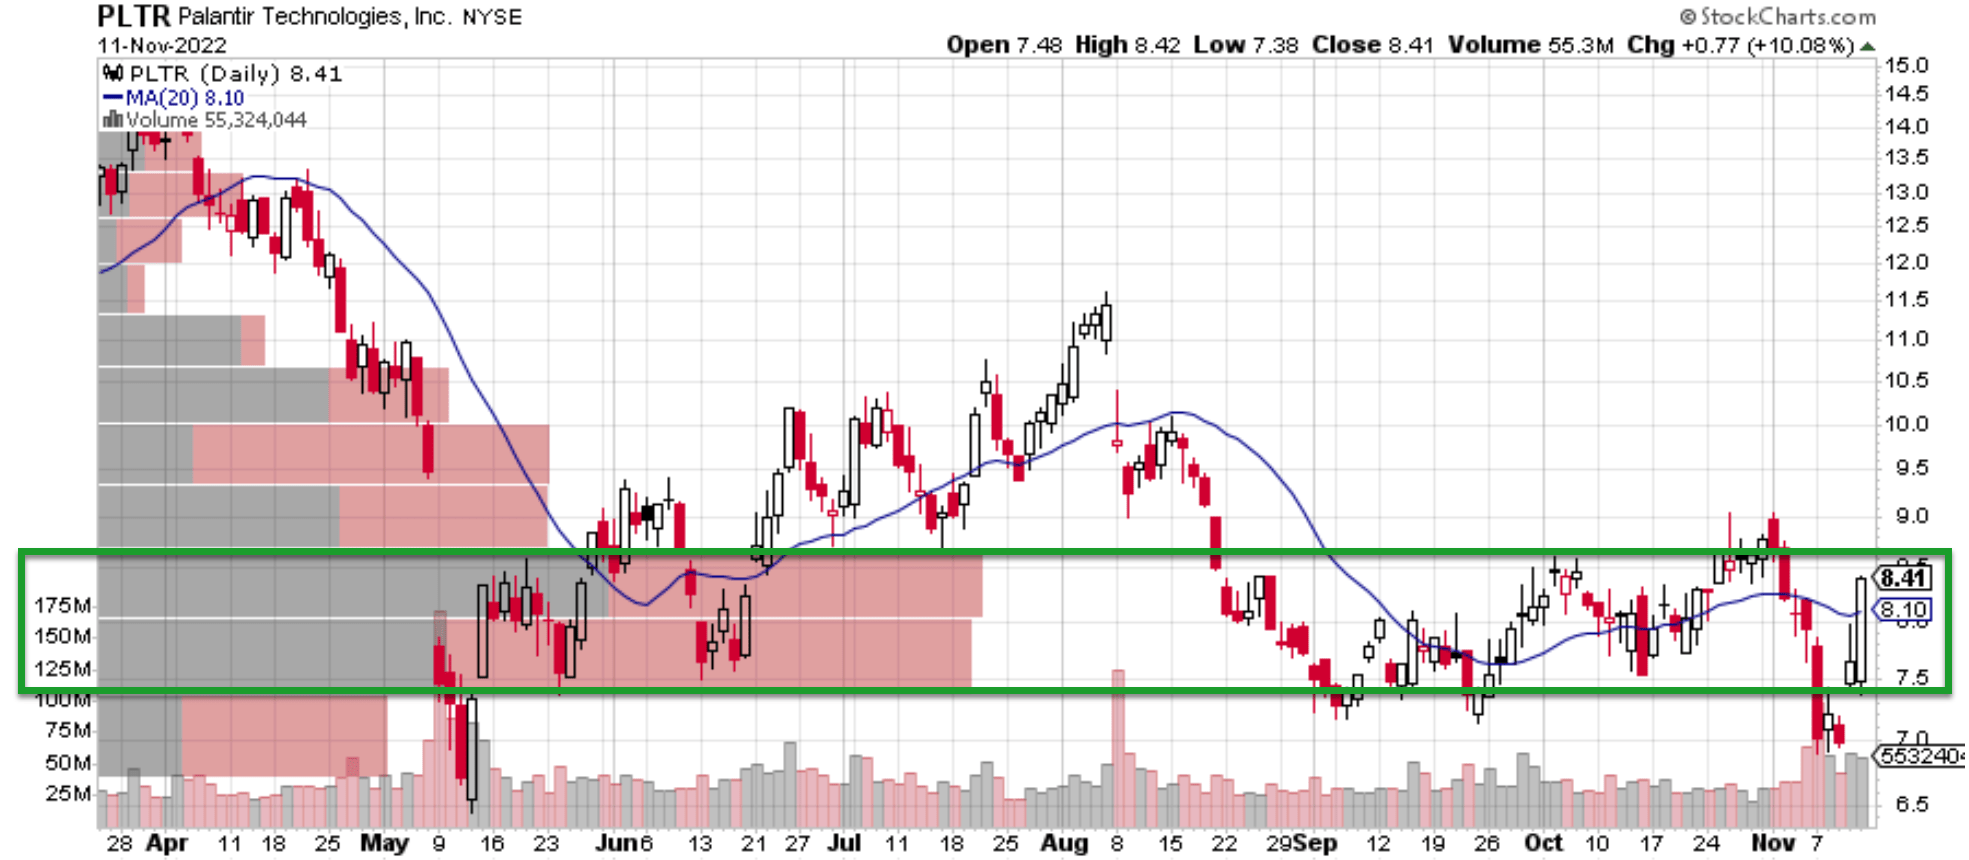
PLTR’s insider activities
The chart below shows a summary of PLTR’s insider activity over the past year. As you can see, selling actions dominated the activity of insiders completely. There has been a total of 90 insider transactions over this period, and every single one of them has been selling. All told, these transactions resulted in a total of $124M in total. A few examples of the latest transactions (back in August) by two of its directors are shown, and they all sold in a range of around $8 per share. As explained in my earlier article, I usually pay less attention to insider selling because selling can be caused by factors irrelevant to business fundamentals. But, in PLTR’s case here, I do have to pay attention because the insider actions are so one-sided.
And in the remainder of the article, I will examine these selling decisions with a Kelly bet analysis. And you’ll see why my conclusion is that the near-term return profile is indeed unfavorable.
Source: DataRoma.com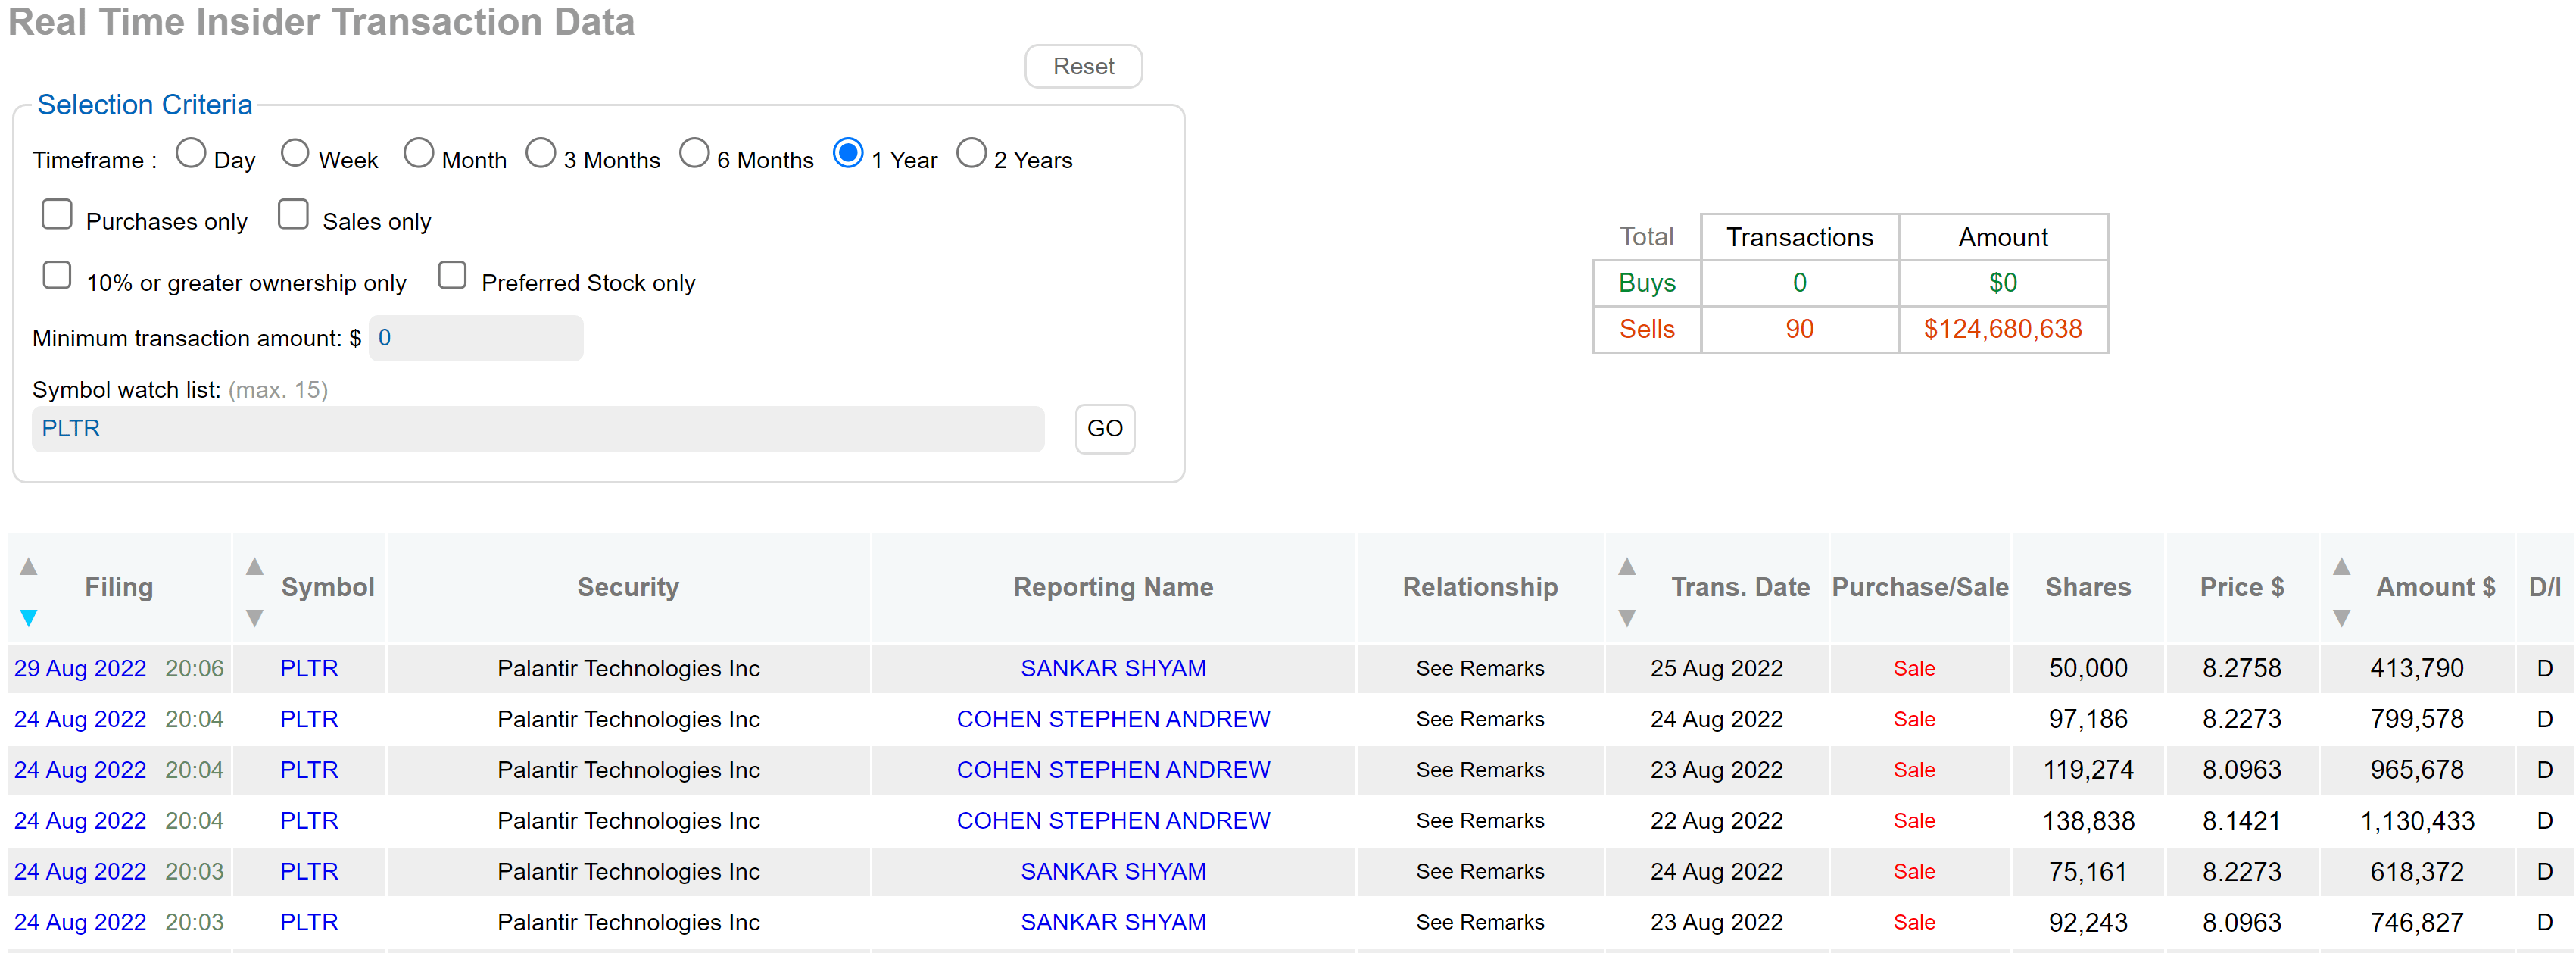
PLTR’s valuation still too expensive
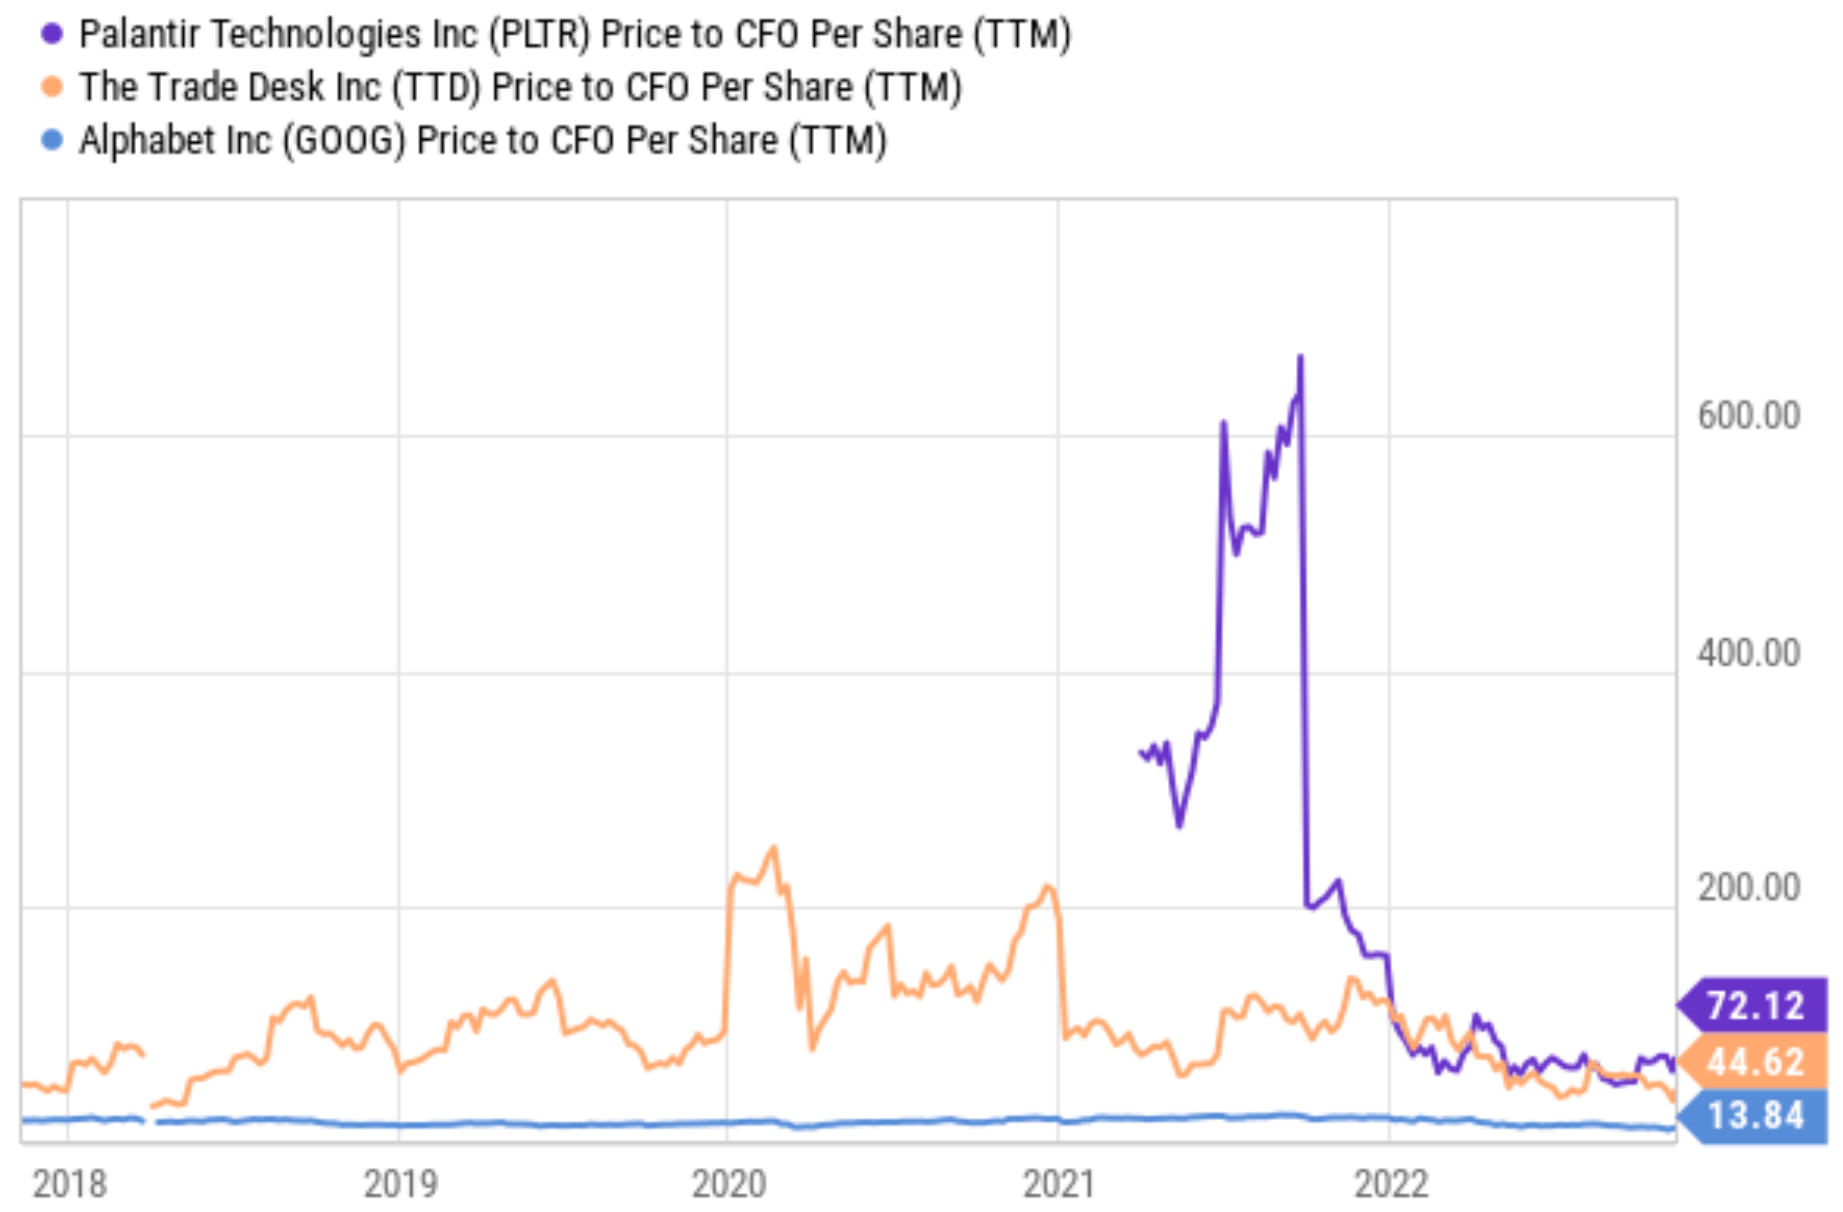
First, let’s take a look at its valuation with the updated earnings guidance and stock prices. As shown in the table below, despite the sharp price decreases, PLTR’s valuation is by no means cheap. It’s still boasting a 1-year FW PE in the triple digits. Even when we look 2 years and 3 years out, its PE is 48x and 37x, respectively. These levels are concerning in my mind for at least two reasons.
First, it is just simply too high both in absolute terms and also in relative terms (e.g., compared to the overall market or some similar peers as shown in the next chart). Because of its lack of net profit, the next chart compares its valuation against Trade Desk (TTD) and Alphabet (GOOG) (GOOGL) in terms of P/CFO (cash from operations). As seen, its current P/CFO multiple of 72x is almost 2x higher than TTD’s 44x and 5x higher than GOOG’s 13.8x.
And secondly, its future earnings are so uncertain, as elaborated on next.
Source: Seeking Alpha data Source: Seeking Alpha data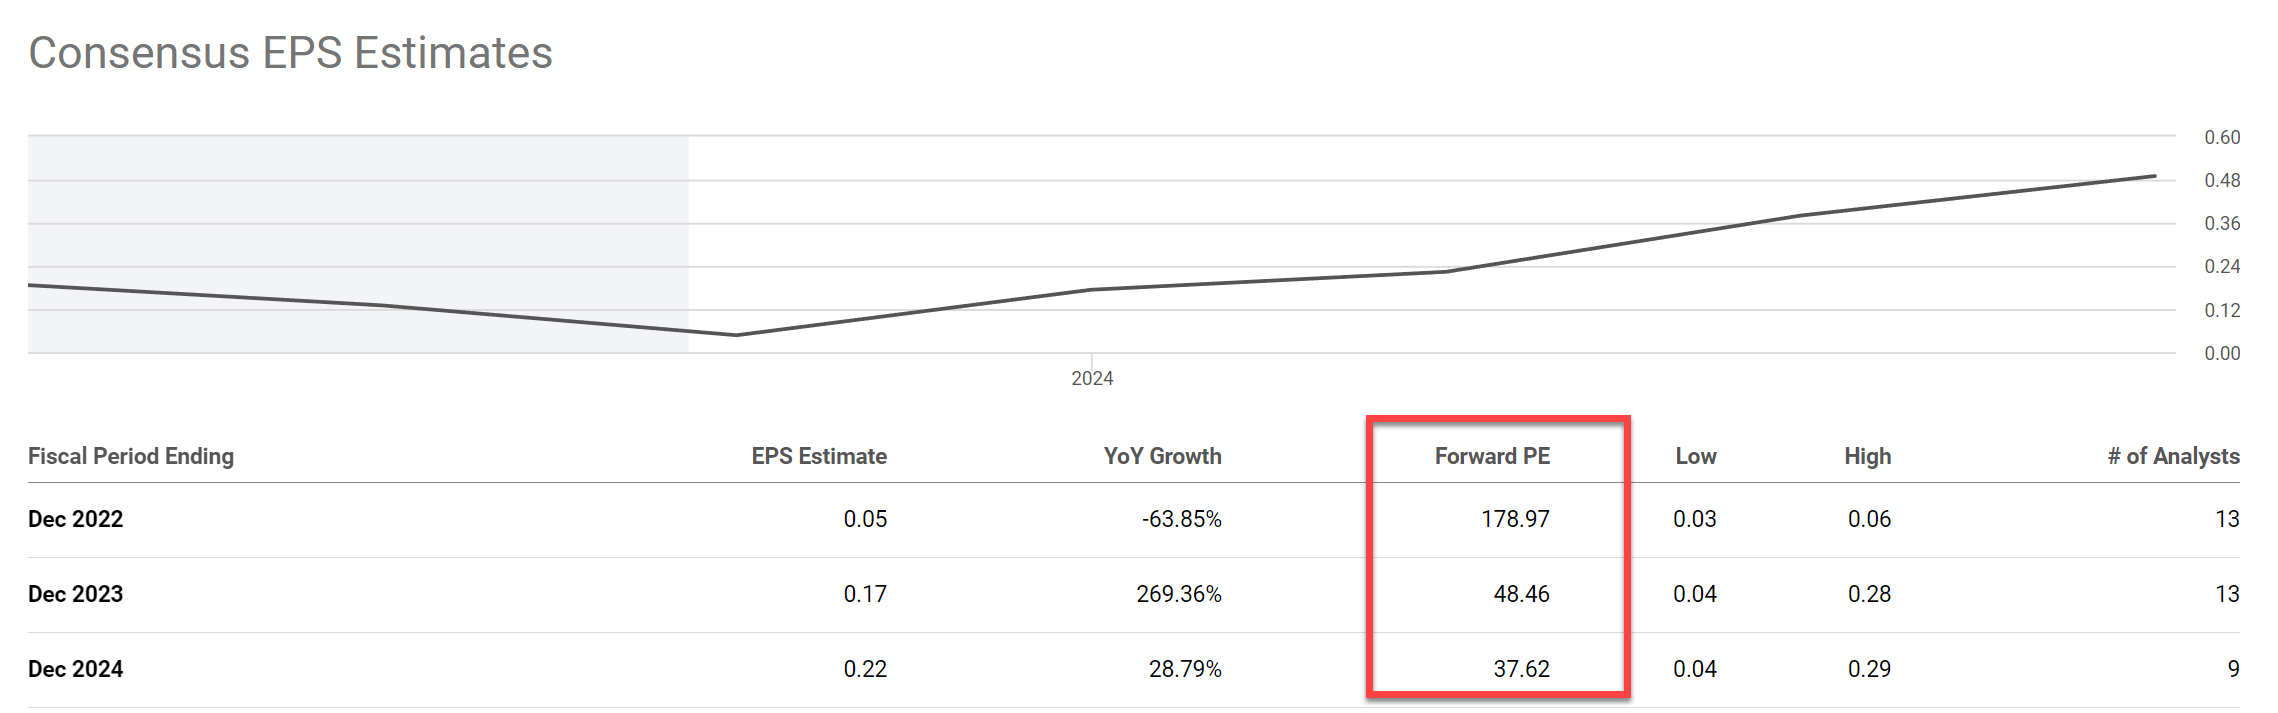
PLTR: large uncertainties and variance
Due to all the headwinds mentioned above, PLTR’s earnings in the near future face tremendous uncertainties the way I see things. And variance among the consensus estimates seems to reflect my concerns too, as you can see from the chart below (especially those portions highlighted in the green boxes). First, consensus estimates expected a 63% EPS decline in 2022. Second, for the next 3 years, consensus estimates expect an EPS in the range of $0.03 to $0.29. Note how large the variance is here. The high-end estimate of $0.19 is almost 10x more than the low-end estimate. And I will further examine the implication of such variance next using a Kelly analysis.
Source: Seeking Alpha data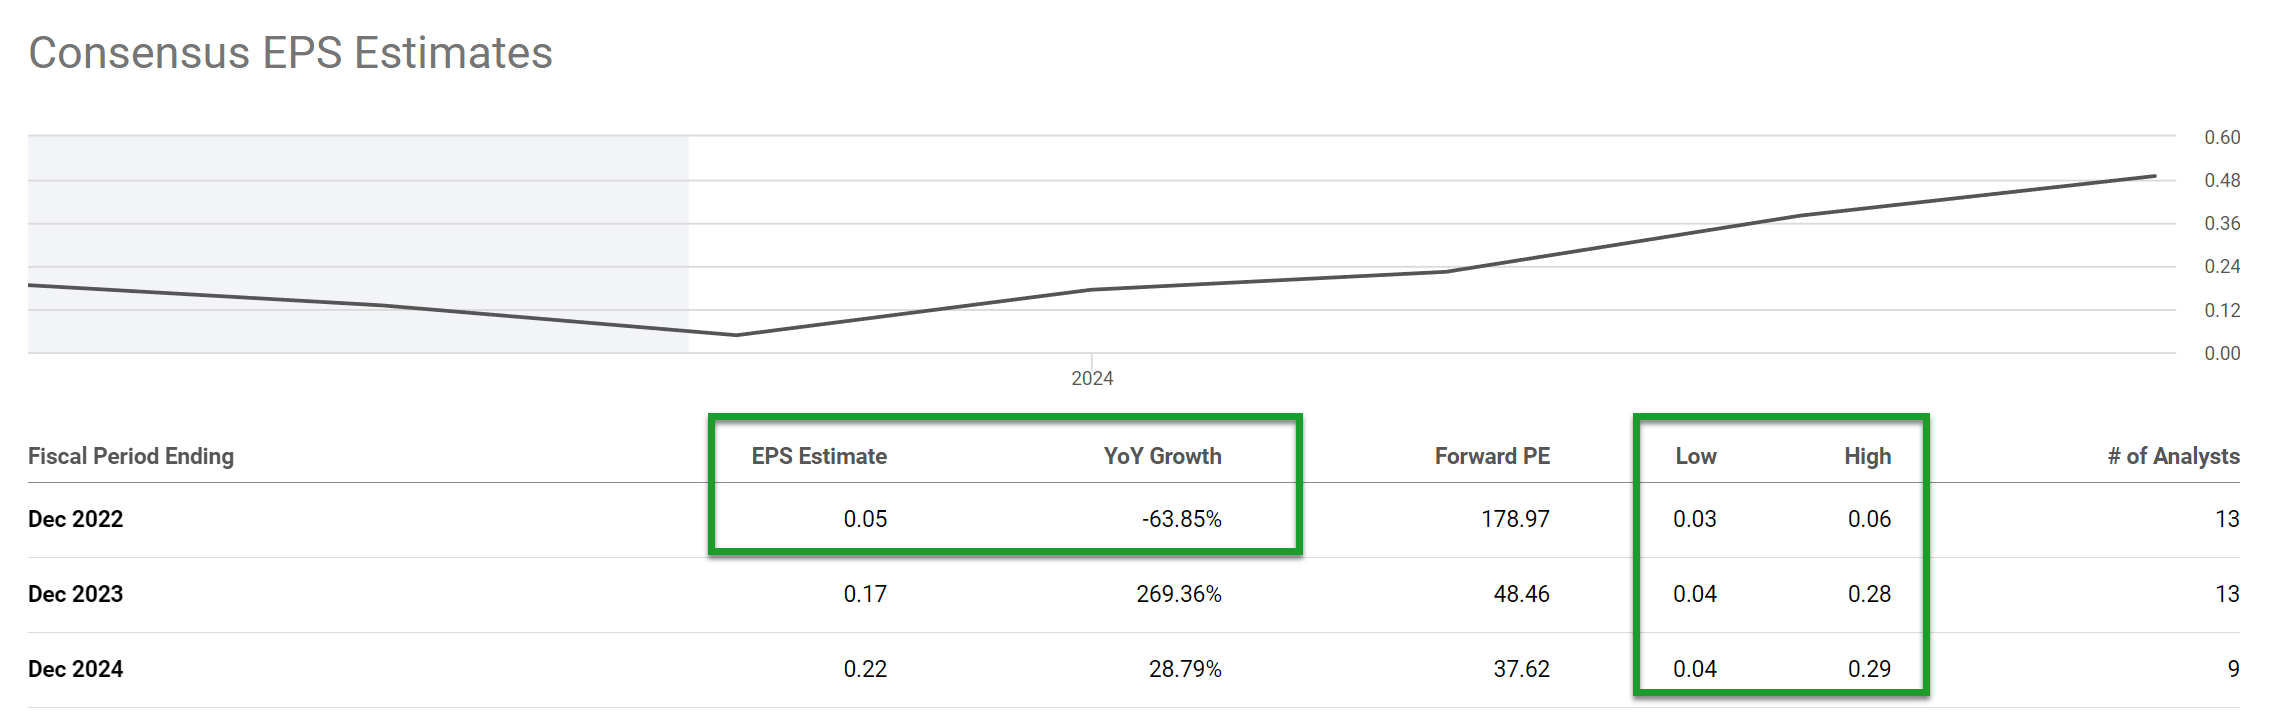
Kelly bet analysis
Whenever projected scenarios show a large variance (as in the case of PLTR here), I always urge my readers to not only consider the expected return, but also the effects of the variance. The expected return actually does not matter too much here. The variance might bankrupt you regardless of the expected return. And an effective way to consider the effects of the variance is by a Kelly analysis, as shown in the table below.
This table summarized a few scenarios based on the above valuation and fundamentals discussion. The key is to encompass the span of possible scenarios (say in the next 6 months or 1 year), so we get a sense of the risk/reward profile of the investment. The table is made under these key assumptions:
- The base scenario takes its 20-day MA (moving average) as a target price. It is a sensible assumption in my mind because of the heavy trading volume in this price range as aforementioned.
- The bearish outcome assumes a 30x PE with a 2024 EPS of $0.22, the mid-point of the consensus estimates shown above. This leads to a target P of $6.6. In my mind, this is already drastically optimistic given that consensus estimates’ low-end EPS projection is only $0.04 and also 30x PE is at such a large premium relative to the overall market of its peers.
- Finally, the bullish scenario assumes a 40x PE and the high end of the EPS projection in 2024 ($0.3 as shown in the chart above), leading to a target price of $12.0, a 43% upside from the current price.
Source: Author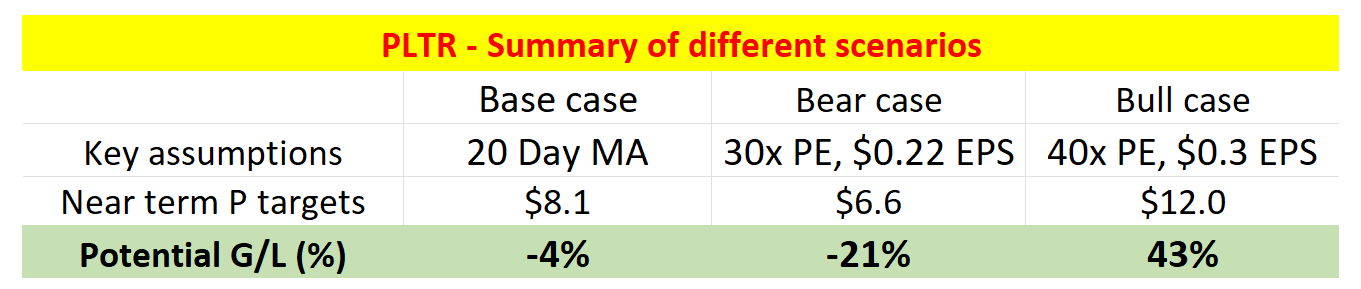
The next table summarizes the Kelly analysis for the above scenarios. The method is detailed in my earlier article on Altria. And the key benefits of the analysis are:
- The Kelly method is more action-oriented and logical. The Kelly analysis is a tool to determine betting size that can lead to optimal growth in the long run (i.e. if you place a large number of the same bet over and again).
- And as aforementioned, it not only considers the expected return, but also the variance among the outcomes, which is equally important, or more important in high-uncertainty situations like this.
In the case of PLTR, I see the most favorable odds are: 50% for the base case (with a -4% downside), 25% for the bearish case (with a -21% downside), and 25% for the bullish case (with a 25% upside). I see the odds as the most favorable because I am assuming the bearish and bullish cases to have equal probability. In reality, I see the bullish case to have a much lower probability due to the headwinds mentioned. But under these most favorable odds, the bet is not that attractive to me.
The good news is that the expected return is a positive 1.19% (but haven’t you been warned to not only look at the expected return already?). To start, it is quite a low expected return considering the risks you are taking here. And secondly, the return is highly unstable because of the large variance here. Just look at the so-called break-even odds in the next column (the odds that make the expected return zero). As you can see, even if the odds for the bull and bear cases are shifted by 5%, the expected return drops to zero.
Source: Author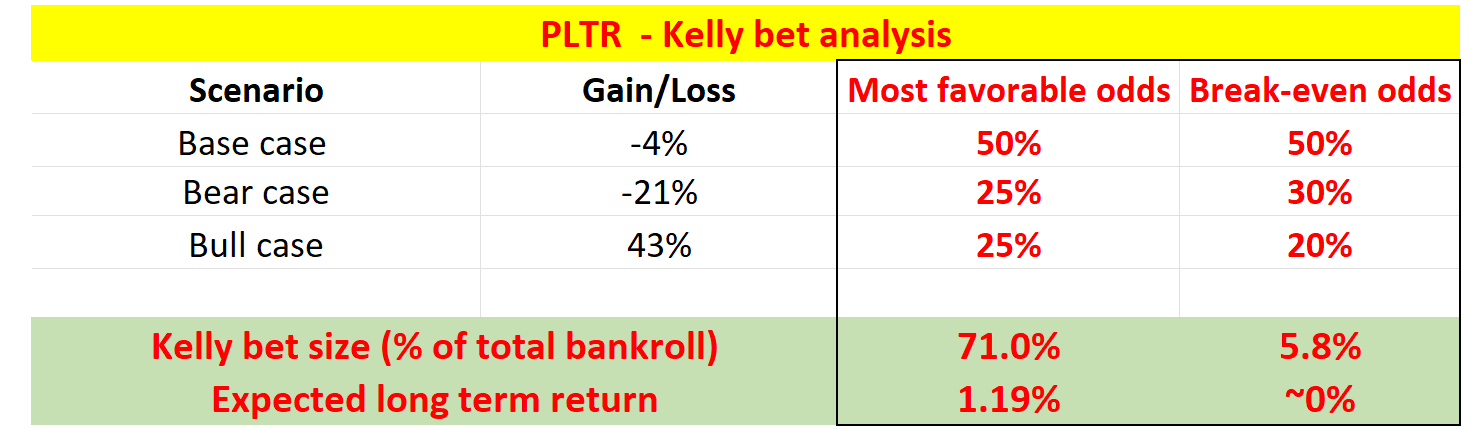
Risks and Final thoughts and risks
To recap, PLTR reported mixed Q3 2022 results and cloudy guidance, reflecting many of the headwinds it has been facing in recent quarters. And I see many of these headwinds persisting into the next 6 months or 1 year at least. In particular, in my view, the company relies too heavily on the government sector. Granted, large government customers could be a resilient source of revenue, especially during periods of economic uncertainty. But they are not immune to macroeconomic and policy risks. They are subject to a range of uncertainties such as budgets and policy changes. Contract renewals are no guarantee, either. Recognizing these issues, PLTR has been taking initiatives to widen its customer base. However, these initiatives are still at an earlier stage, face uncertainties given the current macroeconomic conditions, and will keep adding to its cost issues.
As a result (or reflection) of these above issues, PLTR’s trading activities have been dominated by selling pressure both in the open market and among insiders. Upon a closer look, its return profile under current conditions is indeed full of red flags typical of unfavorable bets: minimal expected bet return, large variances in outcomes, and extreme sensitivity to estimating error.
Be the first to comment