

imaginima
Thesis
Leading oil and gas exploration and production ((E&P)) company Ovintiv Inc. (NYSE:OVV) is slated to release its FQ2’22 earnings card on August 4. Energy stocks have been battered after forming their June highs. Our price action analysis suggests that WTI crude (CL1:COM) and natural gas (NG1:COM) had formed menacing bull traps (significant rejection of buying momentum) in June after a tremendous surge from their respective COVID bottoms.
Consequently, we also observed similar ominous price structures on OVV’s medium- and long-term charts. Therefore, we believe investors need to be wary of adding OVV at these levels and not getting tempted by the free cash flow (FCF) yields on offer now (the market is not dumb).
Our valuation model suggests that OVV could underperform the market even after its recent retracement. Even though it’s likely at a near-term bottom, we believe the market could use the current consolidation zone to draw in dip buyers before forming another bull trap to digest its gains further.
Accordingly, we rate OVV as a Hold for now and urge investors to be patient in considering adding exposure.
OVV’s June Highs Likely Its Peak
OVV price chart (TradingView)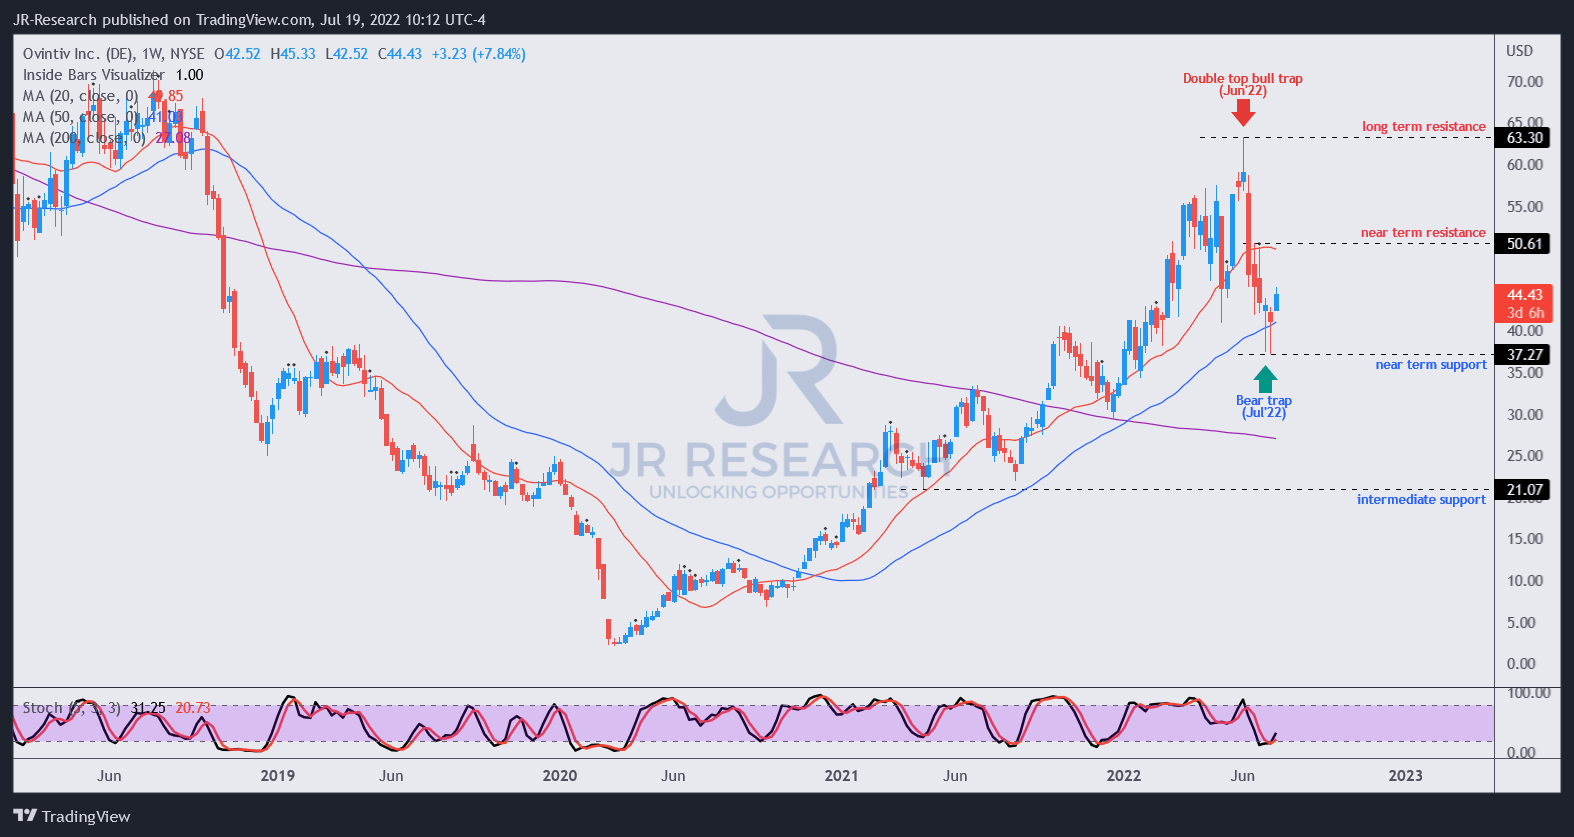
As seen above, the market formed a double top bull trap in June, which we believe is likely the peak in OVV in the medium-term. As a result, the stunning collapse over the past few weeks was not surprising, as the market shook out the weak holders.
The 40% decline from its June highs also sent OVV into oversold zones and formed a validated bear trap (significant rejection of selling momentum) two weeks ago.
Consequently, we are confident that OVV is likely at a near-term bottom, underpinned by its near-term support ($37).
However, we don’t encourage investors to add at the current levels, as we believe a subsequent bull trap could follow after a short-term rally. Investors should note that initial bear traps after double top bull traps are usually unreliable. Therefore, investors considering adding exposure should first consider a re-test of its near-term support to assess its robustness.
Natural gas futures price chart (TradingView) WTI crude price chart (TradingView)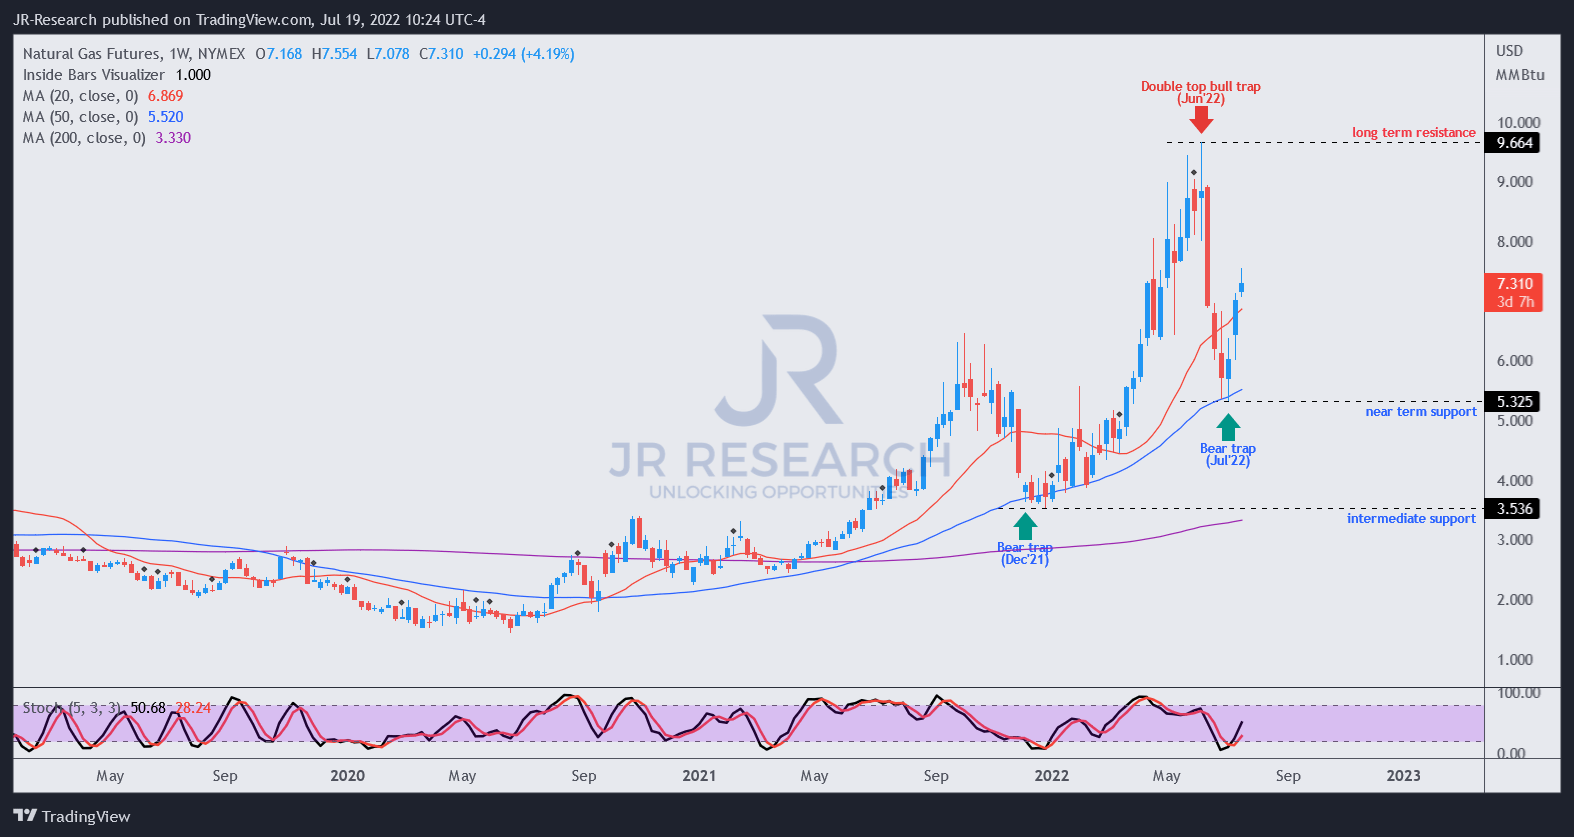

Moreover, we urge investors to pay attention to the price structures of natural gas and WTI crude. Notably, both also formed menacing double top bull traps in June, coinciding with the fall in OVV.
As a result, we believe that OVV has likely seen its highs in the medium term, and investors should prepare for a steeper fall ahead after a short-term rally. Consequently, a potential steep fall in WTI and natural gas could also impact Ovintiv markedly, as it cautioned in its filings (edited):
If oil, NGLs, and natural gas prices decline significantly for a sufficient period, the carrying value of our properties could be subject to financial impairment, and our net earnings could be materially and adversely affected. (Ovintiv FQ1’22 10-Q)
OVV’s Valuation Suggests It Could Underperform
| Stock | OVV |
| Current market cap | $11.36B |
| Hurdle rate [CAGR] | 11% |
| Projection through | CQ4’26 |
| Required FCF yield in CQ4’26 | 20% |
| Assumed TTM FCF margin in CQ4’26 | 20% |
| Implied TTM revenue by CQ4’26 | $18.09B |
CVV reverse cash flow valuation model. Data source: S&P Cap IQ, author
We applied a market-perform hurdle rate of 11%, with an FCF yield of 20%. Note that the consensus estimates indicate that Ovintiv’s FCF margins are expected to fall through FY24. Therefore, we believe it explains why OVV last traded at an FY24 FCF yield of 20.85%. The market justifiably demands higher yields to compensate for the risks of holding OVV.
We noted that OVV’s buying upside was rejected in June at an FCF yield of 14.67% (too low). However, the recent bear trap formed at an FCF yield of about 25%. Hence, we believe our 20% requirement is appropriate to model the current market dynamics.
Consequently, we derived a TTM revenue target of $18.09B by CQ4’26, which Ovintiv is unlikely to meet at our hurdle rate. As a result, we believe that OVV could likely underperform over the next four years.
Is OVV Stock A Buy, Sell, Or Hold?
We rate OVV as a Hold for now.
It’s likely at a near-term bottom, underpinned by its recent bear trap. However, we don’t encourage investors to add exposure, as its price structures have too many red flags.
Moreover, our valuation model suggests that OVV could underperform the market over the next four years at the current levels.
Therefore, investors considering adding exposure should wait patiently for a deeper retracement.
Be the first to comment