

jeffbergen
Equinix (NASDAQ:EQIX) is an equity REIT that owns interests in 248 data centers in 70 cities around the world for the purposes of providing colocation and integration services, which make up to 92% of recurring revenues for the company. The firm has 20+ years of experience in the market, maintaining a fair share of it by deploying an aggressive acquisition strategy that might start to dry up given rising interest rates. Furthermore, other macroeconomic risks, like record inflation levels or foreign exchange rates, might hurt the company’s short-term profits.
Valuation multiples offer a negative view of the stock’s price. Also, dividend discount models rely on high growth assumptions that might be challenged in the future. Consequently, my overall take regarding the stock is bearish. Moreover, a dividend yield of 1.98% seems low compared to the one-year Treasury yield standing at around 3.5%, which might attract risk-averse investors.
Company and Market Overview
Equinix is a vendor-neutral data center provider that offers solutions for digital leaders all around the world. Through its International Business Exchange (IBX) data centers, the company creates value for its customers by interconnecting competing networks that can share traffic to achieve high scalability. As more clients join the Equinix platform the company creates huge economies of scale for its customers that can develop synergies among themselves.
Geographically, the company is spread throughout the five continents. While America accounts for 46% of recurring revenue, Europe, the Middle East, and Africa represent 32%, whereas Asia-Pacific accounts for 22% of revenues. As such, problems related to the foreign exchange rate could arise.
By product line, the company generates its revenue mainly from colocation services at 73.5%, followed by interconnection services at 18.5%, and the rest from infrastructure management and others. As professor Aswath Damodaran says, there are two key drivers for growth: one operating your assets more efficiently, and the other is acquiring stakes in new projects. As colocation services require space, Equinix mainly relies on the latter to grow while trying to grow their interconnection business at the same time, which still has room for growth. During the last year, the company has been involved in three main acquisition deals and a description of the allocations is displayed in the table below:
Equinix 10Q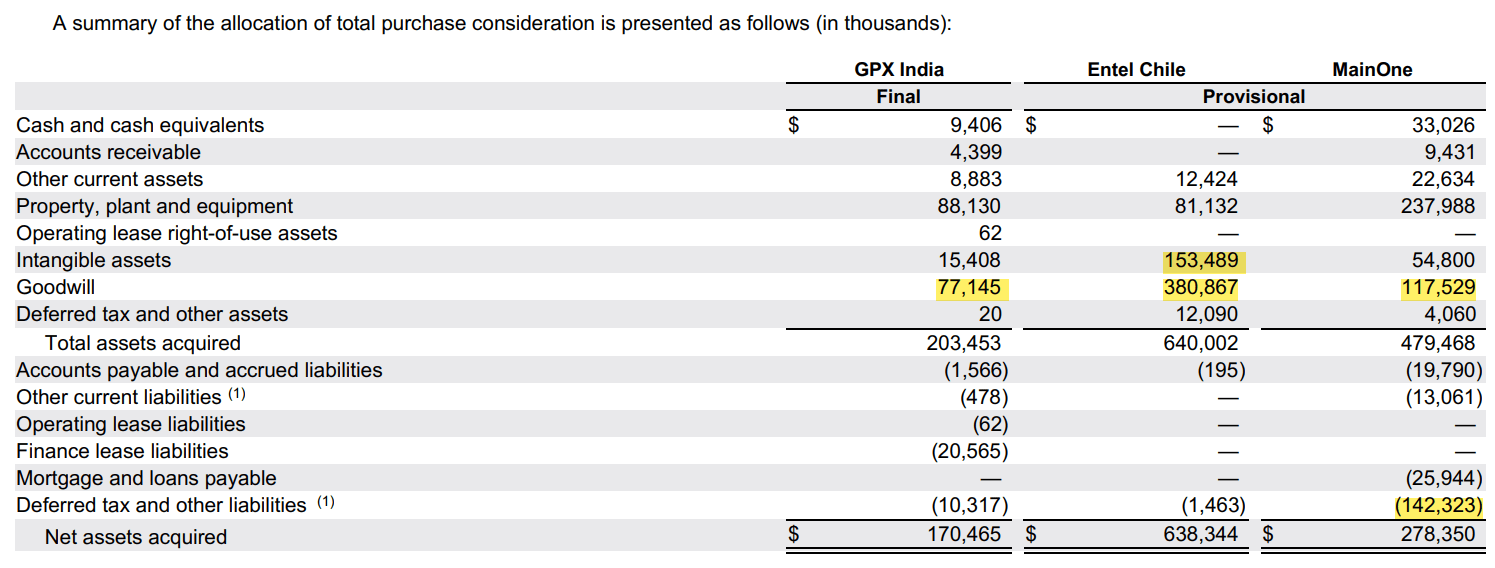
Intangible assets’ fair value is computed as the net present value of future cash flows generated by current clients, whereas goodwill represents the excess price paid for both tangible and intangible assets, which is attributable to the workforce as well as to future revenue increases that might come from future clients. Having said that, over the three deals the company has agreed to pay more than 112% premium in the form of goodwill. Moreover, the goodwill acquired in those deals is not subject to deduction for local tax purposes, which might increment the tax expense over this period. The tax liabilities acquired from the MainOne operation can also worsen this situation, and it represents a significant increase in the net debt of the company. Finally, the inherent risk of the nations where the acquired assets are settled (India, Chile, and South Africa) only adds uncertainty to these pricy deals.
Although many companies own their data centers, the cloud market is shifting away from that model as the costs of building and maintaining the infrastructure are enormous, a trend that benefits Equinix. The outsourcing market has historically been served by large telecommunication service providers that can no longer keep up with the surge in demand. One example is the sale of four data centers in Chile by Empresa Nacional de Telecomunicaciones, or ENTEL, which is currently selling its portfolio of data centers to focus on telecommunication services. This could mean that the company might be able to find new deals to keep growing at the current pace, if it can raise the capital needed.
Multiples Valuation
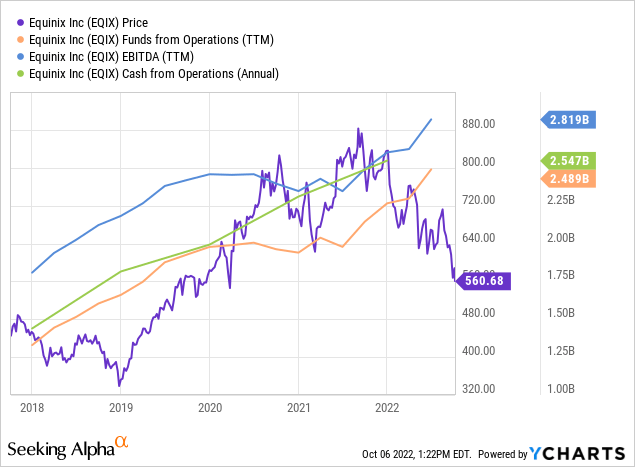
In 2022 so far, Equinix’s price performance has been severely affected by the selloff that mostly targeted high-growth firms. Rising interest rates and other macroeconomic concerns have affected market performance. Meanwhile, the company has managed to expand cash and funds from operations to new heights since the start of the stock price decline in September 2021.
Although this might have contributed to lower valuation multiples, the stock is still far away from those ratios of the rest of the sector. Compared to its peers, Equinix seems highly overpriced and suggests that the selloff should continue for a while.
| Indicator | EQIX | Sector median | Implied price | Difference from market price |
| Price/sales | 8.72 | 5.26 | 381.24 | -39.6% |
| Price/earnings | 89.88 | 31.71 | 222.60 | -64.73% |
| Price/FFO | 32.91 | 14.74 | 282.8 | -55.2% |
| EV/EBITDA | 29.22 | 18.51 | 500.60 | -20.68% |
When using the price ratios for the sector to estimate Equinix’s valuation, we find out that the equity is overpriced by 26%-183%. None of the ratios even close to the sector median, and for some of them the differences are exuberant.
This preliminary analysis was performed to get a big-picture perspective of the market expectations regarding the company’s financials, and to see if these conclusions are in line with more powerful asset pricing models, like the Gordon Growth model.
Dividend discount model approach
Since the company distributes earnings via dividends, which grow at a considerable pace, it could be appropriate to value the firm’s equity with the discount of those distributions to obtain its present value.
One very important assumption to make when valuing a company by its dividends is the growth rate of those streams of payments made by the company to its shareholders. In this study, a quarterly average growth rate for the last three years of 8.003% has been chosen instead of a five-year compound annual growth rate of 9.16%. The dividend growth for 2017-18 of 14% is not consistent with the average growth rate of the following four years of 7.98%.
The cost of equity is another key component when implementing a dividend growth model. The cost of equity is the factor at which future payments to equity holders should be discounted to obtain a net present value of those distributions. For this purpose, a capital asset pricing model (CAPM) and a three factors Fama and French model (FFM) have been calculated.
re = Rf + Bi1[E(MKP)]+ Bi2[E(SMB)] + Bi3[E(HML)] (1)
where:
- re is the cost of equity.
- RF is the yield for the one-year Treasury bill on month t retrieved from FRED.
- MKP, SMB, and HML are the three Fama and French factors that control for the market, size, and equity book to market value risk factors. The dataset used for this study and details on the variables are available here (see Fama and French, 1993, “Common Risk Factors in the Returns on Stocks and Bonds,” Journal of Financial Economics, for a complete description of the factor returns).
The model was then fitted using OLS and heteroskedasticity robust standard errors to estimate the parameters in the following way:
Rit – RFt = ai + Bi1(MKP) + Bi2(SMB) + Bi3(HML) + eit (2)
Where:
- Rit is the return of Equinix stock on month t.
- RFt is the yield for the one-month Treasury bill.
Note that all the factors’ returns are measured on a monthly basis from Jan. 1, 2014.
This yields the following results:
| coef | std err | z | P>|z| | [0.025 | 0.975] | |
| const | 0.7038 | 0.51 | 1.38 | 0.168 | -0.296 | 1.704 |
| Mkt-RF | 0.5237 | 0.122 | 4.29 | 0.000 | 0.284 | 0.763 |
| SMB | -0.4593 | 0.207 | -2.223 | 0.026 | -0.864 | -0.054 |
| HML | -0.5984 | 0.14 | -4.271 | 0.000 | -0.873 | -0.324 |
| R-squared: | 0.334 | Adj. R-squared: | 0.312 |
The main reason behind the choice of this model instead of a CAPM approach is because of the low R squared achieved. With the CAPM, the R squared is 0.119, whereas with the Fama and French model we get 0.334. Another reason for not choosing CAPM over FFM is that the CAPM underestimates the market beta with a value of 0.4328 and, therefore, a considerably lower cost of equity. It is also notable that all the coefficients estimated with the three factors FFM are statistically significant at a 5% level.
Finally, it was considered that the five factors FFM also fails to capture the coefficients for the risk premium of robust minus weak (RMW) and conservative minus aggressive (CMA). Those coefficients are not different from 0 at a 5% confidence level. Furthermore, the R squared coefficient doesn’t show much difference compared to the three factors FFM, so the simpler model was thought to be more convenient.
That said, the following table contains the results for the estimated cost of equity:
| CAPM: 7.44% | FFM 3 Factors: 9.86% |
Given these results, we should be able to apply the Gordon growth model, but we see that with the assumption we’ve made about the growth rate being 8.003%, it’s impossible to calculate the price implied with a CAPM cost of equity. Meanwhile, with the FFM cost of equity, we get an estimate of $719.11 by substituting the values on the following equation:
P0=Div0*(1+g)/(re-g) (3)
Where Div0 is the TTM quarterly dividend of 12.17.
Some might argue that the Gordon growth model is not appropriate for this particular case of high growth – and there’s some truth to that. Generally, this model overestimates the ability of a firm to keep up with a growth rate above the economy for an infinite period. However, it’s a simple way to derive market expectations of future dividends. By substituting P0 with the current market price ($631.16), we can then derive the implied growth rate (assuming re) and implied re (assuming g), as from equation (3) we know that:
g=(P0*re-Div0)/(P0+Div0) (4) &
| CAPM | FFM 3 Factors | |
| g | 5.37% | 7.75% |
re=Div0*(1+g)/P0+g (5)
| 5y CAGR=9.16% | 3y TTM growth=8.003% | g=6% | |
| re | 11.305% | 10.125% | 8.082% |
As we can appreciate from the tables above, given market prices, CAPM fails to capture the expected growth rate for future dividends by underestimating it. FFM implied growth lies very close to the forecast dividend growth of 8%, but we also have to take into account that the re estimated for the FFM is 9.8%. As such, the sensitivity of the growth rate with respect to the market price becomes steeper when the difference of re-g becomes smaller.
Yahoo Finance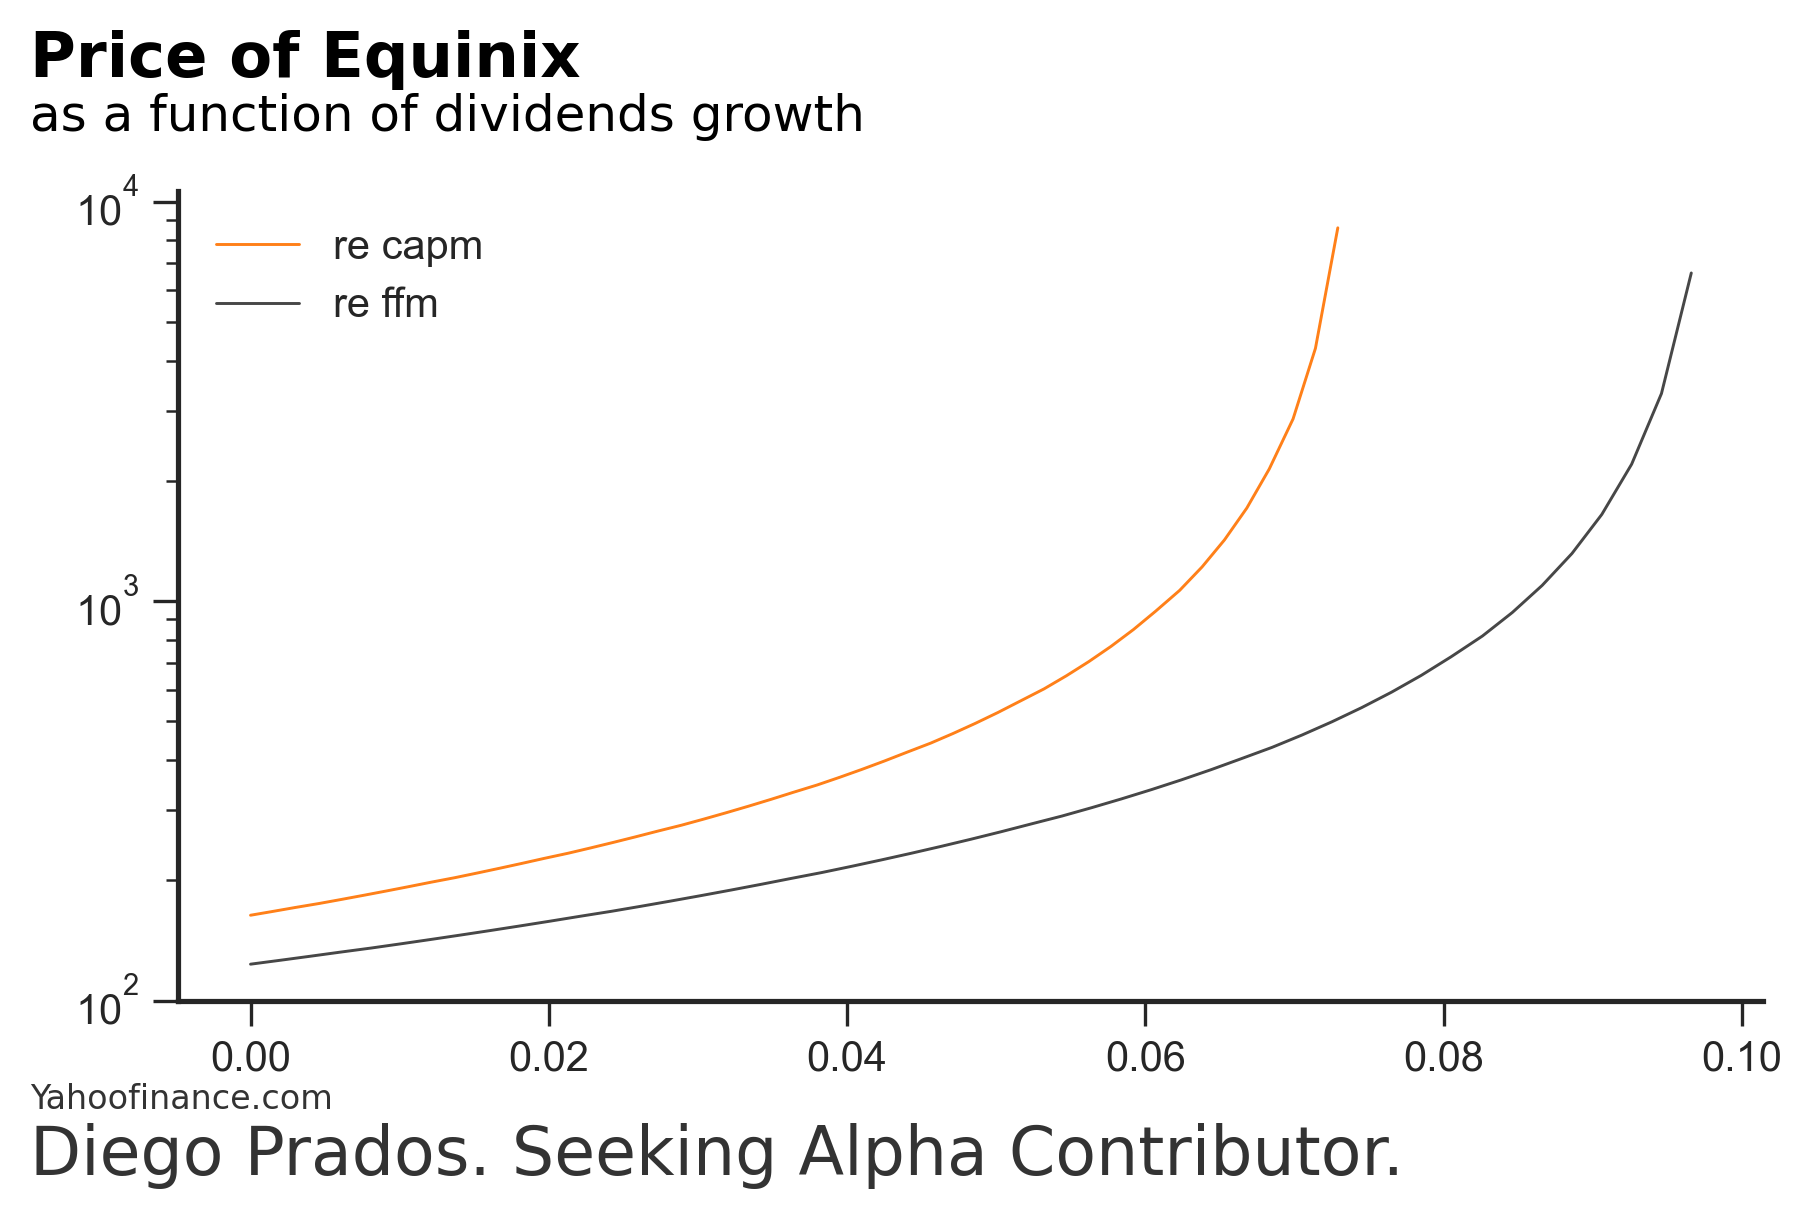
As the assumption of an 8% continuous growth rate for dividends is a very strong assumption that might not hold forever, a three-stage dividend discount model has been calculated to assess the possibility of a decline in future dividends. This model will assume that the growth rate of dividends will be 8.003% for the following three years and, after that, five years of linear decline in g will be followed by a period where it remains constant but at a lower rate (a more affordable growth rate).
As this stable growth rate can be difficult to estimate, the following table shows the expected value given different growth rates for the stable phase.
| Model | 4% | 4.5% | 5% | 5.5% | 6% | 6.5% | 7% | 7.5% |
| CAPM | 439.12 | 505.46 | 598.97 | 740.64 | 980.61 | 1475.54 | 3092.64 | … |
| FFM | 255.62 | 275.15 | 298.68 | 327.61 | 364.01 | 411.21 | 474.88 | 565.44 |
The three-stage dividend discount model shows us that with the cost of equity estimated by the three factors Fama and French model, and assuming a decline in g in the years 2025-30, the estimated value of the stock lies below the current market price. This means that if the dividend growth rate falls in the short to medium term, the present value of future dividend payments would be lower than the current price of the right to perceive those dividend payments in the future, implying an overvaluation of the stock.
Macroeconomic risks
After performing an analysis of the future dividend payments, it’s also important to take into account the impact that some macroeconomic variables could have on future returns on the stock given the current environment. As noted earlier, raising interest rates could negatively affect the company’s ability to raise more capital via debt. Equinix’s debt-to-equity ratio stands at around 1.73, hinting that debt is the preferred way to raise capital. Additionally, the maturity of the debt is mainly concentrated in the long term, as shown in the table below.
Equinix 10Q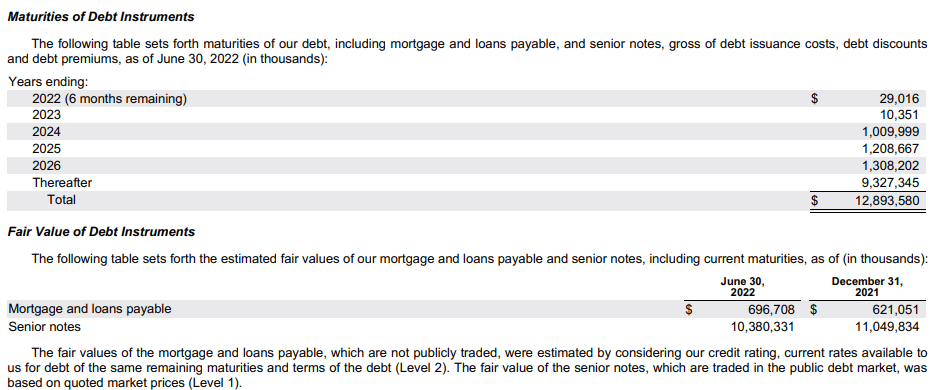
In particular, Equinix uses revolving credit facilities that give the company high flexibility in repayments and reborrowings, which account for more than 65% of the debt and around 41% of total liabilities. In January 2022, the company entered into a credit facility with a group of lenders that granted the company $4 billion of further financing with maturity in January 2027 – and Equinix has still available $3.9 billion to borrow. This credit facility is referenced by the Secured Overnight Financing Rate (SOFR) plus a differential of around 0.55%-1.2%. As the SOFR is closely related to the Federal funds rate, we can assume that the cost of future debt will increase until interest rates cease to escalate.
Furthermore, as the stock price continues to decline, it’s important to take into account that raising capital by offering new shares will be more costly due to present valuations. As the price goes down, you have to issue more shares to raise the same amount of capital, and dilution could harm the actual investor’s interest.
Record levels of inflation are also a variable that has to be taken into account. Although the company might be in a good position to efficiently transfer inflation to its customers by updating contract terms each year, rising electricity prices around the world – especially in Europe – could significantly elevate the firm’s operational costs and affect profits in the short term. Since the EMEA area supposes 32.9% of the company’s revenue, it’s very important to take this seriously as data centers are heavily dependent on this commodity.
Finally, foreign exchange risk remains one of the main concerns. As a REIT, Equinix is subject to both the 95% and 75% gross income tests. These income tests ensure that REIT revenues come mainly from real estate (75%) and its portfolio (95%), so breaking this rule could mean that Equinix could no longer operate as a REIT, damaging its tax status and the company’s profit. As the majority of the revenues and expenses are denominated in currencies different from the U.S. dollar, an increase in the value of the dollar is translating into fewer dollars collected from foreign markets.
For this purpose, there exist hedging mechanisms that allow REITs to include this income in the 95% rule. But the company is also getting income from derivatives not designed for hedging purposes. As shown in the table below, during the last three months the company has obtained $135,087,000 in revenue from these kinds of derivatives, which accounts for 7.4% of the revenues attributed to the last three months.
Equinix 10Q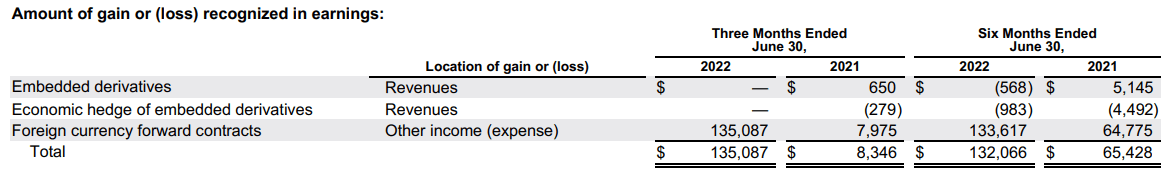
This is a difficult situation, as the company wants to earn as many dollars as possible. But if it surpasses the 5% threshold, it could put itself in a position where more dollars could be lost due to the loss of the REIT status.
Conclusion
From a valuation point of view, the scene looks bearish and the stock seems to be still highly overpriced, despite the fall from its 52-week high of around $880 in September 2021. Although fundamentals have been improving considerably during the past year, valuation multiples hint there is still more downside when comparing the stock with its peers. A valuation using dividend discount models also offers a bearish scenario for the company’s value. The assumptions regarding the dividend’s growth rate seem highly optimistic and might not hold forever.
Finally, when combining valuations with the current economic uncertainties, the short-term outlook seems unfavorable for stockholders. That’s because the company’s profits can be harmed by macroeconomic risks.
Be the first to comment