

syahrir maulana
This dividend ETF article series aims at evaluating products regarding the relative past performance of their strategies and quality metrics of their current portfolios. As holdings and their weights change over time, updated reviews are posted when necessary.
OUSM strategy and portfolio
The O’Shares U.S. Small-Cap Quality Dividend ETF (BATS:OUSM) has started investing operations on 12/30/2016 and has been tracking the O’Shares U.S. Small-Cap Quality Dividend Index since 06/1/2020. In its short life, OUSM has already changed twice underlying indexes, on 05/04/2018 and 05/31/2020, as reported by ALPS Advisors. It has 116 holdings, a distribution yield of 1.96% and a total expense ratio of 0.48%. It pays monthly distributions.
As described on O’Shares website, the index follows a strategy picking stocks in the S-Network US Equity Mid/Small-Cap 2500 Index based on rules using 4 factors: quality, low volatility, dividend yield and dividend quality. Stocks must also meet requirements in free float and average trading volume. The index is reconstituted annually and rebalanced quarterly, with constraints regarding sector exposure and a maximum weight of 2% in any constituent.
OUSM invests exclusively in U.S. companies. It is quite balanced in its top 3 sectors: industrials (22.9%), financials (21.2%) and technology (20.3%). Other sectors weigh less than 13%. Compared to the small-cap benchmark Russell 2000 (IWM), the fund overweights these top 3 sectors, along with consumer discretionary, consumer staples, utilities and communication. It ignores energy, materials, real estate and underweights healthcare.
Sector breakdown (Chart: author; data: ALPS Advisors, Fidelity)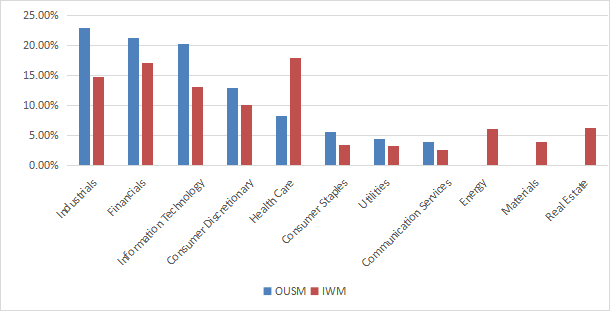
OUSM is significantly more expensive than the Russell 2000 regarding usual valuation ratios, reported in the table below.
|
OUSM |
IWM |
|
|
Price/Earnings |
13.8 |
10.43 |
|
Price/Book |
2.83 |
1.74 |
|
Price/Sales |
1.35 |
1.06 |
|
Price/Cash Flow |
14.01 |
8.79 |
The top 10 holdings, listed below with weights and some fundamental ratios, represent 21.8% of asset value. The largest holding weighs 2.38%, so risks related to individual stocks are low.
|
Ticker |
Name |
Weight |
EPS growth %TTM |
P/E TTM |
P/E fwd |
Yield% |
|
Houlihan Lokey, Inc. |
2.38% |
-10.57 |
16.83 |
18.38 |
2.33 |
|
|
Erie Indemnity Co. |
2.31% |
-5.57 |
46.56 |
44.12 |
1.74 |
|
|
Donaldson Co., Inc. |
2.19% |
18.92 |
21.76 |
19.41 |
1.59 |
|
|
Encompass Health Corp. |
2.19% |
-32.76 |
20.27 |
19.55 |
1.09 |
|
|
Juniper Networks, Inc. |
2.19% |
183.04 |
24.09 |
15.90 |
2.72 |
|
|
Graco, Inc. |
2.18% |
4.89 |
26.83 |
26.99 |
1.20 |
|
|
Old Republic International Corp. |
2.14% |
-44.88 |
8.89 |
9.08 |
8.24 |
|
|
Lincoln Electric Holdings, Inc. |
2.10% |
67.25 |
19.26 |
17.41 |
1.79 |
|
|
Jack Henry & Associates, Inc. |
2.08% |
19.95 |
40.77 |
39.73 |
0.97 |
|
|
Amdocs Ltd. |
2.06% |
-18.42 |
19.45 |
15.97 |
1.87 |
Historical performance
Since January 2017, OUSM has beaten IWM by a short margin of 40 bps in annualized return, and shows a slightly lower risk measured in drawdown and standard deviation of monthly return (“volatility” in the table below). However, the difference is not very significant.
|
Total Return |
Annual.Return |
Drawdown |
Sharpe ratio |
Volatility |
|
|
OUSM |
48.71% |
7.07% |
-38.25% |
0.4 |
18.41% |
|
IWM |
45.56% |
6.67% |
-41.47% |
0.36 |
22.18% |
OUSM outperformance in 2022 is more noteworthy: about 7 percentage points over the Russell 2000 ETF.
OUSM vs. IWM in 2022 (Portfolio123)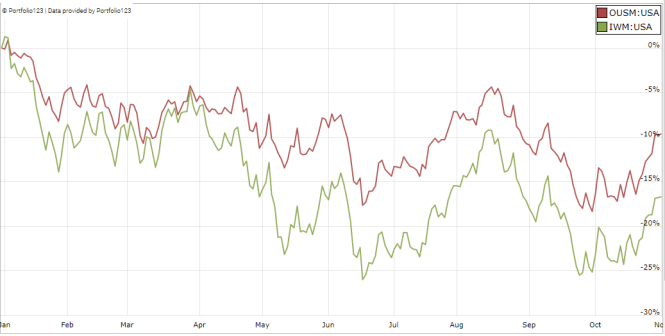
In previous articles, I have shown how three factors may help cut the risk in a dividend portfolio: Return on Assets, Piotroski F-score, and Altman Z-score.
The next table compares OUSM since inception with a subset of the S&P 500: stocks with above-average dividend yield and ROA, good Altman Z-score and Piotroski F-score, and a sustainable payout ratio. It is rebalanced annually to make it comparable to a passive index.
|
Total Return |
Annual.Return |
Drawdown |
Sharpe ratio |
Volatility |
|
|
OUSM |
48.71% |
7.07% |
-38.25% |
0.4 |
18.41% |
|
Dividend quality subset |
68.26% |
10.25% |
-38.40% |
0.55 |
19.08% |
Past performance is not a guarantee of future returns. Data Source: Portfolio123
The dividend quality subset beats OUSM by over 3 percentage points in annualized total return. However, the fund’s performance is real, whereas the subset is simulated. My core portfolio holds 14 stocks selected in this subset (more info at the end of this post).
Scanning OUSM with quality metrics
OUSM holds 116 stocks. I have scanned them with my quality metrics, considering that risky stocks are companies with at least 2 red flags: bad Piotroski score, negative ROA, unsustainable payout ratio, bad or dubious Altman Z-score, excluding financials and real estate where these metrics are less relevant. With these assumptions, 6 holdings are risky, and they weigh only 2% of asset value, which is an excellent point.
Based on my calculation, the aggregate Altman Z-score, Piotroski F-score and return on assets are better than for the Russell 2000. ROA is especially good. These metrics point to a portfolio quality superior to the small-cap benchmark.
|
Atman Z-score |
Piotroski F-score |
ROA % TTM |
|
|
IWM |
3.14 |
4.11 |
1.16 |
|
OUSM |
4.64 |
5.79 |
10.78 |
Takeaway
OUSM is a well-diversified small cap dividend ETF focused on quality. About 64% of asset value is in 3 sectors: industrials, financials and technology. Valuation ratios are more expensive than for the small cap benchmark Russell 2000, but quality is much better. It has slightly outperformed the Russell 2000 since inception, and by a wide margin in 2022 to date (7 percentage points). For transparency, a dividend-oriented part of my equity investments is split between a passive ETF allocation (OUSM is not part of it) and my actively managed Stability portfolio (14 stocks), disclosed and updated in Quantitative Risk & Value.
Be the first to comment