

gesrey
This dividend ETF article series aims at evaluating products regarding the relative past performance of their strategies and quality metrics of their current portfolios. As holdings and weights change over time, updated reviews are posted when necessary.
Strategy and portfolio
The O’Shares U.S. Quality Dividend ETF (BATS:OUSA) has been tracking the O’Shares U.S. Quality Dividend Index since 07/14/2015. It has 100 holdings, a distribution yield of 1.91% and an expense ratio is 0.48%. Distributions are monthly.
As described on O’Shares website, OUSA invests in “large-capitalization and mid-capitalization dividend-paying issuers in the United States that meet certain market capitalization, liquidity, high quality, low volatility and dividend yield thresholds. (…) The high quality and low volatility requirements are designed to reduce exposure to high dividend equities that have experienced large price declines”.
Stocks are screened and weighted based on four factors: 1) quality, 2) low volatility, 3) dividend yield and 4) dividend quality. Moreover, weight constraints are applied to constituents and sectors. Constituents are also screened for free float (shares available for purchase on the open market) and average daily trading volume. The underlying index is rebalanced quarterly and reconstituted annually. The strategy was modified in June 2020 to implement a greater emphasis on quality.
The fund invests mostly in the U.S. (96.46%) and in large and mega-cap companies (94.6%). Compared to the S&P 500 (SPY), OUSA overweights healthcare, consumer discretionary, financial, industrials and consumer staples. It underweights technology (which is the fund’s heaviest sector though) and communication. It ignores energy, materials, real estate and utilities. Sector composition may change over time.
Sector weights (chart: author; data: ALPS Advisors)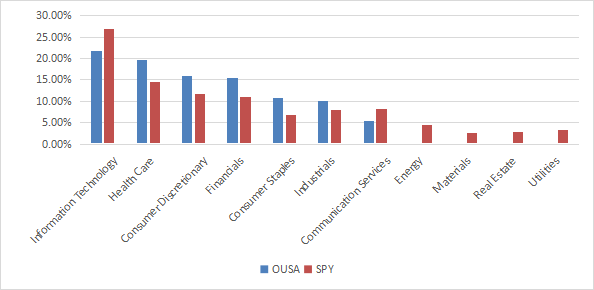
Valuation metrics don’t look attractive. Price-to-earnings and price-to-cash-flow ratios are on par with the S&P 500, but price-to-book and price-to-sales are significantly more expensive.
|
OUSA |
SPY |
|
|
Price/Earnings TTM |
19.74 |
19.63 |
|
Price/Book |
5.89 |
3.72 |
|
Price/Sales |
3.08 |
2.4 |
|
Price/Cash Flow |
15.02 |
14.98 |
Source: Fidelity
The top 10 holdings, listed in the next table with some useful ratios, have an aggregate weight of 39.9%. The heaviest holdings are below 5%, so risks related to individual stocks are moderate.
|
Ticker |
Name |
Weight |
EPS growth %ttm |
P/E ttm |
P/E fwd |
Yield% |
|
Microsoft Corp. |
4.89% |
19.73 |
25.38 |
24.14 |
1.01 |
|
|
The Home Depot, Inc. |
4.75% |
14.47 |
16.96 |
16.65 |
2.75 |
|
|
Johnson & Johnson |
4.37% |
3.44 |
24.36 |
16.60 |
2.70 |
|
|
S&P Global, Inc. |
4.18% |
31.74 |
25.79 |
30.12 |
0.98 |
|
|
Pfizer Inc. |
4.04% |
118.65 |
9.01 |
7.08 |
3.48 |
|
|
Apple, Inc. |
3.77% |
18.52 |
24.90 |
24.73 |
0.61 |
|
|
Marsh & McLennan Cos., Inc. |
3.75% |
36.57 |
23.57 |
23.08 |
1.51 |
|
|
T. Rowe Price Group, Inc. |
3.59% |
-18.33 |
10.63 |
13.23 |
4.36 |
|
|
Merck & Co., Inc. |
3.33% |
198.27 |
13.43 |
11.87 |
3.15 |
|
|
McDonald’s Corp. |
3.21% |
-11.61 |
31.41 |
25.86 |
2.17 |
Ratios from Portfolio123
Past performance
OUSA has underperformed SPY by about 1.7 percentage points in annualized return since inception in July 2015. Volatility is lower, resulting in a risk-adjusted performance close to the benchmark (Sharpe Ratio). The next table shows detailed data.
|
Total Return |
Annual Return |
Drawdown |
Sharpe ratio |
Volatility |
|
|
OUSA |
85.05% |
8.97% |
-31.40% |
0.68 |
13.38% |
|
SPY |
107.21% |
10.70% |
-32.05% |
0.71 |
15.65% |
Data calculated with Portfolio123
OUSA vs. SPY since inception (Portfolio123)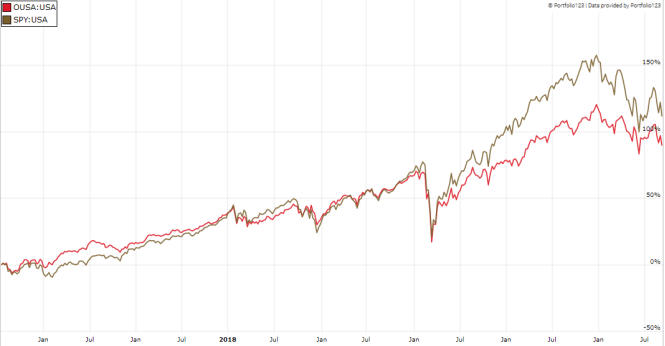
In fact, OUSA was almost on par with SPY after the market meltdown of March 2020, then it has lagged in the recovery until the last quarter of 2021. However, it has been a bit more resilient than SPY in this year’s market downturn, as shown on the next chart.
OUSA vs. SPY in 2022 to date (Portfolio123)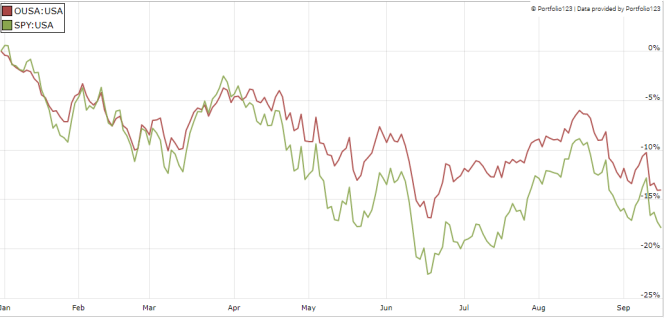
In previous articles, I have shown how three factors may help cut the risk in a dividend portfolio: Return on Assets, Piotroski F-score, and Altman Z-score.
The next table compares OUSA with a subset of the S&P 500: stocks with an above-average dividend yield, an above-average ROA, a good Altman Z-score, a good Piotroski F-score and a sustainable payout ratio. The subset is rebalanced annually to make it comparable to a passive index.
|
Total Return |
Annual Return |
Drawdown |
Sharpe ratio |
Volatility |
|
|
OUSA |
85.05% |
8.97% |
-31.40% |
0.68 |
13.38% |
|
Dividend quality subset |
114.21% |
11.22% |
-38.04% |
0.72 |
16.16% |
Past performance is not a guarantee of future returns. Data Source: Portfolio123
OUSA lags the dividend quality subset by 2.2 percentage points in annualized return. A note of caution: the ETF performance is real and this subset is hypothetical. My core portfolio holds 14 stocks selected in this subset (more info at the end of this post).
Scanning OUSA with quality metrics
In my ETF reviews, risky stocks are companies with at least two red flags: bad Piotroski score, negative ROA, unsustainable payout ratio, bad or dubious Altman Z-score, excluding financials and real estate for which these metrics are less reliable. In the case of OUSA, the only risky stock in the portfolio is Verizon Communications (VZ), which has bad Piotroski and Altman scores. It weighs just 2.19% of asset value.
According to my calculation of aggregate quality metrics reported in the next table, portfolio quality is superior to the S&P 500, as expected. In particular, the weighted average ROA is excellent.
|
OUSA |
SPY |
|
|
Altman Z-score |
4.6 |
3.4 |
|
Piotroski F-score |
6.3 |
6 |
|
ROA% TTM |
14.6 |
7.4 |
Takeaway
OUSA invests in large-cap dividend stocks, filtered and weighted with systematic rules seeking high quality and low volatility. All holdings are below 5%. Technology and healthcare are the top 2 sectors, like in the S&P 500. They weigh about 42% of asset value together. However, they are more balanced than in the broad index, which is overweight in technology. Valuation ratios are not cheap, but quality metrics are better than S&P 500 averages, especially the return on assets. OUSA has lagged the S&P 500 since inception, but underperformance is mostly due to a 1.5 year period corresponding to the 2020-2021 market recovery. The fund has beaten the benchmark in 2022. In conclusion, the low yield can’t satisfy income-seeking investors, but quality filters may become an edge in a bear market. For transparency, my equity investments are split between a passive ETF allocation (OUSA is not part of it) and my actively managed Stability portfolio (14 stocks), disclosed and updated in Quantitative Risk & Value.
Be the first to comment