

Aaron Davidson/Getty Images Entertainment
Investment Thesis
The O’Shares U.S. Quality Dividend ETF (BATS:OUSA) selects 100 of the highest-quality U.S. companies making sustainable dividend payments. Unfortunately, many other cheaper dividend ETFs follow this same strategy, so OUSA fails to stand out and its 0.48% expense ratio isn’t justified. In this article, I will describe OUSA’s fundamentals alongside two lower-fee dividend growth ETF alternatives and explain why, despite the likelihood that OUSA will perform well in the current defensive environment, it’s just not the best choice.
ETF Overview
Fund Basics
OUSA’s fund page provides some helpful basic information to get us started. The graphic below shows 17.3 million shares outstanding and an average 30-day volume close to 50,000 shares. The 30-day median bid-ask spread of 0.05% can be added to the ETF’s 0.48% expense ratio, meaning it’s an expensive product to own, especially over the long run. These fees reduce the dividend to a mere 1.89% as of November 30, 2022.
ALPS Funds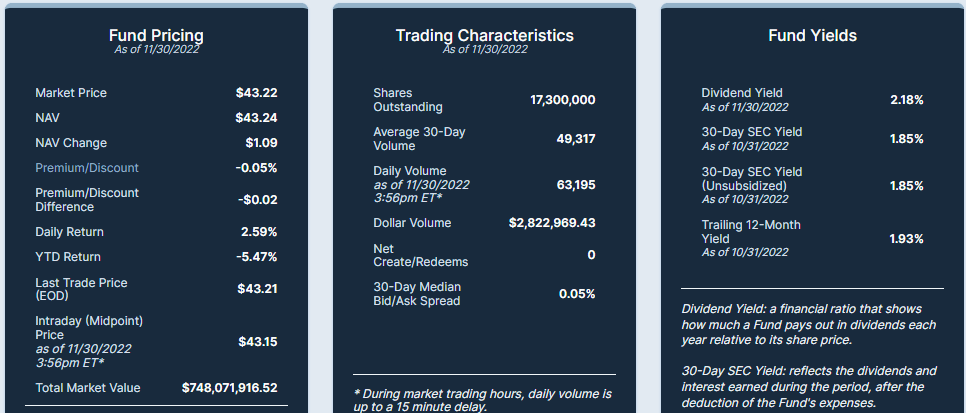
As for comparators with a similar yield, I recommend the cheaper iShares Core Dividend Growth ETF (DGRO) and the WisdomTree U.S. Dividend Growth ETF (DGRW), as these yield 2.17% and 2.01%, respectively. These ETFs also select high-quality companies, and I’ll be comparing OUSA with them in my fundamentals analysis shortly.
Strategy Discussion
OUSA tracks the O’Shares U.S. Quality Dividend Index, switching from the FTSE USA Quality/Volatility/Yield Factor 5% Capped Index effective May 31, 2020. The universe of eligible stocks is the S-Network U.S. Equity Large-Cap 500 Index, a compilation of the 500 largest stocks by market capitalization meeting free float and average volume specifications. Notably, the O’Shares Index selects companies from the following sectors:
- Communication Services
- Consumer Discretionary
- Consumer Staples
- Financials
- Health Care
- Industrials
- Technology
- Utilities
100 Index constituents are selected based on their score-modified market cap weight by evaluating quality, volatility, dividend yield, and dividend quality. The specific sub-factors used are described below.
O’Shares Investments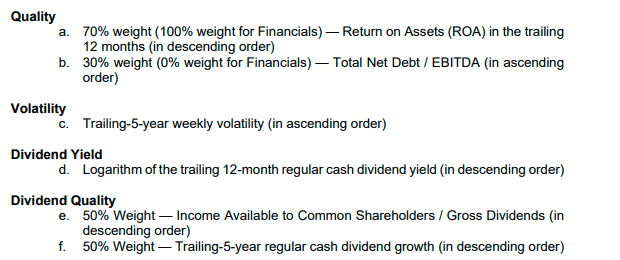
These screens ensure strong quality and profitability, but valuation screens are missing. I find this surprising, considering that Kevin O’Leary, a well-known “shark” with a reputation for not overpaying, is the Chairman of O’Shares Investments. As a result, OUSA trades at a persistent premium compared to its peers. Paying for quality is fine, but I’ll demonstrate later that the valuation is not entirely justified.
Sector Exposures and Top Holdings
OUSA’s sector exposures aren’t that much different than the SPDR S&P 500 ETF (SPY). Like DGRO and DGRW, it still has about 20% exposure to the Technology and Health Care sectors, but the difference is that it has zero exposure to Energy, Materials, and Real Estate, as noted earlier in the strategy discussion section. There were also no selections from the Utilities sector during the last reconstitution, but that wasn’t by design. Still, from a diversification standpoint, this puts OUSA at a disadvantage, though it may complement an already well-diversified portfolio.
Morningstar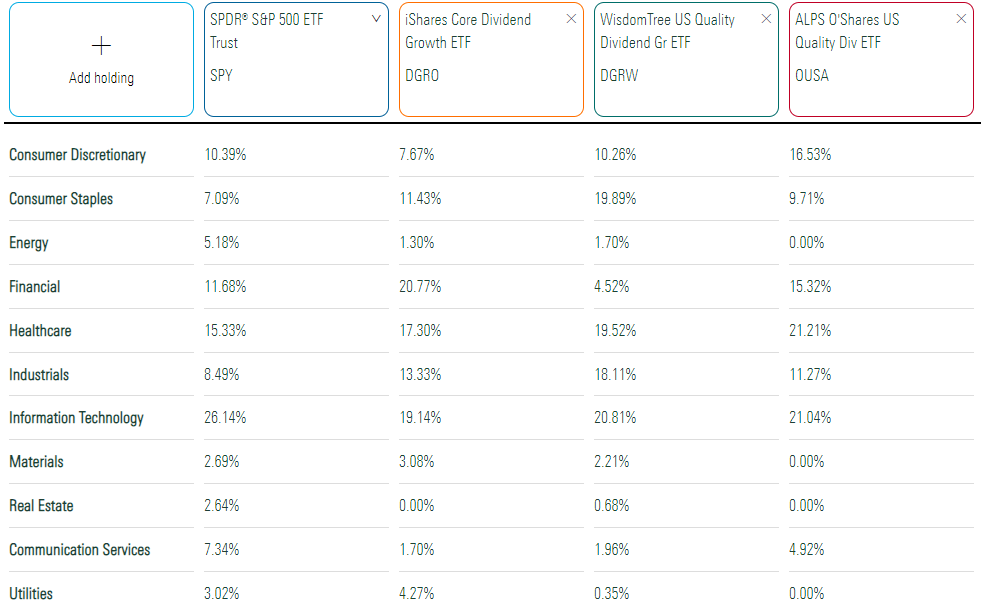
OUSA’s top ten holdings are all household names, including Home Depot (HD), Microsoft (MSFT), Johnson & Johnson (JNJ), and Pfizer (PFE). OUSA has dividend safety and consistency in mind. Out of 100 holdings, only 25/100 (13.91% of the total weight) have not raised their dividends for at least ten consecutive years. Apple (AAPL) is the sole exception in this top ten list, but it should reach Dividend Achievers status next year.
ALPS Funds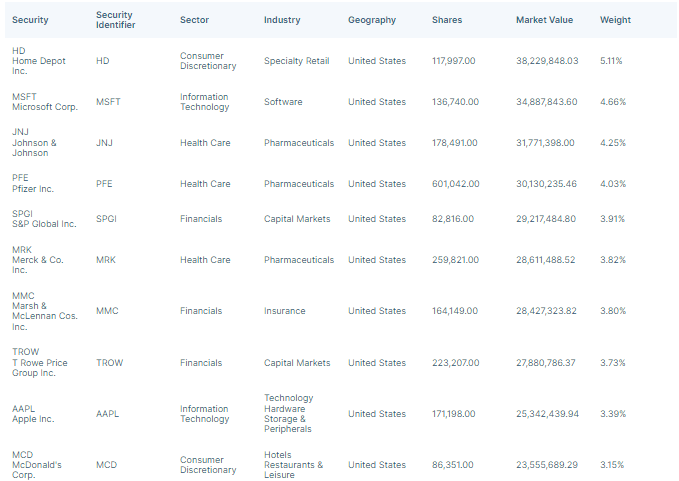
Performance
Since its launch in July 2015, OUSA has gained an annualized 10.26%, or 2.12%, and 2.21% per year lower than DGRO and DGRW. However, its selection of the highest-quality dividend stocks did result in lower volatility, as measured by standard deviation. From a risk-adjusted returns perspective, OUSA’s Sharpe and Sortino Ratios of 0.69 and 1.09 are pretty good but not as strong as DGRO and DGRW. I point this out because I want readers to understand that other ETFs also select high-quality dividend stocks, and the added safety you get from that strategy may be negligible.
Portfolio Visualizer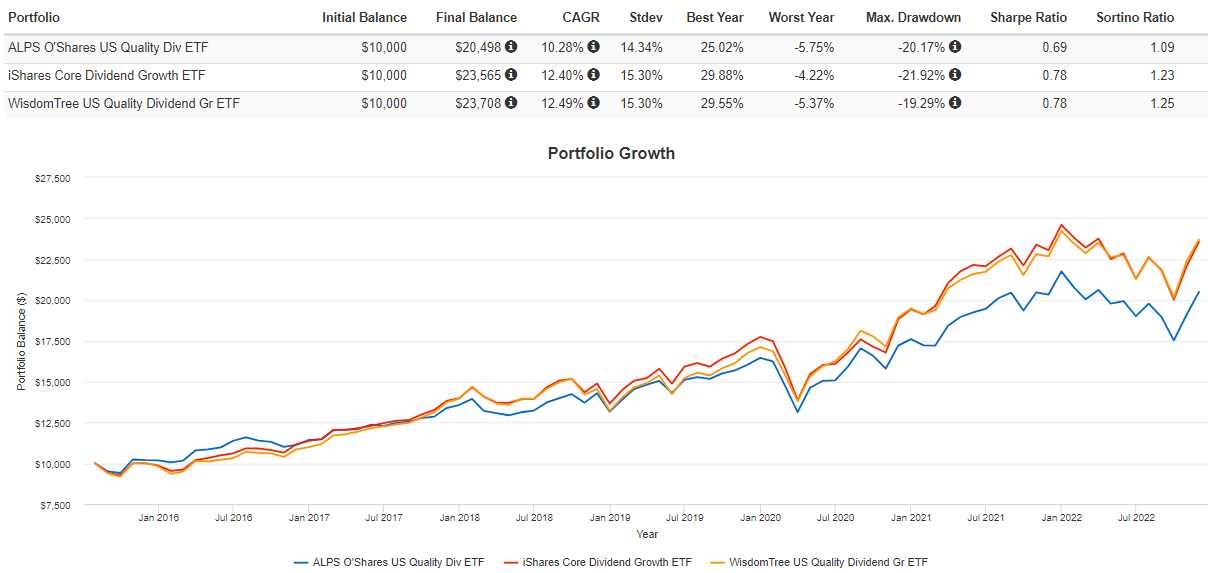
Recall that OUSA switched Indexes in June 2020. Therefore, the following chart may be more relevant. Here, the performance gap widens to an annualized 3.52% and 4.02%, respectively. Volatility remained lower, but again, it looks negligible.
Portfolio Visualizer
Fundamental Analysis
Snapshot By Company
The following table highlights selected fundamental metrics for OUSA’s top 25 holdings, which total 69.43% of the ETF. It’s a concentrated or focused portfolio, depending on how you view diversification. In the bottom rows, I’ve summarized the same fundamentals for DGRO and DGRW, which have similar features but lower expense ratios of 0.08% and 0.28%, respectively.
The Sunday Investor
DGRW looks the most competitive based on these metrics. The two have similar five-year betas, sales growth, and forward price-earnings ratios. The critical difference is that DGRW has a slightly higher earnings growth rate (11.19% vs. 10.21%) and a stronger Seeking Alpha EPS Revisions Score (5.56 vs. 5.35), but OUSA does hold slightly higher-quality stocks if profitability is the proxy. OUSA’s 9.74/10 Profitability Score was the fifth-best out of 100 large-cap ETFs I analyzed as part of my recent research on the Vanguard Dividend Appreciation ETF (VIG).
DGRO’s primary advantage is a cheaper valuation. It trades at 19.07x forward earnings, or 2.19 points less than OUSA. Its higher 0.91 five-year beta is consistent with what we saw in the performance charts earlier, but its higher volatility may be advantageous because there’s every chance markets will rally in the short term. Comments from Federal Reserve Chairman Powell on Wednesday indicated the pace of future rate hikes may slow, noting that the full effects of tighter monetary policy have yet to be felt. This flexibility may be the jolt the stock market needs, but I’m only cautiously optimistic because actual company earnings have been relatively poor recently. Yardeni Research reported that aggregate S&P 500 earnings surprises were only 3.40% last quarter, the lowest in over eight years.
OUSA Dividend Fundamentals
One reason to own OUSA is that it makes monthly distributions, allowing investors better compounding opportunities should they reinvest. OUSA last went ex-dividend on November 29, 2022, distributing $0.0785 per share, yielding 2.17% as we advance. This last payment was a remarkable 39.10% more than last November’s, reflecting how much asset prices have declined.
However, compared to September 2016, the first month where twelve preceding months of dividend payment information was available, OUSA has increased dividends by 31.46% or an annualized 4.54%. OUSA’s five-year compound annual dividend growth rate is 4.78%, much lower than the 11.40% and 13.38% growth rates for DGRO and DGRW. This low growth rate is consistent with what stable but mature companies pay, and that’s the key theme with OUSA. Growth prospects are weak, but your distributions will unlikely decrease over time.
The following table summarizes dividend metrics for OUSA’s top 25 holdings, including Seeking Alpha Factor Grades that I’ve normalized on a ten-point scale. While these metrics indicate an improved five-year dividend growth rate for OUSA based on its current holdings (11.10%), they also strongly suggest that DGRW is the better all-around dividend ETF. DGRW’s factor scores on dividend safety, consistency, yield, and growth are all superior.
The Sunday Investor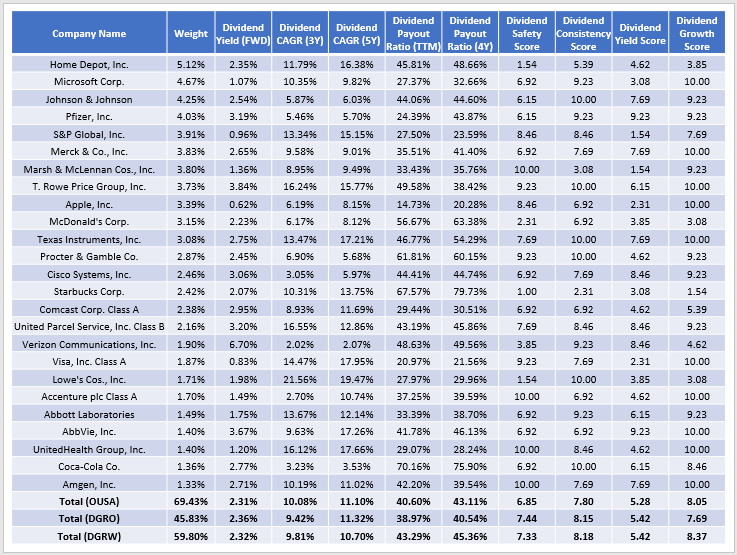
OUSA’s estimated yield can be calculated by subtracting its 0.48% expense ratio from its constituents’ gross 2.31% dividend yield to net 1.83%. DGRO’s net yield is roughly 2.28%, while DGRW’s is 2.04%.
Investment Recommendation and Conclusion
This article is my third review of OUSA, and I’ve concluded that three key issues are that it doesn’t include a valuation screen, its dividend yield and growth are typically low, and its lack of uniqueness doesn’t justify its high expense ratio. This last point is important because this article demonstrated how DGRW, and to a lesser extent, DGRO is a cheaper and more diversified alternative with a similar valuation and better dividend yield and growth features. Therefore, while OUSA isn’t a bad choice in the current defensive environment, investors can do better, and I would advocate for those alternatives instead. Thank you for reading, and I look forward to answering any questions in the comments below.
Be the first to comment