

NicoElNino/iStock via Getty Images
The risk of paying too high a price for good quality stocks- while a real one – is not the chief hazard; the chief losses to investors come from the purchase of low-quality stocks at times of favorable business conditions. – Benjamin Graham
Introduction
It has been well documented on these pages, and in other places, that large parts of the globe, particularly the US, are well underway in transitioning into an environment where financing conditions will be more stringent. In an environment where easy money will be hard to access, and the cost of capital is likely to be elevated, smart investors will become more discerning and gravitate to stocks that figure high on the “quality factor” scale.
For the uninitiated, quality factor stocks are generally thought to be stocks with characteristics such as low earnings volatility, low stock volatility, low financial leverage, high margins, high turnover ratios, consistent asset growth, low financial & operating leverage, and high corporate governance.
Clearly, there are a lot of screeners to consider, and you would think it would be particularly challenging to build a portfolio of stocks that score highly on all those fronts, but the O’Shares FTSE U.S. Quality Dividend ETF (BATS:OUSA) makes a good fist of things and attempts to build a portfolio of 100 odd stocks that figure high on some of those metrics, which is then also further substantiated by a useful dividend angle.
In this article, I’ll cover some of the standout themes of this ETF. Investors can then decide if they’d like to go ahead with it.
Multi-pronged screening
OUSA tracks the O’Shares U.S. Quality Dividend Index which is constructed using a rules-based proprietary methodology. The intention here is to pick out stocks that screen fairly highly across four broad buckets: a) quality; b) low volatility; c) dividend yield; and d) dividend quality.
Quality is gauged by identifying companies with a strong profitability quotient as well as low leverage. The volatility screen then helps reduce exposure to companies with volatile price movements. The yield screener then picks out stocks with high dividend yields. Finally, the dividend quality screener helps add more weight to the dividend yield screener by picking out stocks that have high excess free cash flow to distribute as dividends, plus those that have grown dividends over time. They also attempt to weed out stocks that are prone to dividend cuts or suspensions. Stocks are then weighted based on the market cap and the four major screens, with particular emphasis given to the quality and volatility screens.
Considering the different levels of screening involved, OUSA has been able to produce a portfolio with some impressive credentials. Note that it fares better than the Russell 1000 value index across the barometers of profitability, leverage, dividend growth, and volatility
OUSA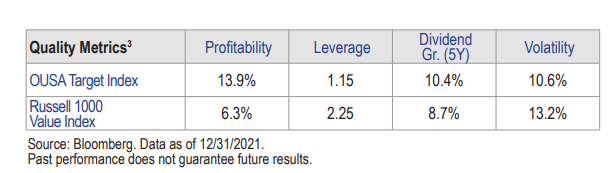
Healthcare
The healthcare sector accounts for the bulk of OUSA’s holdings, with a weight of 24%. As noted in The Leaders-Laggers section of The Lead-Lag Report, this is a sector that will likely have the necessary chops to perform well in a cyclical downturn. Also, as shared with my subscribers, a ratio measuring healthcare stocks against the broader markets appears to have formed a reversal rounding pattern, which bodes well for the bulls.
Dividend
A yield of 1.7% may not be the most eye-catching, but this is still better than the asset class median of only 1.3%. OUSA also has a lot of dividend payers in its portfolio, and, as noted recently, whilst the short-term trend may be choppy for dividend stocks, the long-term trend looks resilient. This is a bucket that will likely do well in a risk-off environment; if you’re a subscriber of my report, you’d note that I’ve been talking up the prospects of deflation risks further down the line, and dividend stocks may prove to be a useful arena for investors to take refuge in.
Large-cap value
If you follow me on Twitter, you’d note that I tend to use the Twitter spaces platform for regular debates across different investing topics. In late Feb, I debated the prospects of value investing with Tobias Carlisle, a noted portfolio manager.
OUSA is essentially a large-cap (all of its constituents have a market cap of over $12.9bn) value portfolio, and the mean-reversion theme is something that continues to hover in the shadows.
Twitter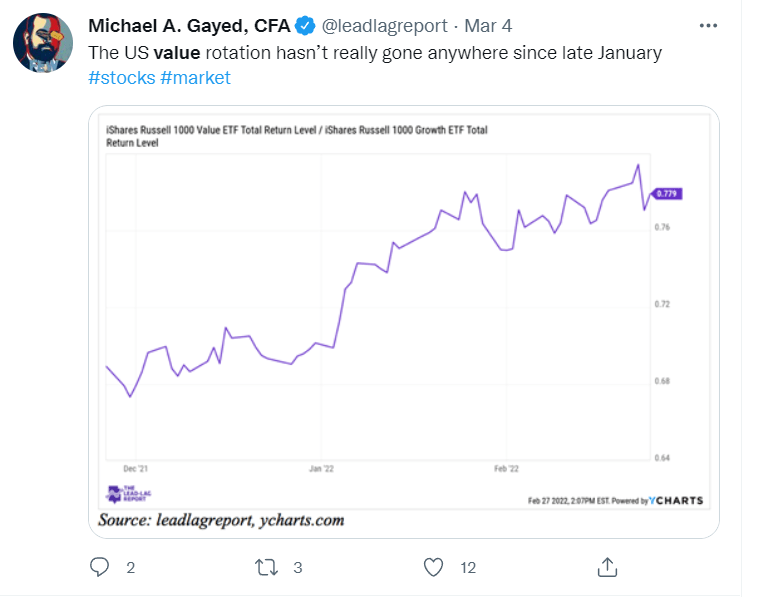
Admittedly, even though the growth-to-value rotation hasn’t quite kicked off in a big way this year, you can’t disregard the longer-term opportunity. This is particularly true when you consider that the large-cap value-to-growth ratio hasn’t even reached the pre-pandemic levels from before 2020.
Stockcharts.com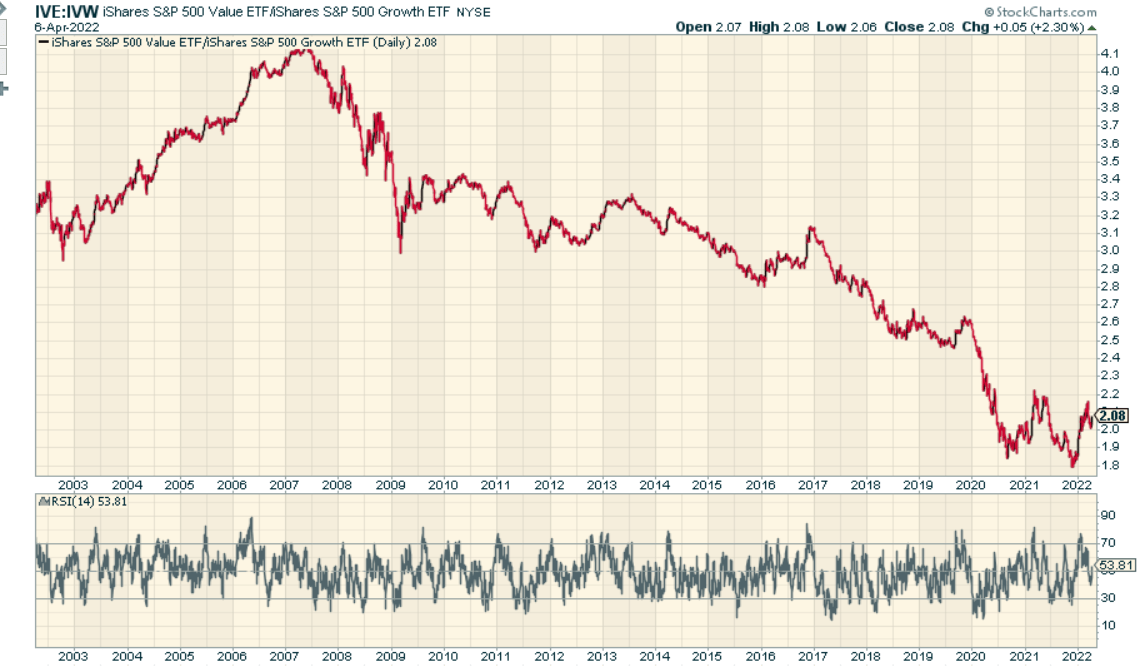
Conclusion
From a valuation perspective, too, OUSA appears to be fairly well-positioned. The ETF currently trades at a forward P/E of 17.7x vs the corresponding multiple of 20.2x for the SPY.
 Anticipate Crashes, Corrections, and Bear Markets
Sometimes, you might not realize your biggest portfolio risks until it’s too late.
That’s why it’s important to pay attention to the right market data, analysis, and insights on a daily basis. Being a passive investor puts you at unnecessary risk. When you stay informed on key signals and indicators, you’ll take control of your financial future.
My award-winning market research gives you everything you need to know each day, so you can be ready to act when it matters most.
Click here to gain access and try the Lead-Lag Report FREE for 14 days.
Be the first to comment