


kennethnokman/iStock via Getty Images
Investment Thesis
Orion Office REIT (NYSE:ONL) is a newly established REIT focusing on the single-tenant suburban office market. It started life at a time when the US economy is experiencing high inflation with signs of a recession.
ONL has challenges with lease renewal. It also had to contend with asset impairments. As such you should not be surprised that the current market price is about half of its “IPO” price.
But the market has overreacted. A conservative analysis shows that the market price is significantly below a worst-case estimate of the NAV and FFO. This is a deep-value investing opportunity with a margin of safety for its current 4% dividend yield.
Key drivers
ONL became operational at the end of 2021 following a corporate exercise involving VEREIT and Realty Income (O). Any information of its performance before this corporate exercise was “proforma” based.
As such the “real” performance of ONL started in 2022. To get clues about the prospects of ONL, I prefer to rely on the 2022 quarterly results rather than the pre-2022 performance.
The prospects of ONL depend on growing its properties and maintaining a high occupancy level. These in turn depend on the demand for single-tenant suburban offices. It would also depend on management’s ability to source new properties as well as secure the tenants.
In its Information Statement issued in 2021, ONL presented a positive picture of the demand for net lease single-tenant suburban offices. It also made the case that the management team had the experience to source new properties and tenants.
With only 20 odd management staff, ONL was set up to focus on net lease single-tenant buildings and “deal-making”.
Were these propositions supported by the past 9 months’ performance? To answer them, I looked specifically at the following:
- About half of the leases will mature from 2022 to 2024. Were there clues to indicate that ONL would be able to renew them?
- Growth has to come from both organic and inorganic growth. The former will come from increased rental while the latter will come from new properties. How had ONL performed in these areas so far?
- To maintain its leverage position, new purchases would be funded through new capital and debt. Can this be done that is value accretive to investors going in now?
I will show that the answers to these are affirmative. I will also show that assuming a worst-case scenario, there are margins of safety based on the FFO and NAV. As such this is an investment opportunity for a long-term value investor.
Lease renewal
In its Information Statement, ONL stated that 1,168,000 sq ft was expiring in 2022. Refer to Chart 1.
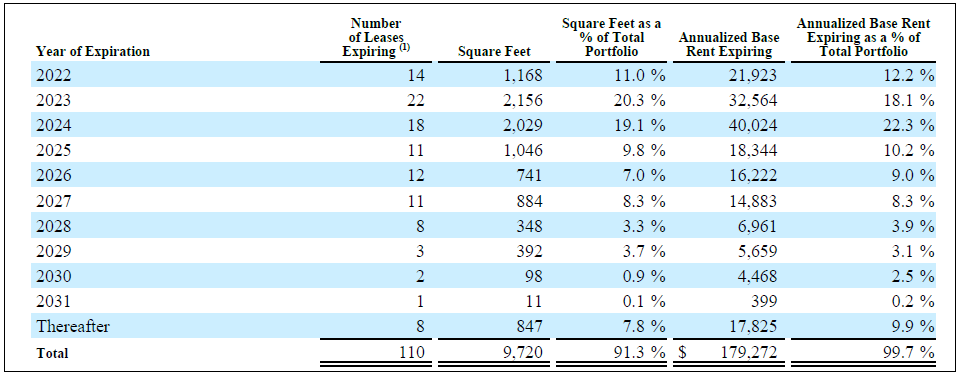
Chart 1: Lease Details (ONL Information Statement 2021)
The past 9 months data showed that ONL faced challenges in renewing the leases that were maturing. In its Nov 2022 Investor presentation, ONL stated the following achievements:
- Signed early lease extension for 11 years with tenant at Orion’s largest property in Hopewell, NJ in November 2021 (482,000 sq ft).
- In 2022, completed more than 498,000 sq ft of renewal, expansion and new leases.
But I could not reconcile them with the 420,000 sq ft reported under the Leasing Activity and Capital Expenditures section, Q3 2022 Form 10Q. Based on that data, I estimated that about half of the leases maturing in the first 9 months of 2022 were renewed as shown in Table 1. Furthermore, for the leases that were renewed, there was a 4.2% decline in the average rental.
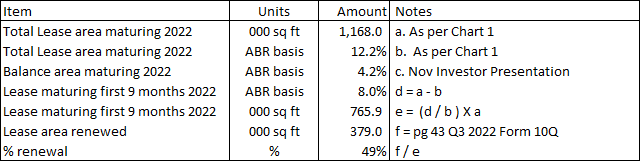
Table 1: Estimating the % of lease renewed (Author)
Notes to Table 1
a) ABR = Annualized Base Rent
ONL also provided % occupancy data. As of Sep 2022, its portfolio had an 88.2% occupancy compared to 94.4% occupancy at the end of 2021. But this is not an accurate picture as the number of properties had reduced from 91 at the end of 2021 to 87 at the end of Sep 2022.
Accounting for the areas sold, the vacant area as of Sep 2022 was about the same as that at the end of 2021. Refer to items (d) and (i) in Table 2. In other words, ONL managed to maintain the same occupancy rate if the properties sold were taken into account.
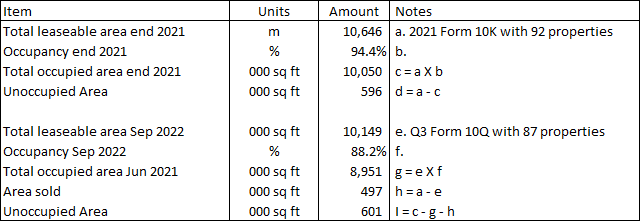
Table 2: Estimating the vacant areas (Author)
While there are challenges to renew the lease and or to secure new leases, management was able to maintain the occupancy. But this was due to selling off properties that have profit or loss implications.
The US is currently experiencing high inflation and there are signs of a recession. This may account for the leasing situation. The concern is that the economy is not going to improve any time soon and the lease extension and occupancy for 2023 could be similarly affected.
Organic growth
As most of the properties are net lease, there are very few opportunities for ONL to achieve better area utilization. In other words, any organic growth will depend mainly on annual rental increases.
It is Nov 2022 Investor presentation, ONL had stated that it has annual rent escalations. However, it did not provide any number for this. But we can get some idea from the following stated in its Q3 2022 Form 10-Q:
Including the rental revenue from the VEREIT Office Assets for… nine months ended September 30, 2021, rental revenue decreased by… USD 3.1 million… compared to the same periods in 2021, primarily due to our lower occupancy rate and property dispositions. Including VEREIT Office Assets, our portfolio occupancy rate would have been 93.9 % as of September 30, 2021, and our portfolio occupancy rate was 88.2 % as of September 30, 2022.
The 9 months rental as of Sep 2022 was USD 157.3 million. Based on the rental and occupancy figures, I estimated that ONL was able to achieve an annual rental increase of 13.2% as illustrated in Table 3.
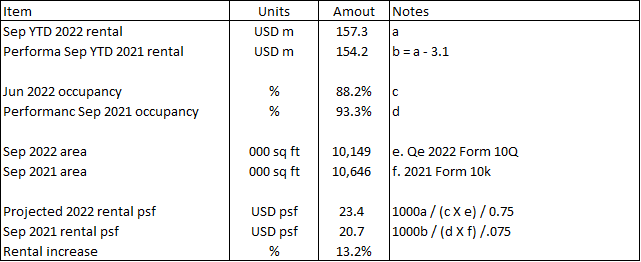
Table 3: Estimating annual rent increase (Author)
This is of course a back-of-envelope calculation. But it does illustrate that the organic growth through annual rent increases can be higher than the long-term GDP growth rate.
Acquisitions and dispositions
During the nine months ended September 30, 2022, ONL closed on the sale of five non-core office properties for an aggregate gross sales price of USD 23.1 million.
There were no direct acquisitions of properties reported as of Sep 2022. Note that I ignored those results from the Arch Street Joint Venture. While ONL had stated that there is a pipeline of potential acquisitions, I suspect that growth here would be challenging over the next few years.
Given these, a conservative picture of the next few years should exclude inorganic growth.
Margin of safety from NAV
The value of a REIT is the value of its properties. The tangible Book Value of ONL is USD 13.70 per share (Sep 2022) compared to its market price of USD 9.18 per share (2 Nov 2022). Is the market suggesting that the properties are overvalued and are expected to be impaired by 1/3?
One could argue that the 1/3 decline is because of its Note 5 in the Sep SEC filings. For the YTD Sep 2022, ONL identified 10 non-core properties for sale amounting to USD 98.6 m. ONL provided USD 54.2 million (55%) impairment for these.
But this does not mean that all the other properties would have this rate of impairment. When the properties were transferred to ONL as part of the corporate exercise, they were based on fair market values.
The allocation of the purchase price is based on an assessment of estimated fair values of the land, building, and improvements, and identified intangible assets and liabilities, and is often based upon various characteristics of the market where the property is located.
Source: Information Statement, Orion Office REIT Inc provided to Realty Income Stockholder.
The fair market values were determined only a year ago. They were also based on a post-2020 Covid-19 situation. As such they should represent reliable values of the properties. In other words, I do not expect all the properties to be impaired by 55%.
Generally, you would rely on the NAV to provide a picture of the value of the properties. Because the “fair values” were determined only a year ago, I would take the Book Value as a conservative estimate of the NAV.
Projected performance
For the 9 months ended Sep 2022, ONL achieved USD 157 million gross rent and USD 78 million of loss before tax. But its FFO for the period was USD 77 million.
This situation of a loss before tax but a positive FFO is because a significant part of the operating expenses is for depreciation.
For YTD Sep 2022, the depreciation accounted for about 64% of the revenue. Contrast this with those for VEREIT and Realty Income of 39% and 5% of their respective revenues.
There are several ways for this depreciation margin to come down.
- Rent has to increase significantly.
- The depreciation rate has to be reduced.
- Properties have to be impaired.
I am not sure whether any of the above can be achieved over the next few years. This meant that mismatch between the Net Income and FFO would be there for some time.
I have earlier shown that ONL was not able to renew all the lease maturing thus lowering the occupancy. Furthermore. The renewals resulted in lower rental rates. But the annual rent increase was able to offset some of these negative impacts. At the same time, there were impairments.
You can see that there are several moving parts. To get a sense of the impact on the FFO and NAV, I created a financial model of ONL based on occupancy, average rent, and impairments.
Operating Income = Gross rent – Operating Expenses
Net Income = Operating Income – Interests – Impairment
FFO = Operating Income + Depreciation
NAV = Opening Book Value + Net Income
The workings and assumptions used in the model are shown in Table 4. I assumed that the current economic situation would last till 2024 and improve thereafter. If I could estimate the FFO and NAV for 2024, I would have a worst-case scenario.
The key assumptions were:
- There was no growth in the total available leasable area.
- As the lease matures, only half would be renewed.
- On a company level, there would be a 5% annual rent increase.
- The non-renewed areas would be impaired at 55% of the asset value.
- The 2022 values were based on the Sept 2022 results.
- The interest expenses remain the same as that for 2022.
You can see that the occupancy and real estate value would be declining – refer to item (f) and (g) in Table 4. ONL will continue to have a net loss – item (q) with positive FFO – item (r).
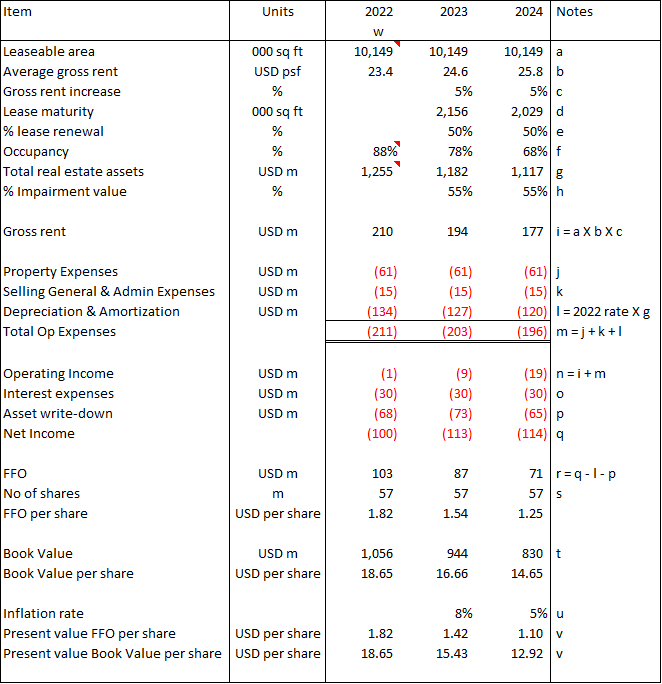
Table 4: Projecting FFO and Book Value (Author)
Notes to Table 4
a) Assumed that new properties acquired will be offset by those sold. In other words, there is no inorganic growth during the forecast period.
b) Derived as per Table 3.
c) Assumed long term GDP growth rate.
d) As per Chart 1.
e) Assumed as per Q3 2022 YTD performance.
f) Computed based on previous year occupancy less vacant area as per (e).
g) Value in previous year less Assets write-down.
h) Assumed the Sep YTD 2022 rate.
i) Computed based on average rent X area.
j) Based on 2022.
k) Based on 2022.
l) Based on 2022 rate for total real estate value.
m) Total Op expenses.
n) Gross rent less Total Op expenses.
o) Assumed same as 2022.
p) Assumed those lease area not renewed to be impaired X impairment % Value of impaired assets = proportionate of previous year Total estate value.
q) Assumed no tax.
r) Net Income + Depreciation + Impairment.
s) Remain the same as that of Sep 2022.
t) Previous year value less impairment.
u) Assumed.
v) Discounted at inflation rate.
w) 2022 values extrapolated based on Q3 2022.
I looked at 2 metrics – FFO per share and NAV (assumed to be Book Value) per share in 2024.
Instead of just looking at the values in 2024, I also estimated the present value assuming 8% inflation in 2023 and 5% in 2024.
Based on the financial model, I estimated the following for ONL:
- Present value of FFO = USD 1.10 per share.
- Present value of NAV = USD 12.92 per share.
Margin of safety for Dividends
I projected that ONL would pay a total dividend of USD 0.40 for 2022. This is equal to a dividend yield of 4.4%. I would argue that this is a secure dividend yield for 2 reasons:
- The USD 0.40 dividend is significantly lower than the current FFO of USD 1.81 per share. This was based on a straight-line extrapolation of the Sep YTD 2022 FFO per share.
- Based on the financial model, the present value of the FFO is USD 1.10 per share
For the projected years, ONL would be incurring annual losses before tax. In other words, ONL can continue to pay USD 0.40 per share annual dividend as it has the FFO to do so and is not tied to the taxable income criteria.
Can inorganic growth be value accretive?
ONL currently has a Total Debt Equity ratio of 57%. For it to maintain this leverage ratio, the funding for new properties has to be a combination of new equity and new debt.
Unfortunately, new equity will mean more shares. To ensure that the shareholders coming in today do not lose out, the resultant FFO per share must then be higher than the pre-equity issuance FFO per share. This will depend on:
- The number of shares to be issued. This in turn will depend on the value of the properties and the share price. I would argue that given the low share price, the likelihood is that the share price in the future (post-2024) will be higher than what it is today.
- The proportion of organic and inorganic growth.
I set up a simple financial model to look at the impact of growth on the FFO per share. Refer to Table 5. I tied the values in Table 5 to those in the earlier tables where appropriate.
In the model, I linked the growth in new properties to the new equity and debt. I assumed that the Debt Equity ratio would be maintained. The number of new shares to be issued would then depend on the new share issuance price.
FFO = FFO before growth item (a) + FFO from organic growth item (p) + FFO from new properties item (n)
Total number of shares = Pre-funding shares item (b) + new shares issues item (l)
Resultant FFO per share = FFO / Total number of shares
You can see that the FFO per share before any growth was USD 1.25 per share – item (a/b)
Assuming no change in the share price, 5% organic and 10% inorganic growth, we have a situation where the resultant FFO becomes USD 1.26 per share – item (s)
The analysis shows that it is possible to acquire new properties via the issuance of new shares that would be value accretive. But this only applies to investors who go in currently as the share price is low.
When the market sentiments improve in 2025 or beyond, the new share issuance price would be higher. This would mean a lower number of shares to be issued compared to if they were issued at the current price. In other words, it would also be value accretive to investors who go in currently.
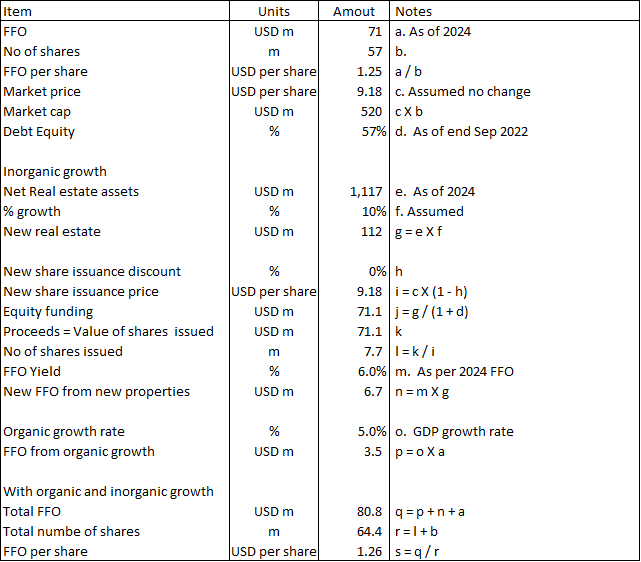
Table 5: Determining whether it is value accretive (Author)
Conclusion
The challenge with analyzing ONL is that we are peering into the future based on a limited track record. My analysis thus focuses on whether the current market price has overshot the worst-case scenario.
The results of my analysis confirm this overshot scenario:
- The current market price is significantly below the current NAV and projected worst-case NAV.
- The dividend is significantly below the current FFO and projected FFO.
When the market improves and ONL embarks on its growth program, the new share issuance would be value accretive for those investing at the current price.
I would admit that my analysis is mainly a financial one. It assumes that the net lease suburban office market is the correct niche for ONL. It also assumed that management would be able to deploy its “deal-making” experience to deliver rental growth. Thereafter it would also be able to deliver inorganic growth.
If you buy into ONL narrative about the suburban office demand and management capabilities, the current market price is a good entry price.
Author comments
You will note that there is a lot of financial modeling and much of my analysis was to gather info to feed into the various models.
When I first started to invest in REITs, I focused on prices that were less than the FFO or the NAV. I did not consider whether the price would drop in the future.
Unfortunately, I went in when the property market was hot, i.e. REIT prices were high. When the property market cooled down, the REITs continued to acquire new properties as they were cheaper. But the REIT prices had also declined.
This meant that the new shares were issued at prices lower than my entry cost. The net effect was that there was a reduction in the FFO per share compared to when I first bought it.
You know what this meant – I could not get the capital gain. In some instances, even after 10 years, the cumulative dividends could not cover the capital loss.
That is why when looking at REITs, I now also consider the value accretive impact of new acquisitions. But you need financial models to get a sense of this.
As an aside, investors who bought ONL when the prices were double the current ones are likely to face the problems I went through. The cumulative dividends over the years may not offset the capital loss.
ONL is good for those coming in now but bad for those who went in a year ago.
Be the first to comment