

asbe/iStock via Getty Images
Executive Summary
Boasting a track record of top-notch comparable sales growth, O’Reilly Automotive (NASDAQ:ORLY) has and will continue to have the allure of being one of the most reliable compounders out there. In our opinion, shares are overlooked by investors who seek to build an inflation-proof portfolio.
First of all, the steady secular growth trends for the automotive aftermarket industry remain intact. This is especially true in the light of current economic events. In a world of heightened inflation, economic growth scare and uncertain monetary and fiscal policy, investors are on the lookout for all-weather stocks. The current inflationary shock is likely to persist into 2023 and even 2024. Those who painted a rosy outcome by calling it transitory have recently turned hawkish. Not to mention a new series of supply chain disruptions being exacerbated by the ongoing war in Ukraine and the Chinese zero-COVID policy.
With household disposable income falling, ORLY’s indispensable and counter-cyclical business is at the forefront of delivering attractive risk-adjusted returns on a multi-year time frame. Having said that, management’s strategic capital allocation decisions should bear fruit in the short term as well, thanks to the asset-light nature of the business and ORLY’s reputation of under-promising but over-delivering.
Historically speaking, spiking inflation rates induced a period of economic weakness, but this time the situation could turn out to be much worse with quantitative easing being wound up and borrowing costs rising sharply. Those market environments have generally benefited ORLY’s sector as consumers stick to their cars longer and dedicate a sizable portion of their wallet to maintenance and repair. Given ORLY’s high-quality features that have persisted since its IPO, we rate shares a “BUY” with projected annualized returns in excess of 14%.
Robust Comparable Sales And Earnings Growth Regardless Of Economic Outlook
Initially, inflation was the main issue for investors to tackle. However, one should not lose sight of cooling economic growth either. In an environment of stagflation ORLY’s business should be better positioned than the average American company. Having IPOed back in 1993, ORLY has since capped off each year with average same store sales growth of +6,3%, thereby outperforming its nearest competitor AutoZone (AZO). Regardless of inflationary concerns and falling consumer confidence, ORLY’s business evolution as measured per same stores sales growth speaks for itself.
Option Generator Research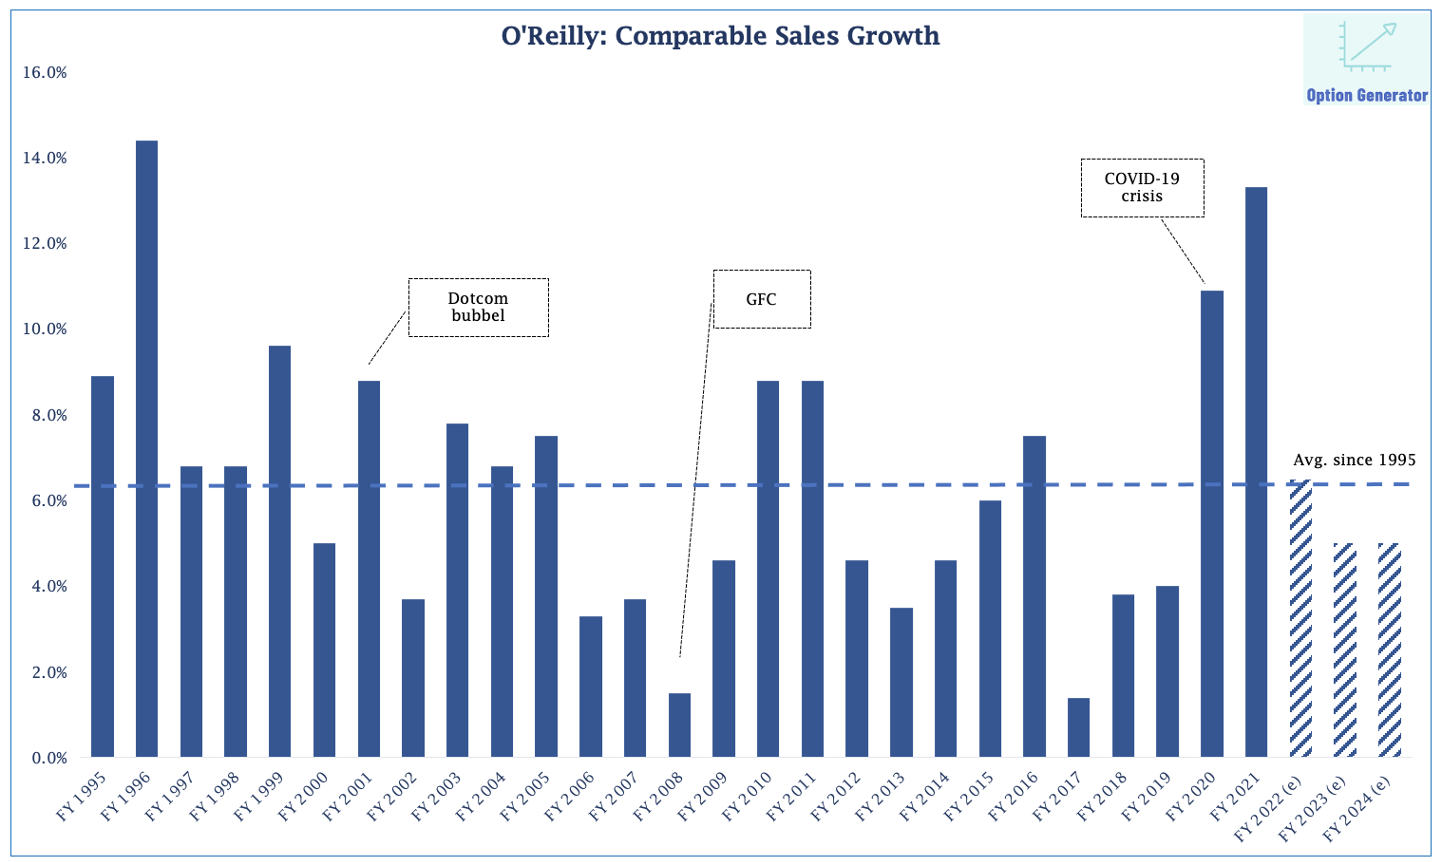
Guiding for 5% to 7% comparable sales growth in FY22 at the latest conference call, the near-term outlook remains favorable as strong ticket count growth on the professional side offsets a more difficult comparison for its DIY segment. Taking the latest government stimulus during calendar 2021 into account, ORLY’s management has conservatively penciled a flattish year-over-year performance for the latter. Still, as ORLY’s management team declared during the FY21 conference call, its initial guidance has never been this bullish.
Our expectations are to generate positive comparable store sales growth on both sides of our business, with stronger growth on the professional business. This range and corresponding expectations for the coming year are higher than we can remember ever providing in our initial annual guidance. (CEO Greg Johnson on February 10th, 2022)
Remarkably consistent earnings growth demonstrates the effectiveness and counter-cyclicality of ORLY’s long-term oriented strategy. Its top line figures are not tied to changes in GDP neither to fluctuating (light) vehicle sales. And whilst we are not counting on 20+% annual EPS growth over the next three years, we do see a good chance for ORLY achieving 12% to 15%.
Option Generator Research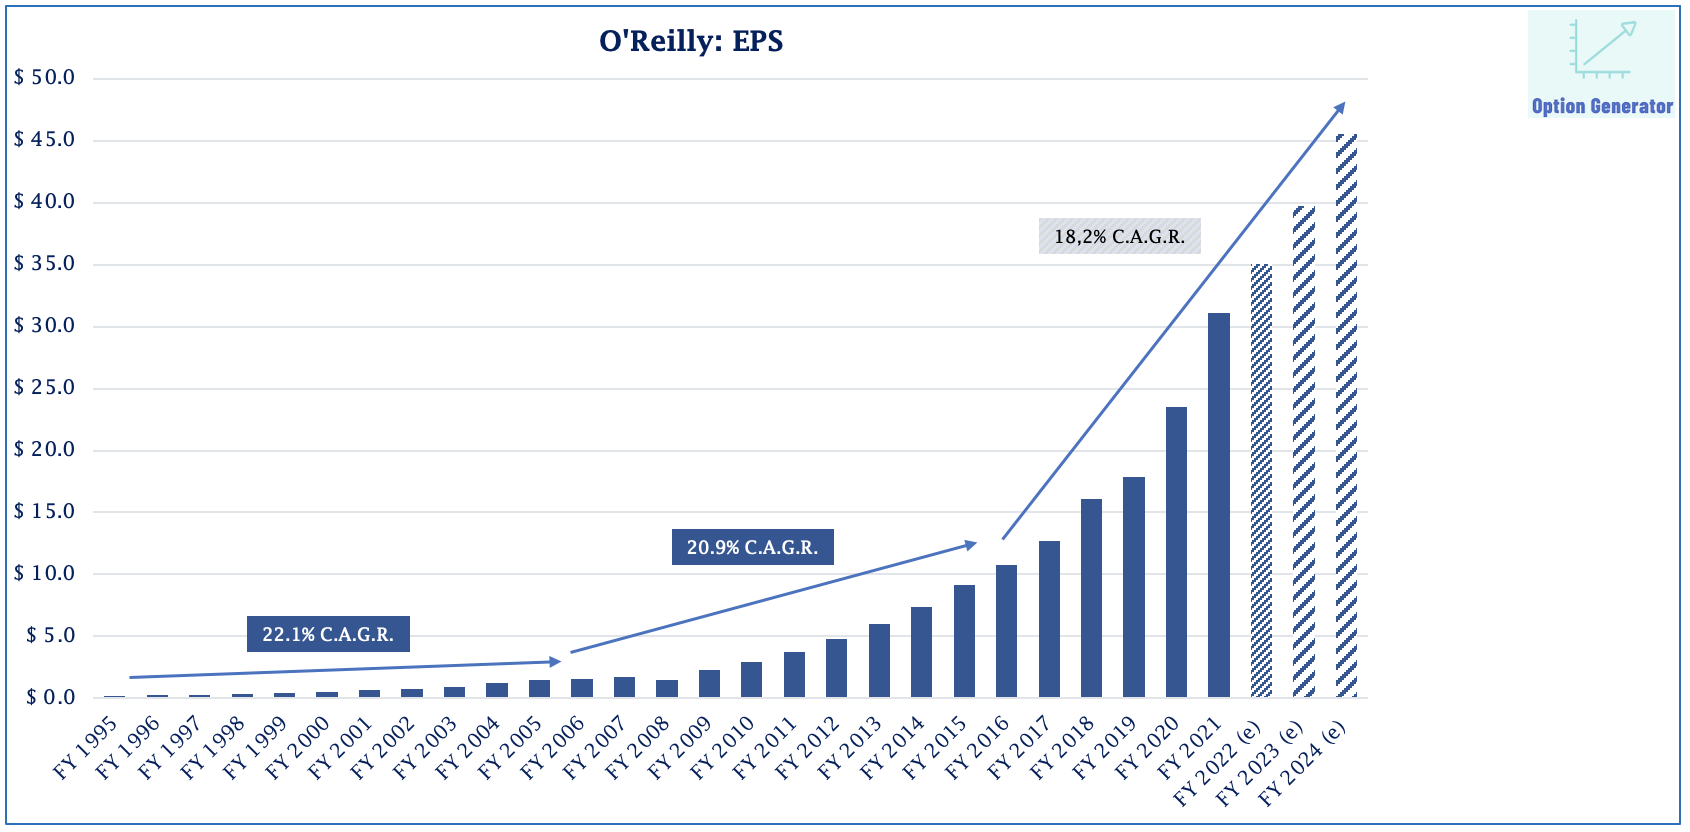
Store Count Expansion To Take Share In Unsaturated Markets
Ever since O’Reilly became a publicly traded company in 1993, topline growth has been buoyed by consistent comparable sales growth, positive pricing and store count growth. The latter played a key role in reaching sufficient scale during the period 1993-2008, as indicated by the graph below.
Option Generator Research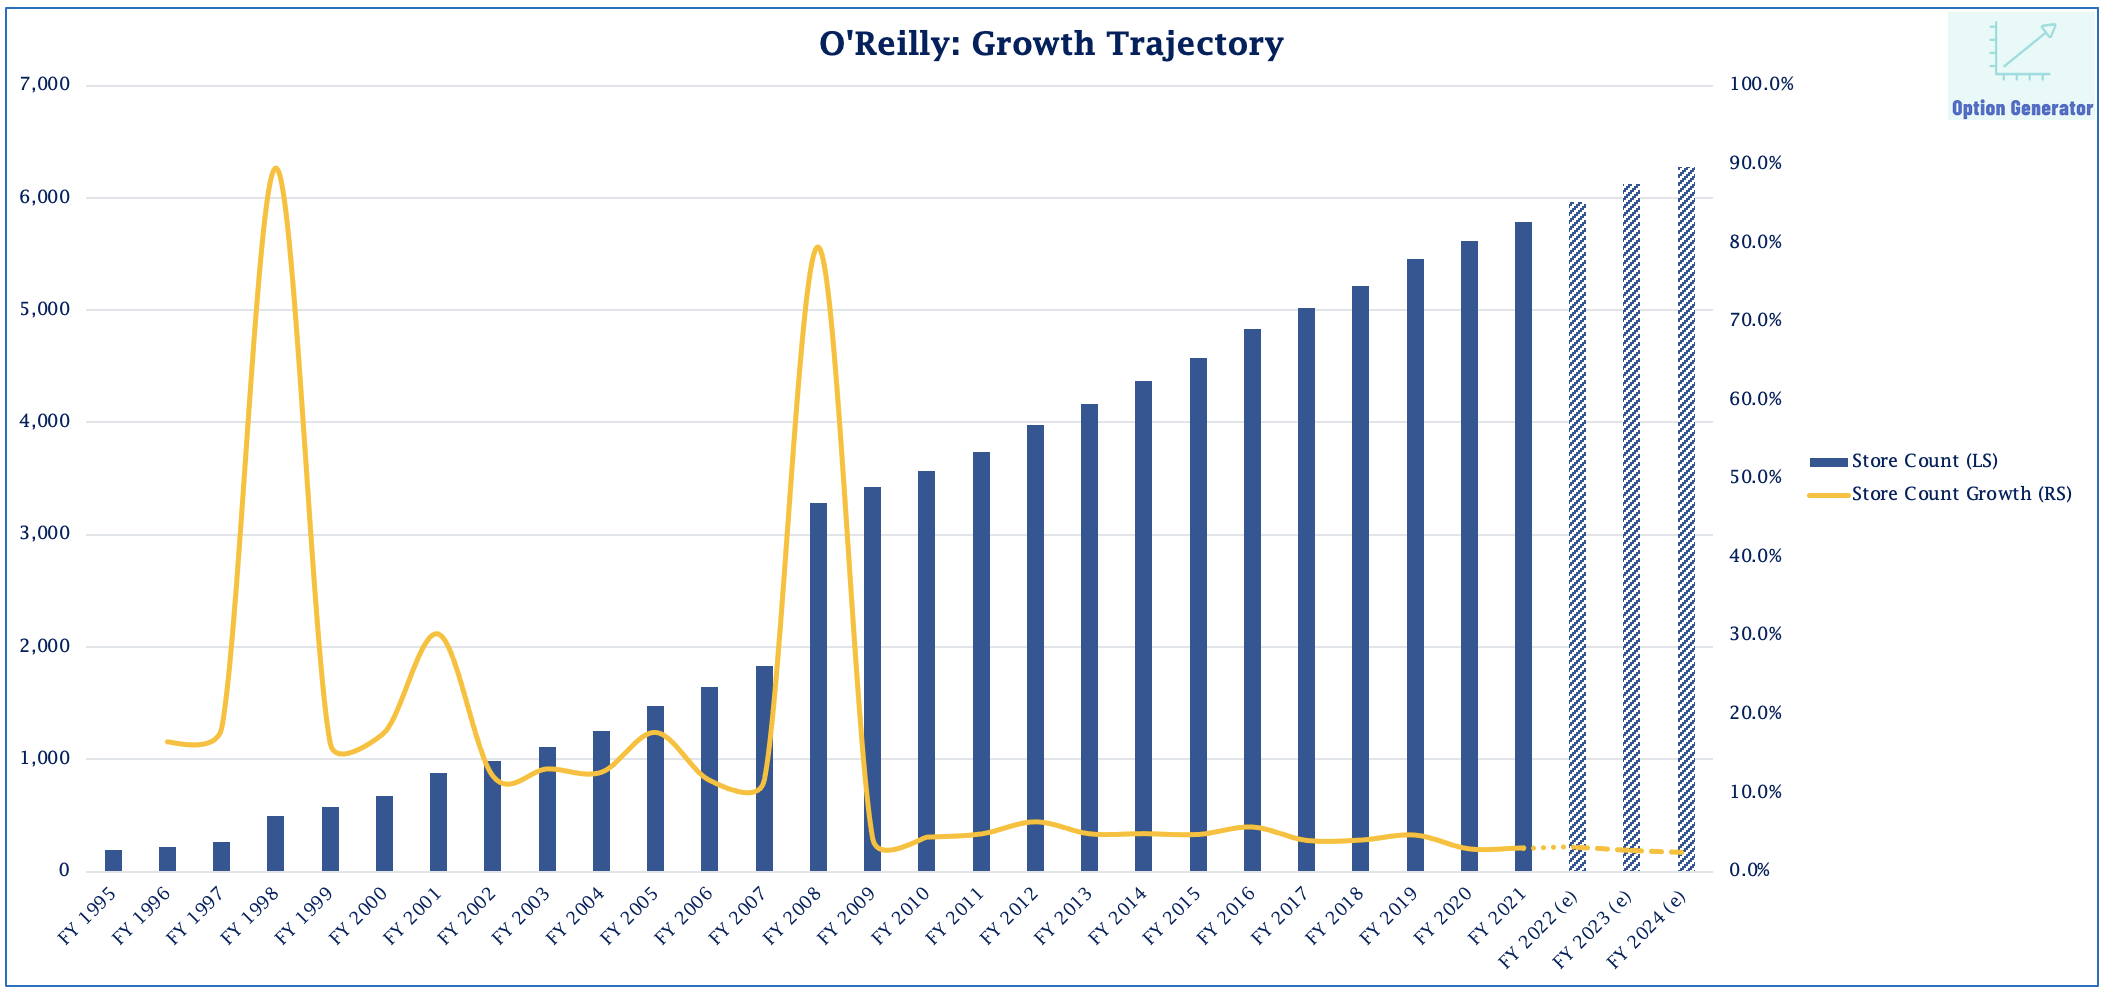
As the company became bigger, more efficient and increasingly cash-generative, store count growth has started slowed since 2010. Consequently, one might suggest that the company is running out of growth opportunities, inevitably leading to slowing EPS growth. This is far from the case. First of all, ORLY’s total addressable market was estimated to be $90B – $100B in 2019, which rose towards $100B – $105B in 2021. With DIY being more consolidated than do-it-for-me (DIFM), there still is a lot of runway for growth over the long haul, especially during economic times like these during which many smaller competitors have struggled to hold onto their market shares.
At the end of FY21, O’Reilly operated 5,784 stores. Those that offer same-day access can rely on significant inventory from its hub and super hub stores carrying 45k-92k SKUs. Additionally, 28 distribution centers offer access to an average of 158k SKUs. In the current supply chain constrained environment, ORLY has the financial resiliency to make further investments in inventory availability, ensuring it remains the most diversified player with fast delivery in the automotive aftermarket industry.
Because of its superior cash flow generation and still fragmented industry landscape, the combination of positive mid single-digit comps and continued store expansion have clearly allowed for substantial share repurchase programs. It should not come as a surprise that these shareholder value-enhancing actions started back in 2012, when O’Reilly managed to not only triple its ROIC but also cut leverage in half compared to 2008 after the acquisition of CSK. The much improved underlying cash flow returns made it easier to move forward with store count expansion (referring to section “ORLY’s Industry-Leading ROIC Will Help Shares Outperform in This Market Environment”).
Stable Profitability Throughout The Cycle With Rational Industry-Wide Pricing
As can be seen from the graph below, ORLY’s profitability has been very constant over the past years, contrasting the significant margin expansion witnessed by S&P-500 companies. The only times ORLY’s profit margins contracted meaningfully was in 1998 and 2008, both related to takeovers resulting in temporarily elevated SG&A expenses as a percentage of sales. Following the CSK deal in FY08, ORLY saw its total store count climb by 79.5% compared to FY07. After the integration process, those acquisitions allowed for sustained margin improvement attributable to the economies of scale embedded in ORLY’s business model.
Option Generator Research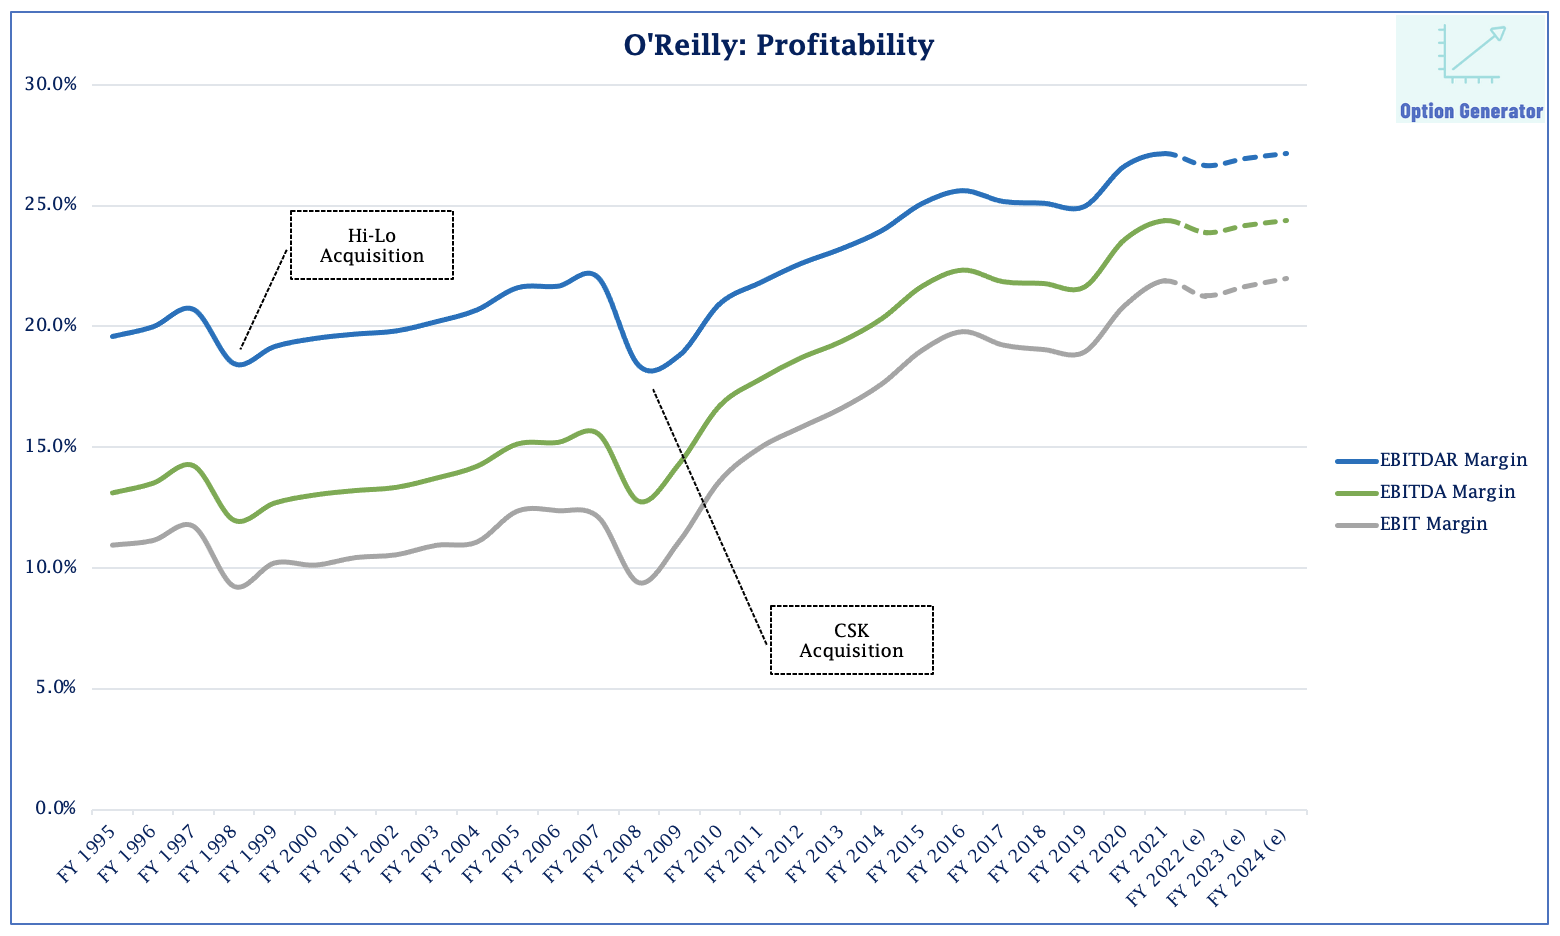
Thanks to growing its market share and capturing the trend of increasingly complex automotive technology, ORLY’s gross margin has marched higher over the past two decades.
Regarding the inflationary impact on ORLY’s profitability, the automotive aftermarket has been very rational in passing higher costs on to the customer. Following periods of inflation, the automotive aftermarket industry has very rarely seen corresponding deflation afterwards. As such, it’s highly unlikely that this pricing tailwind will revert over time, aided by an increased complexity of automotive technology and the fact that the two largest players, AZO and ORLY, retain a market share of roughly 40%.
Neither of them has the intention to trigger a price war just for the sake of taking share, although strategic re-pricing initiatives, aimed at strengthening market share in certain categories for the do-it-for-me/professional side of the business (such as garages), is an opportunity both players have been capitalizing on over the past quarters.
In the FY21 conference call, ORLY’s management guided for a temporary decline in FY22 due to pricing initiatives on the professional side, which is forecast to grow faster than DIY. Still, premium service and inventory availability remain the key priorities for both ORLY and AZO, stating competition based solely on price is not sustainable and is definitely not going to drive industry-leading ROIC. On top of that, ORLY’s and AZO’s growing combined market share leads to further improving overall profitability for both players as weaker competitors are being kicked out of the market.
Option Generator Research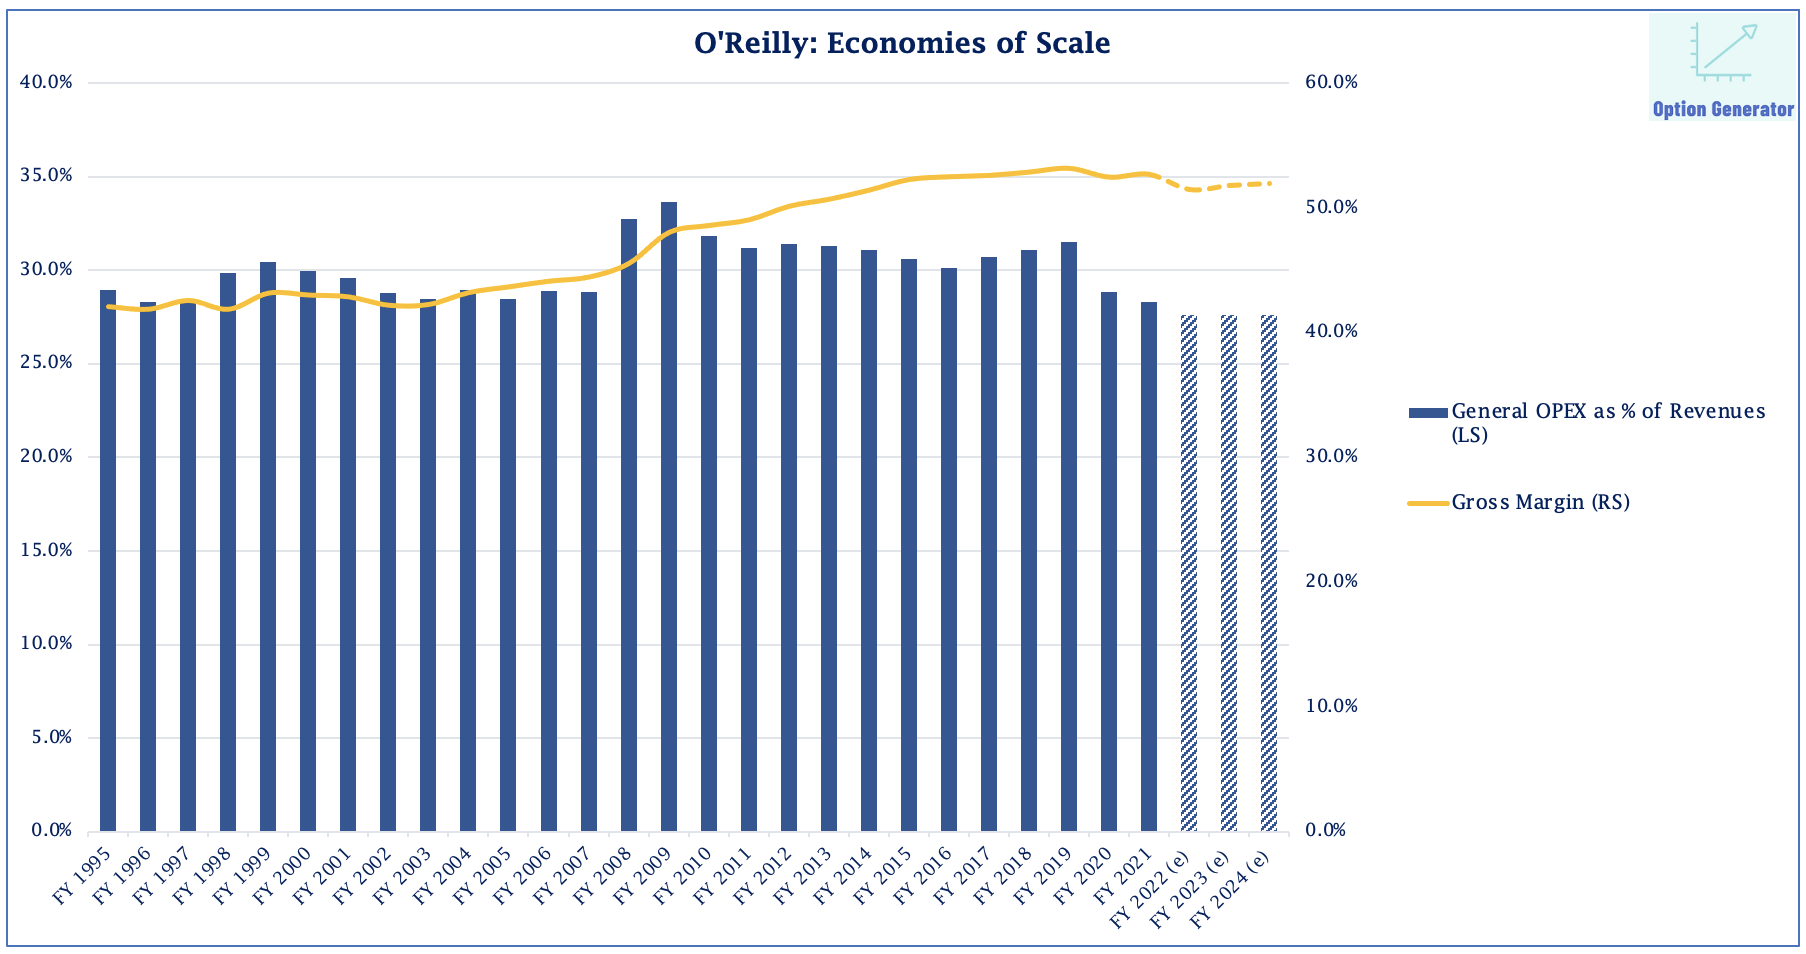
The effect of rising wages on SG&A should be more than offset by efficiency gains and absorption of fixed costs. As ORLY laid out a total CapEx budget between $650M and $700M for FY22, rent expense as a percentage of sales should decrease further, thereby supporting future recurring free cash flow growth. To summarize, inflation or varying economic growth have not had a meaningful impact on ORLY’s profitability drivers. In fact, deduce from the graph below that challenging economic times have actually accelerated ORLY’s margin expansion.
Option Generator Research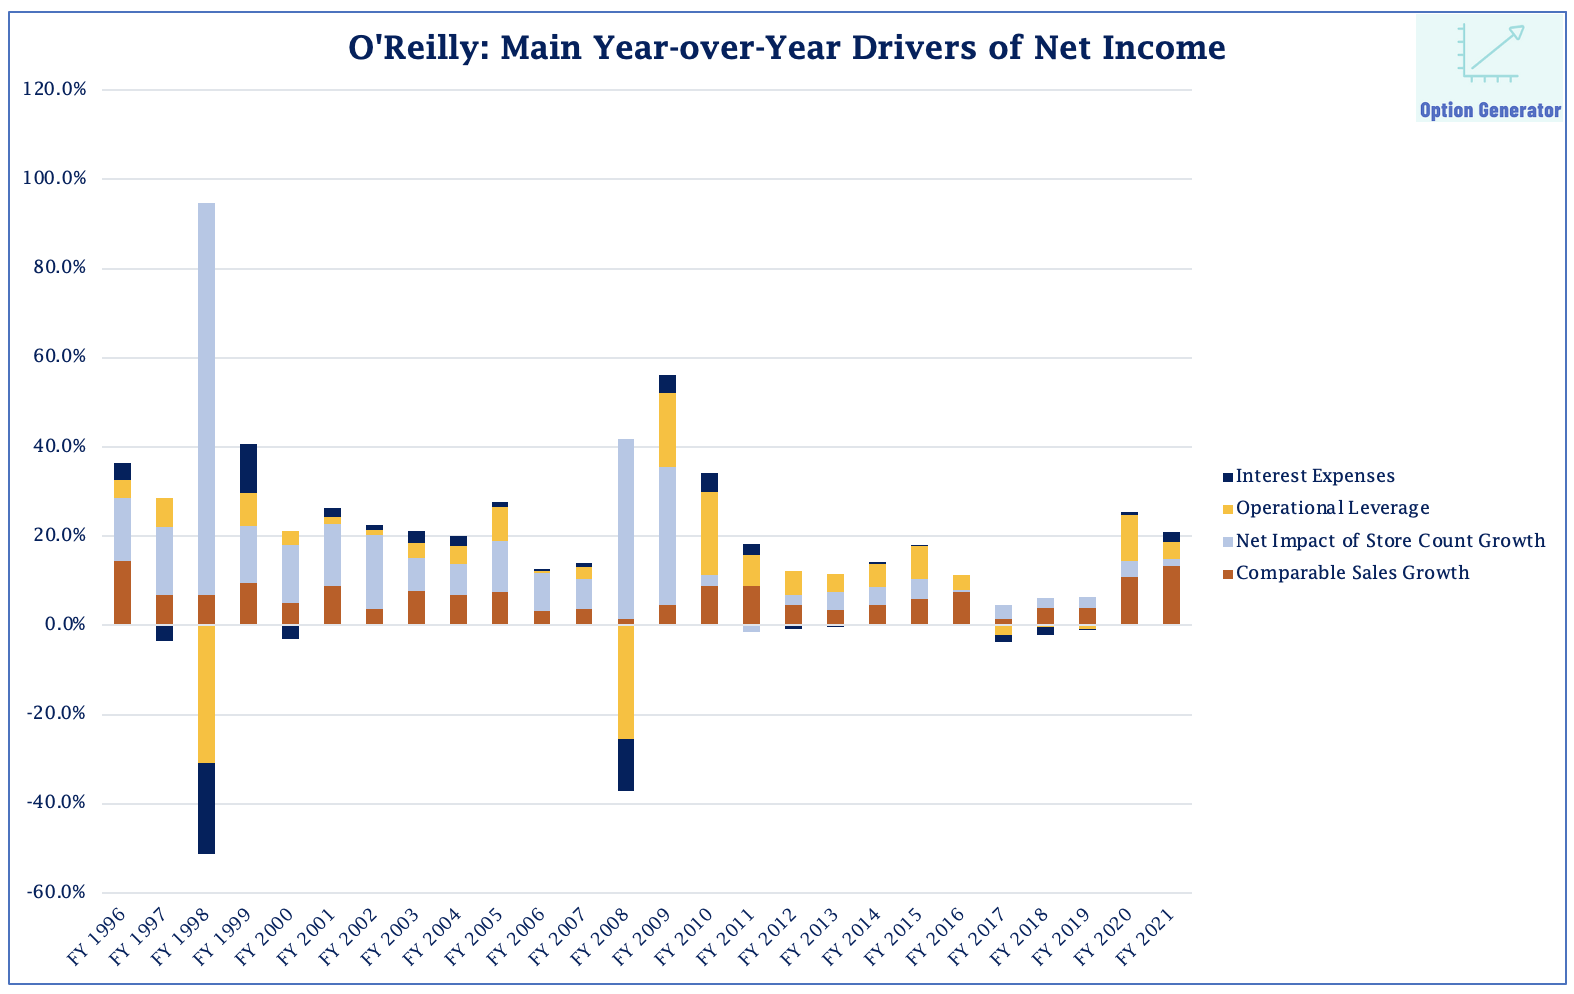
ORLY’s Industry-Leading ROIC Will Help Shares Outperform in This Market Environment
Besides ORLY’s strong topline growth and steady margin expansion, Return On Invested Capital (“ROIC”) is the most single important metric to laser-focus on, and even more so when the narrative tilts towards stagflation. This ratio divides NOPAT by total operational invested capital, i.e., PP&E and net working capital.
Companies that fail to offer a sufficiently high cash return should be avoided at all costs, as they are essentially destroying shareholder value. Despite not ticking this essential box, commodity and utility stocks have fared really well over the past couple of weeks and months. Given their notable reliance on debt to grow earnings and distribute dividends, we are not buying into companies that exhibit poor economics.
As inflation generally leads to higher sales, one should not ignore two important consequences: inflationary pressures will also inflate CapEx and positive working capital, making capital-intensive businesses un-investable for high-quality investors. More than anticipated CapEx and adverse changes in working capital requirements lead to shrinking free cash flows.
Investors who keep a close eye on ROIC should favor companies with low to negative working capital, as their business cycle is not financed with own cash flow. Hence the reason why their ROIC is going to be elevated compared to those with positive working capital.
In the case of O’Reilly, the returns have marched higher since the COVID-19 outbreak because of improved inventory turnover and increased profitability. In FY21, the company witnessed a continuation of substantial cash inflows from working capital. Fueled by its highly effective vendor financing program, ORLY’s working capital turned negative in FY20 as trade payables covered 114.5% of total inventory.
Option Generator Research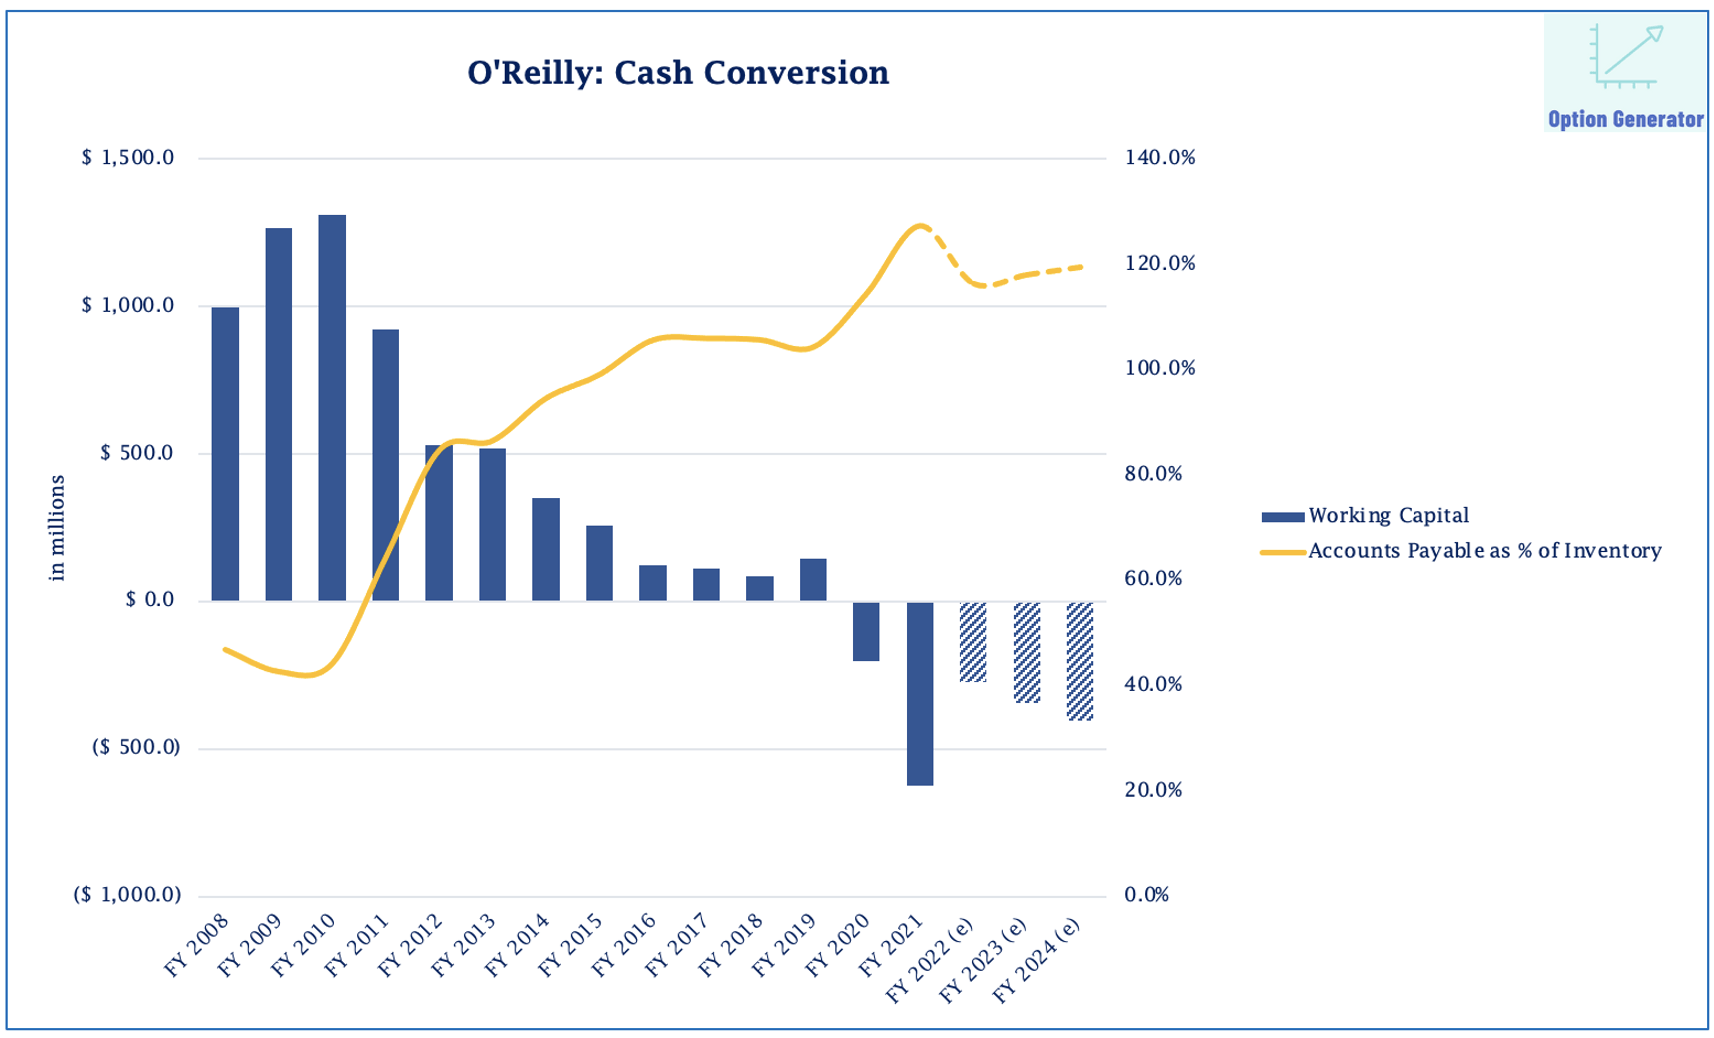
But even if we would strip this advantage, ORLY’s return on tangibles has continued to grind higher over the past years, testifying to its successful store count expansion strategy. Incorporated in the incentive compensation plans, ORLY’s management team made ROIC (*) the number one priority in maximizing shareholder value creation.
* Please note that the following ROIC graphs include the off-balance lease items prior to FY19 in order to rightfully judge capital efficiency.
Option Generator Research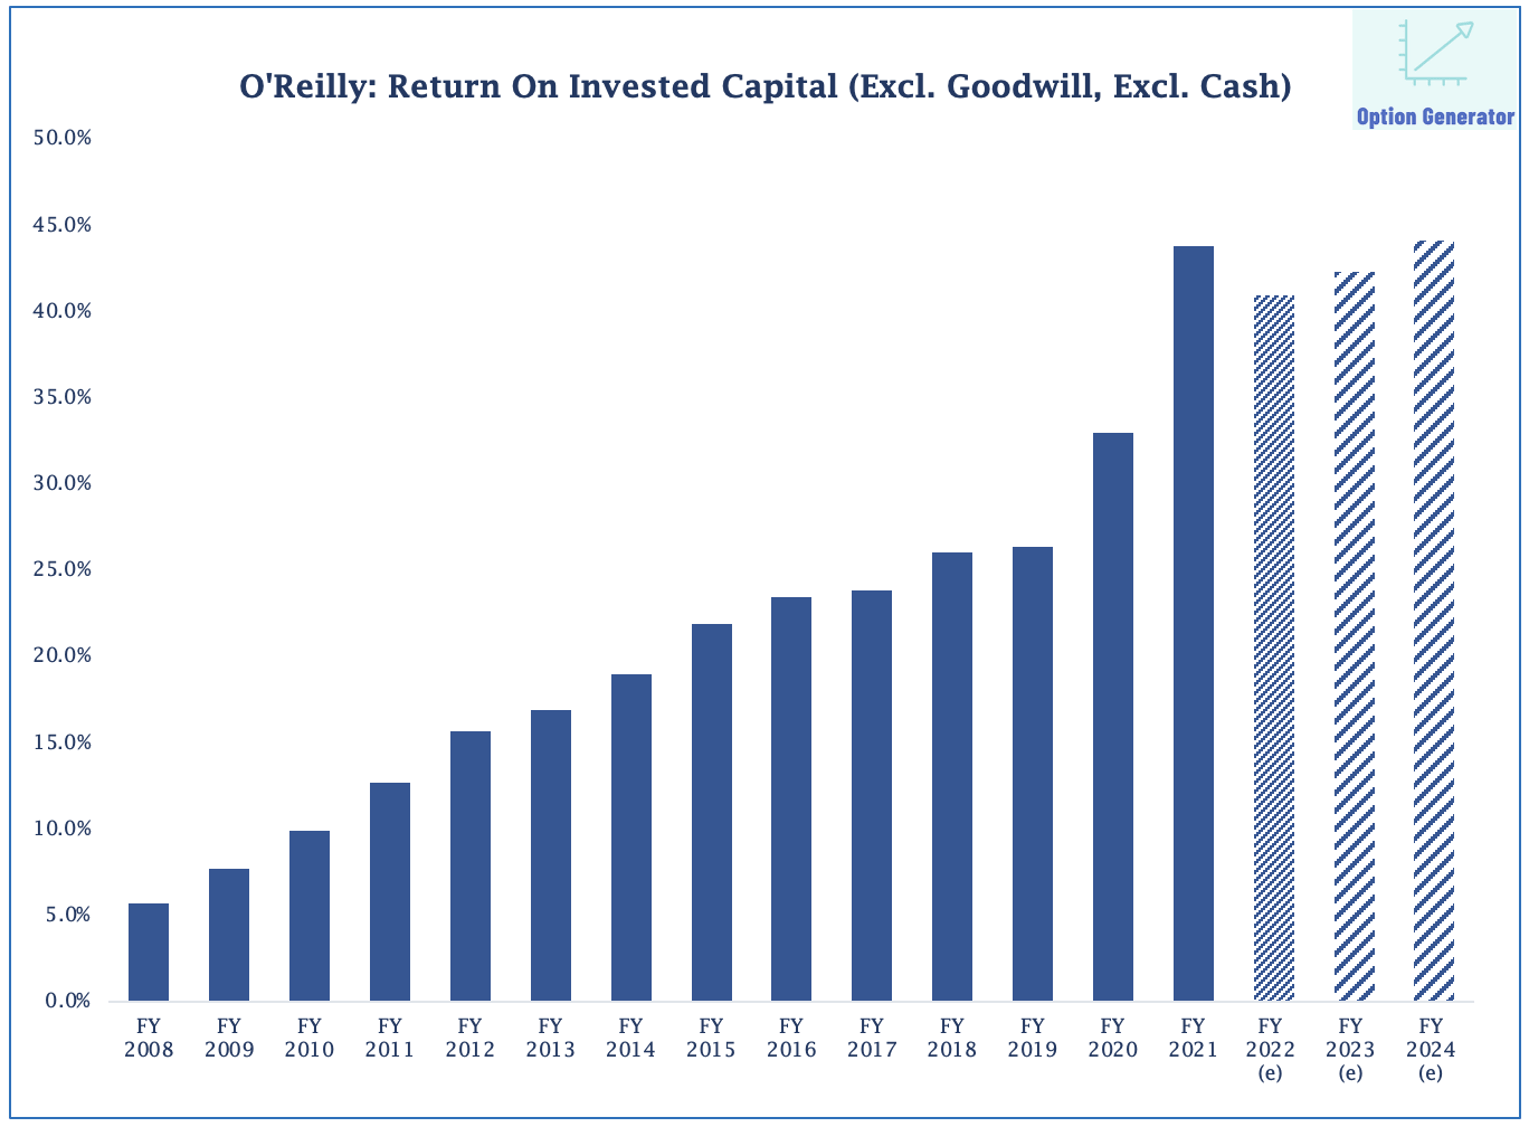
Aggressive Share Repurchases Support Long-Term EPS Growth
Rather than paying out dividends, ORLY focuses solely on expanding the store count and buying back own stock at attractive multiples. ORLY’s management team holds an aggregate 1.1% of the company and continues to pull the trigger on quite aggressive share repurchases, as it sees a meaningful undervaluation when judging the long-term business prospects and discounted cash flow projections.
Option Generator Research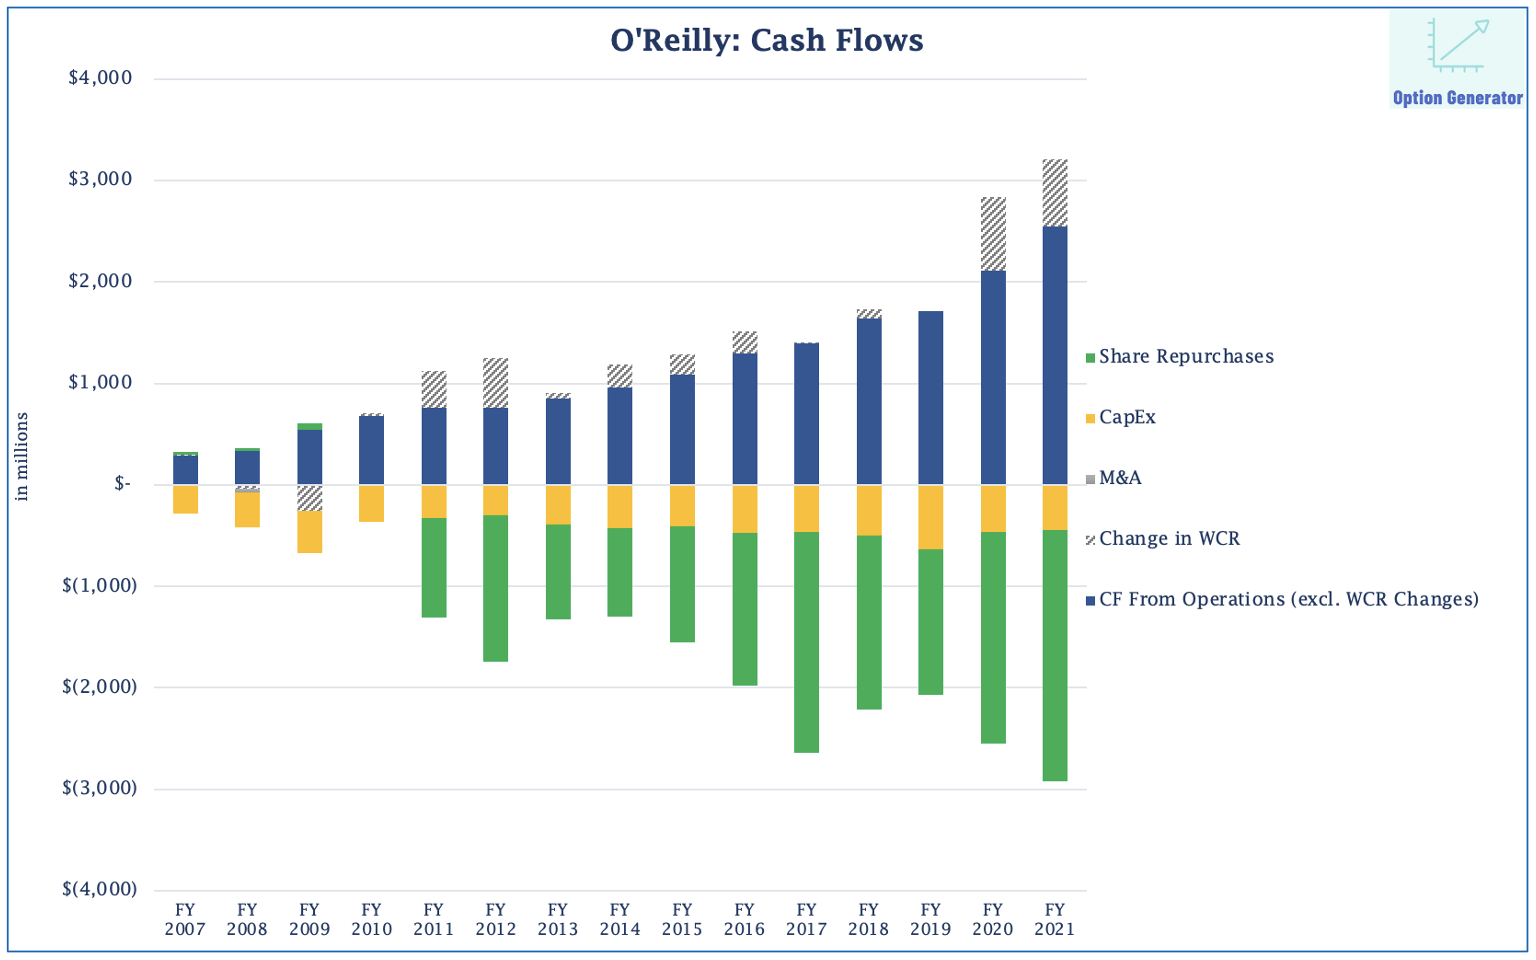
While O’Reilly did see its net debt position increase because of aggressive share repurchases, leverage compared to FCF and EBITDA has actually dropped over the past decade as vendor financing resulted in favorable working capital. The strong ROIC allows for smaller growth CapEx spending, leaving ample room for shareholder-rewarding buybacks. Looking ahead, we estimate annual CapEx to equate to 4% of net sales.
Option Generator Research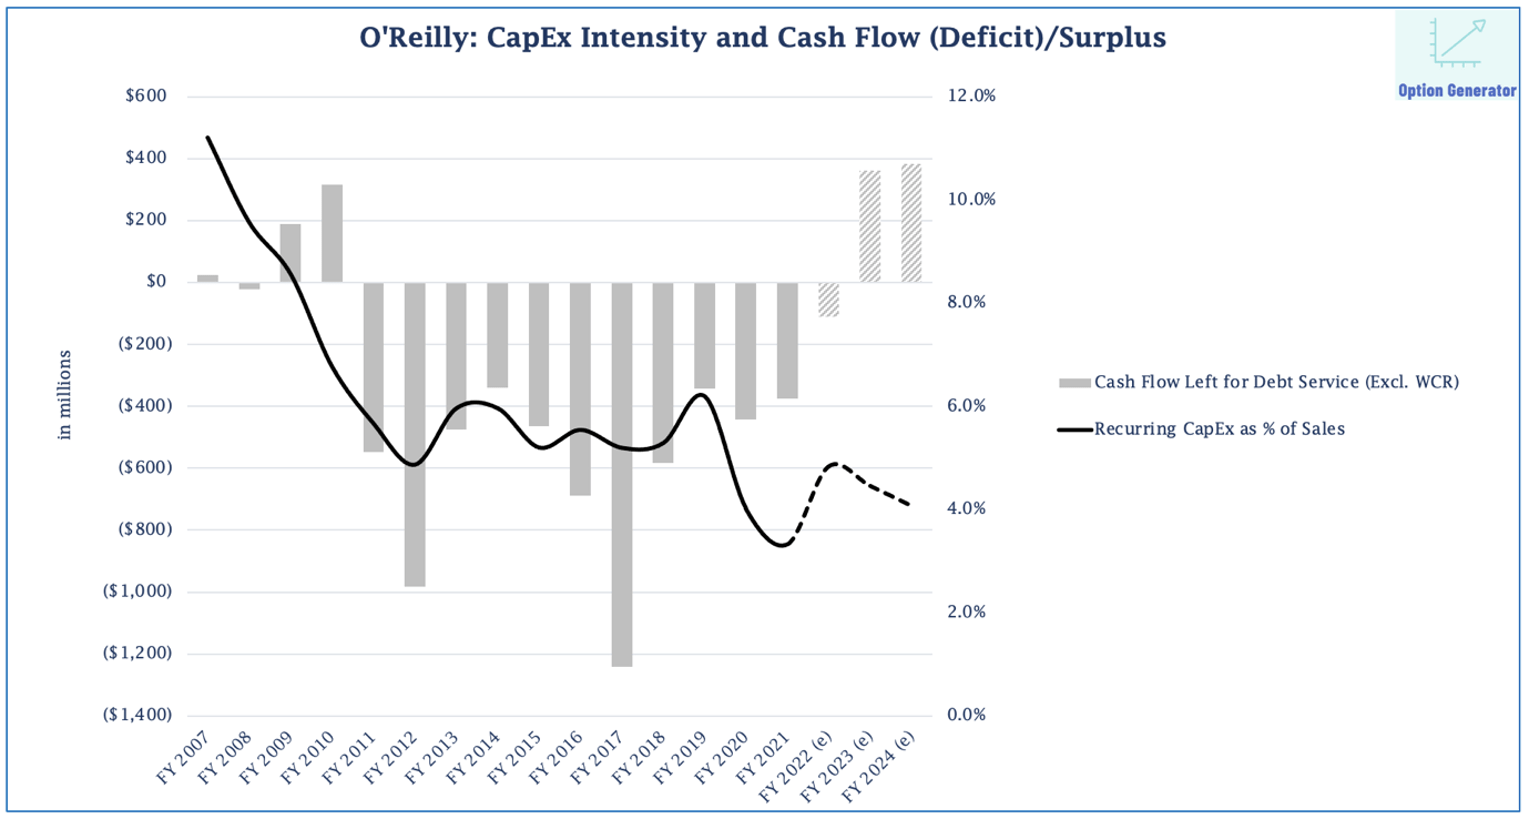
ORLY’s share repurchases have contributed 430 bps to ordinary cash flow growth since 2007, which is reflective of management’s long-term proactive capital allocation strategy. Moreover, despite some inventory build-up (+/- $300M) and increased CapEx spending ($700M at the mid-point) already reflected in its FY22 free cash flow guidance, leverage remains well below the targeted maximum of 2.5 times EBITDA.
Excluding ORLY’s mid-term runway for additional operational efficiency and thus solely based on very moderate SKU inflation and below-average sales comps of +5% in both FY23 and FY24, we estimate share buyback firing power beyond the regular purchase programs to exceed $4B by the end of FY24. This figure adds up to a share buyback budget of approximately $2B per annum over FY22-FY24, meaning ORLY could theoretically reduce the share count by a cumulative 23% over the next three years.
Option Generator Research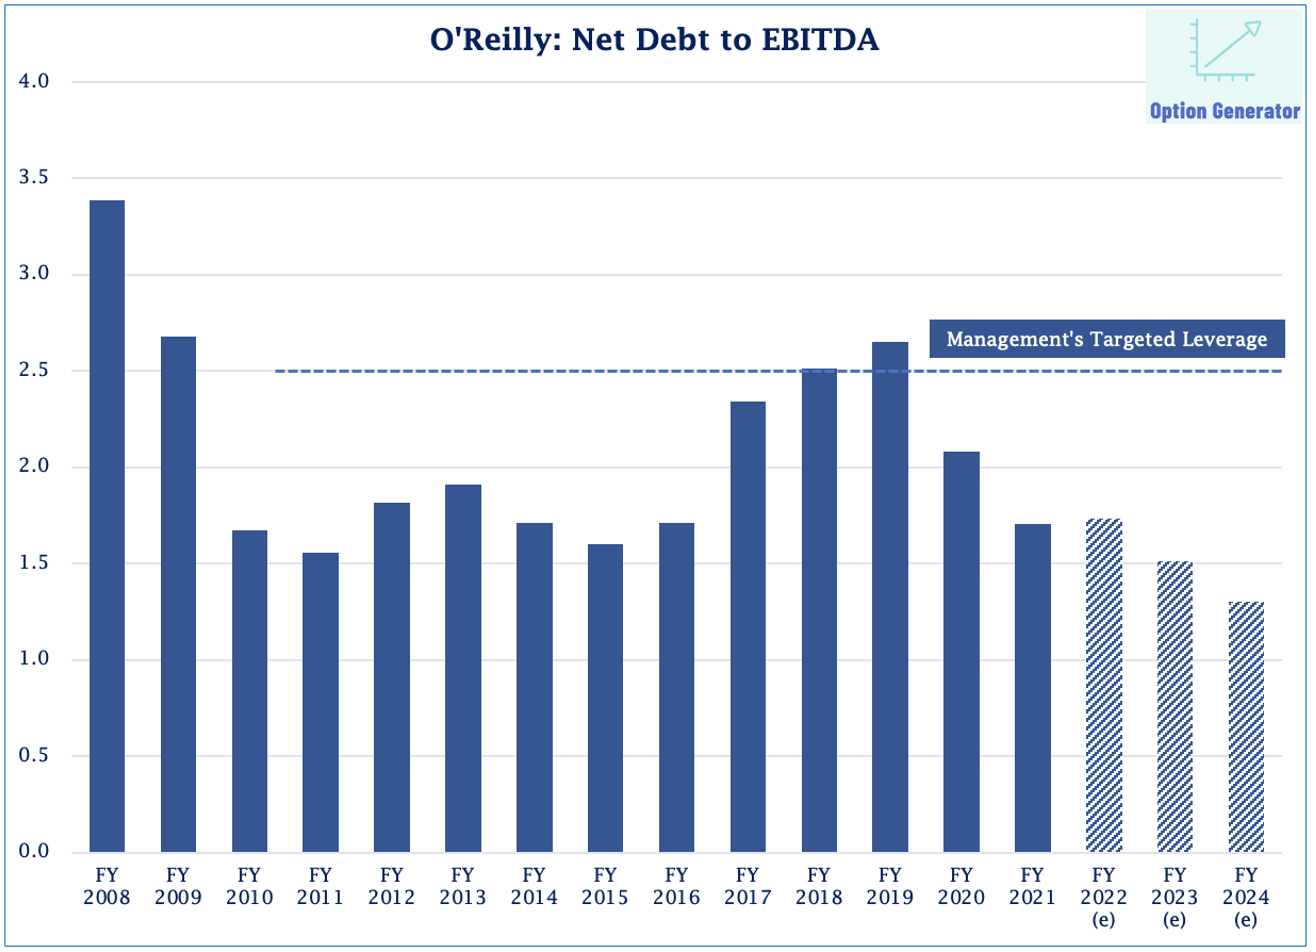
Peer Comparison: AZO Has Lower Valuation But Less Favorable Comps And Weaker ROC
Compared to its nearest competitors, AutoZone (AZO) and Advanced Auto Parts (AAP), ORLY has clearly delivered more consistent comparable sales growth. When it comes to other metrics such as profitability and ROIC, AAP shows stagnating sales and a lack of ROIC improvement and therefore should not be compared with ORLY and/or AZO.
Option Generator Research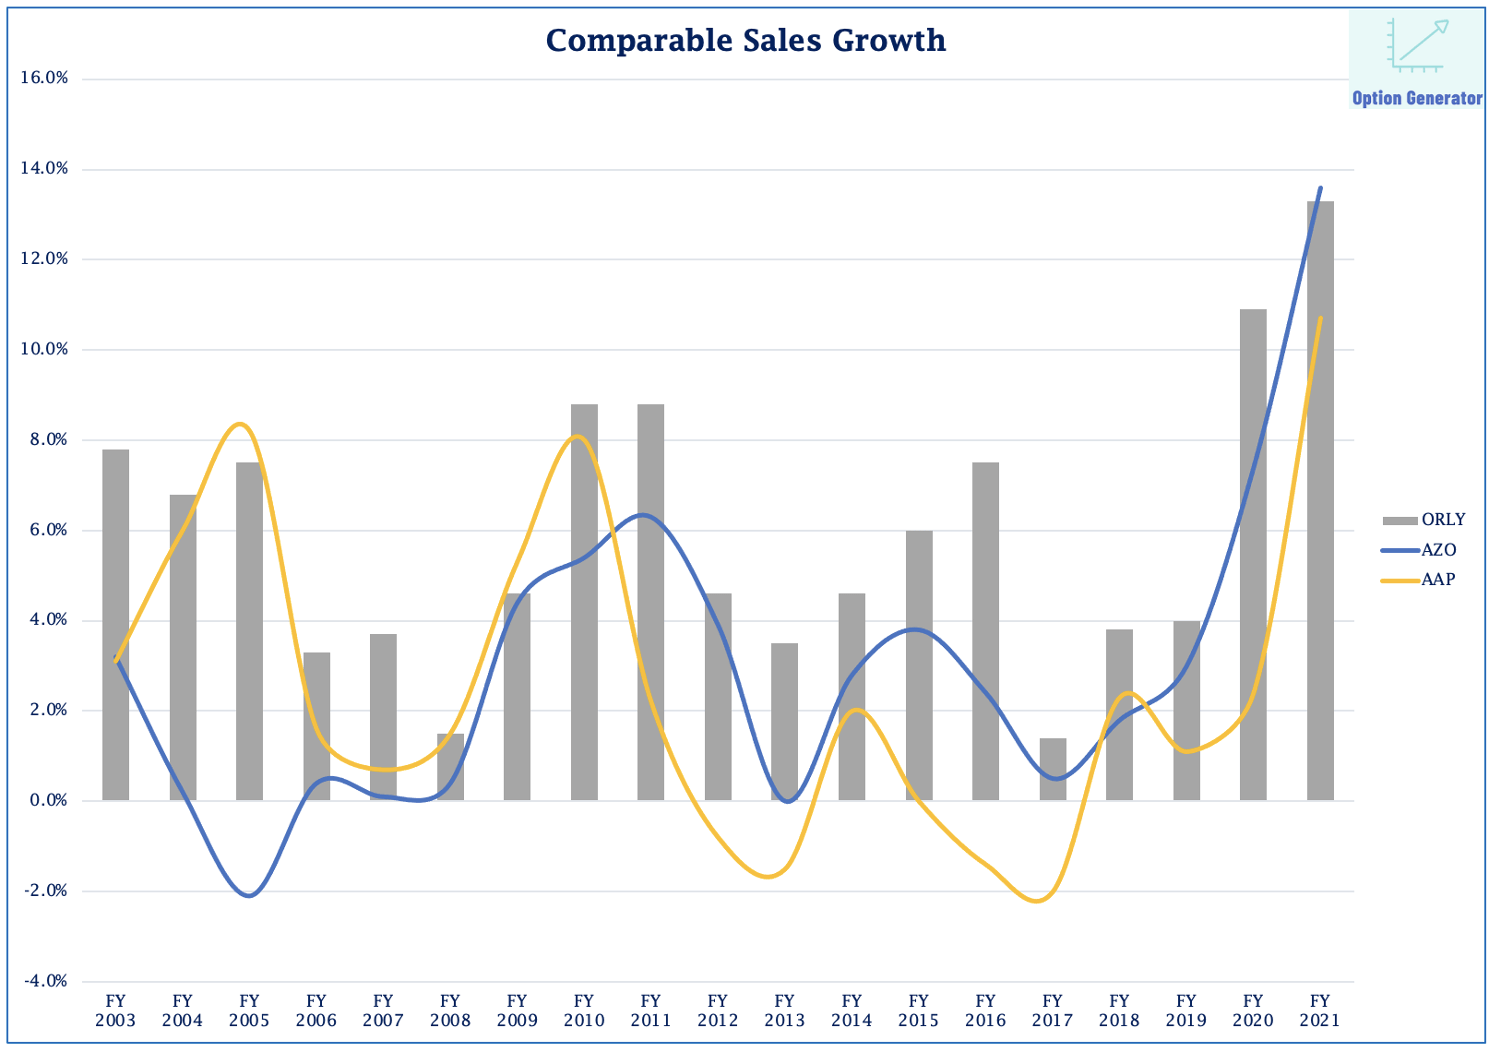
At first glance, ORLY and AZO show a similar ROIC picture, but there are two elements we’d like to highlight. First of all, AutoZone has had a negative working capital balance long before O’Reilly did, thereby positively influencing its reported ROIC. Neutralized for net working capital, there’s a considerable widening gap between the underlying return on capital for ORLY versus AZO. One could argue that ORLY has done a better job in warding off competition, as its efficiency and sales per store continue to climb.
Option Generator Research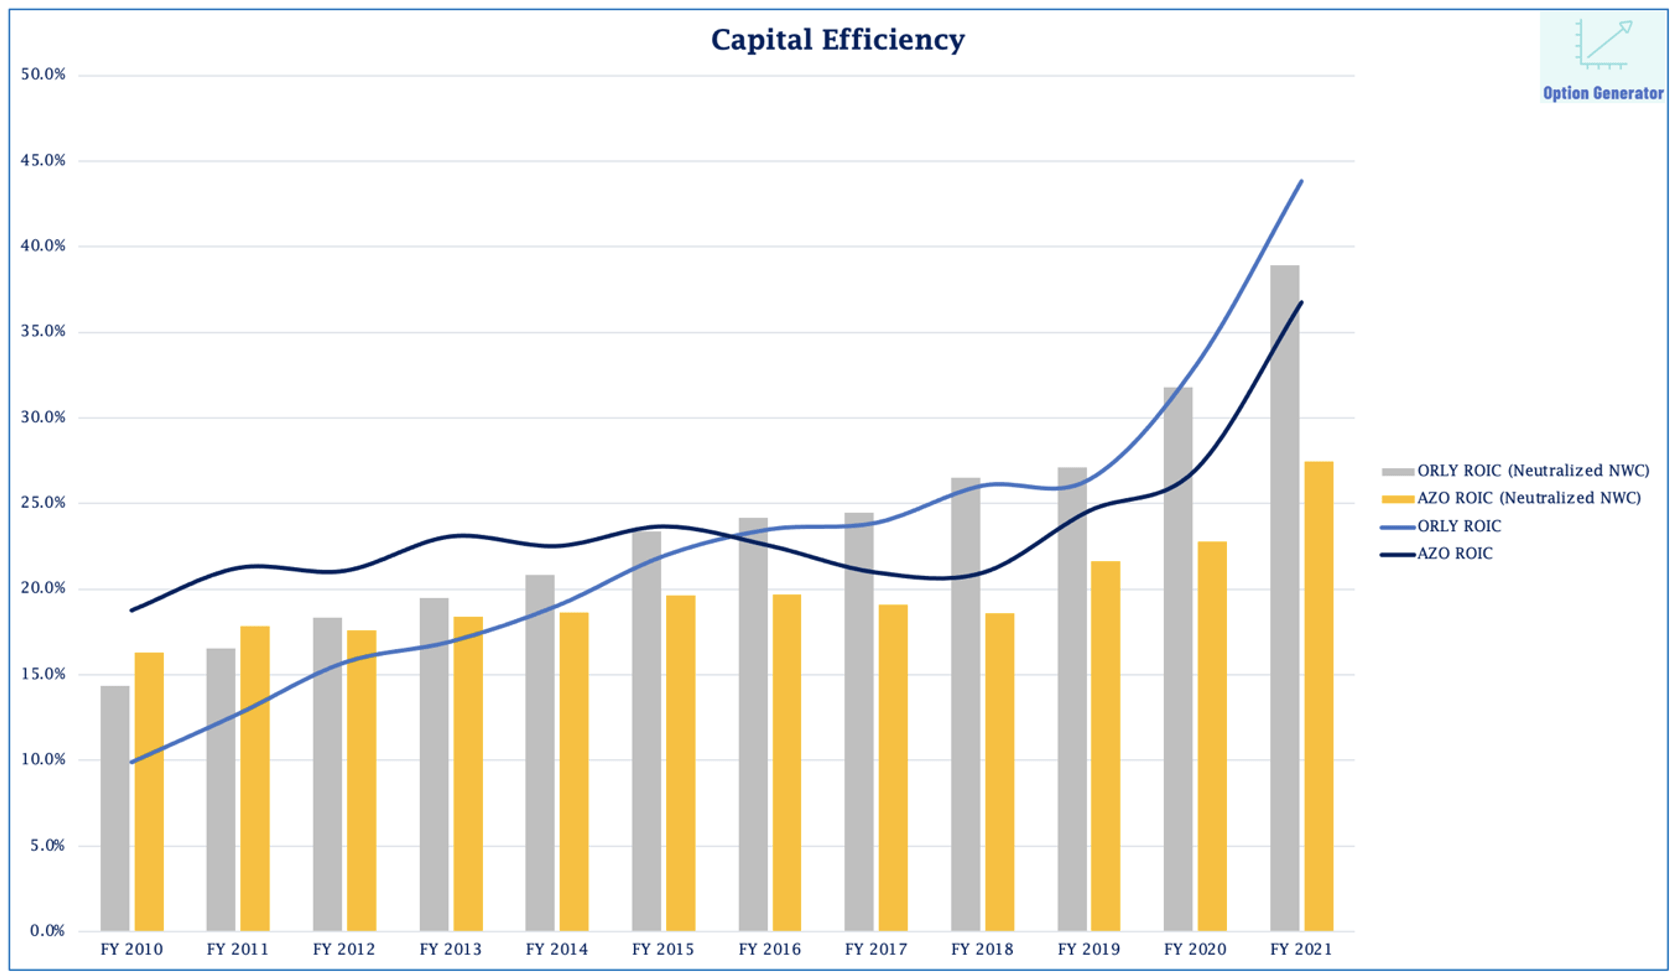
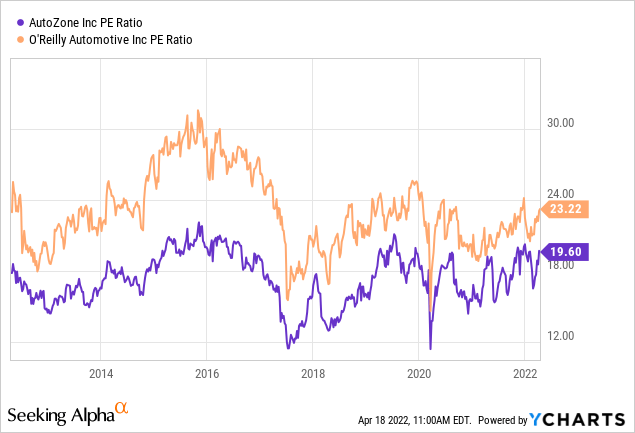
Along with a more unfavorable debt position (including lease liabilities), less CapEx as a percentage of sales and ultimately lower comparable sales growth potential, AZO justifiably trades at a lower earnings and cash flow multiple compared to ORLY.
Appealing Valuation Makes O’Reilly A Buy
Even though ORLY depicts highly stable quality features, shares are not expensively valued when referencing to prior years. Furthermore, we’d argue that none of ORLY’s closest competitors is able to match the kind of track record it has enjoyed over the past three decades. Taking $2B in annual share repurchases as a base number, shares offer an earnings yield of 6.4% based on our FY24 projections, which is above the average of 5.3% registered over the period 2007-2021. The current figure is also meaningfully ahead of both the S&P-500 (SPY) Shiller earnings yield and the 10-year risk-free rate.
Option Generator Research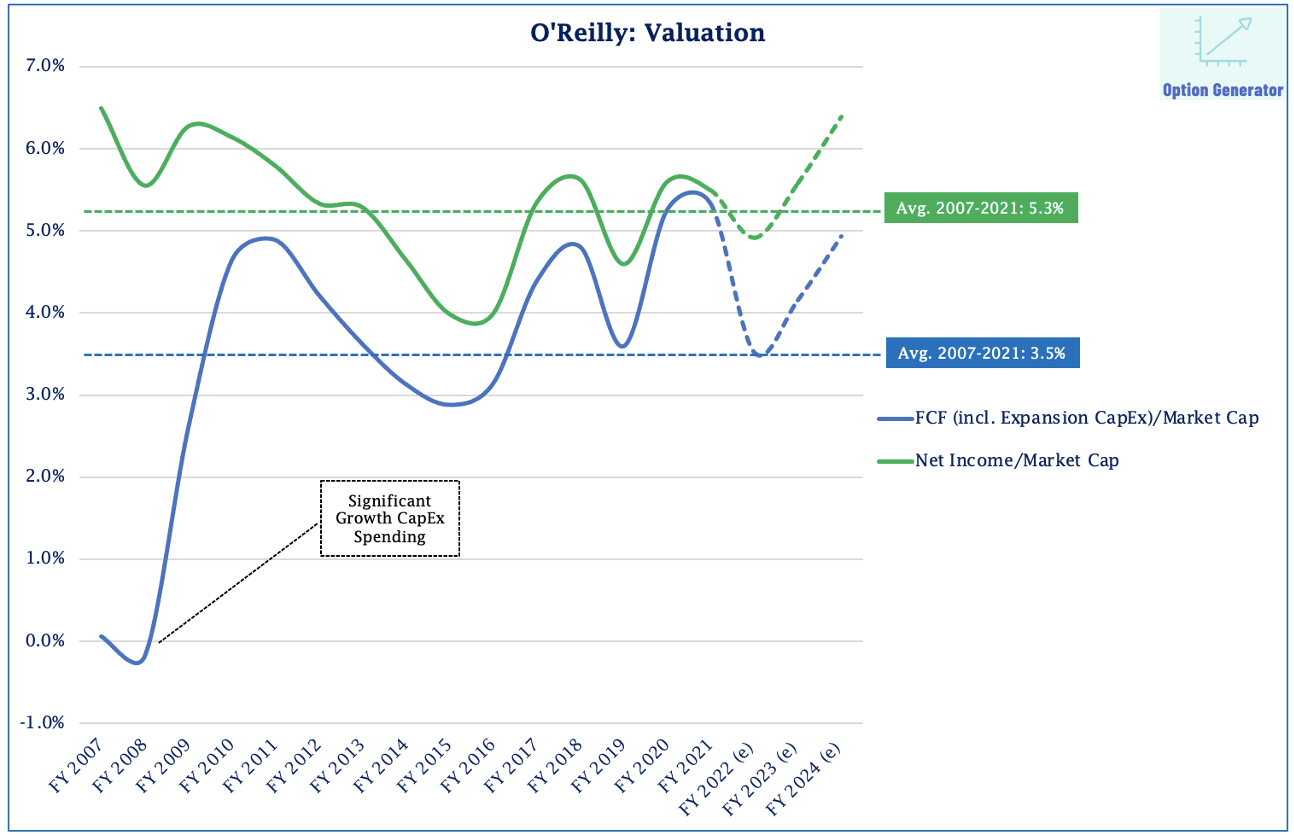
To make things look even better, investors can add a passive covered-call overlay to a buy-and-hold strategy with O’Reilly. As heightened inflation and slowing economic growth have spurred fears about sustained stock market volatility, options premiums are now rich across the board. If one were to purchase ORLY shares, selling a 5% out-of-the-money call option against the long stock position would yield 1% to 1.5% based on today’s prices. Assuming an effective cost-basis reduction of about $50 in 2022, the forward yield for 2024 will reach 7% instead of our initial 6.4%, thereby further accelerating ORLY’s compounding EPS trajectory.
Based on a weighted average cost of capital of 7%, an annual revenue growth of 4.6% over FY22-FY31 and 2% perpetual growth, our DCF points to an expected IRR of 11.2% if we’d completely exclude operational leverage coming from economies of scale. Given the solid business prospects, capital-light business model, permanently negative working capital and declining leverage ratios, ORLY’s board should further boost the share repurchase authorization by another $2B. As a result, our base case scenario yield an IRR of 14.4% when targeting a long-term fixed leverage ratio of 1.5 times EBITDA, which is still below management’s guidance of 2.5 times.
Risks To The Investment Thesis
Based on the operational returns ORLY’s business currently produces, we believe management’s execution in rolling out an omni-channel strategy has been a highly effective one. Although price is an important determinant for its customers, technical expertise and parts availability are the driving factors behind its past and current financial performance.
As the switch towards electric vehicles takes hold, one might question how solid ORLY’s long-term prospects are. If we’re talking about the short to medium-term outlook for EVs, persisting supply chain constraints and lower demand for automobiles is expected to result in a longer lifetime of existing vehicles and thus more maintenance and repair requirements. In addition to that, steadily rising miles driven as a result of fewer COVID-19 restrictions and a lack of mass transit infrastructure support the long-term outlook for the automotive aftermarket retailers.
Nationwide box stores cannot reach into ORLY’s smaller markets, whilst online competitors are not capable of offering a nearby physical location run by experienced employees. The exact same reasons also apply to big-box retailers and online retailers such as Amazon (AMZN). As O’Reilly is planning to invest heavily in its inventory base, its moat will undoubtedly widen further.
Furthermore, ORLY’s market-leading return on capital makes it a reliable cash-minting business, which helps ward off competition from pure online automotive aftermarket retailers. It is unviable for a company to perpetually generate a negative Return On Invested Capital as it then permanently destroys shareholder value. Hence investors will have to put up more capital to avoid ceasing business activities.
One of ORLY’s smaller competitors (with about $650M in annual sales) is CarParts.com (PRTS) which positions itself as a disruptor and intrigued many growth investors at the beginning of the pandemic. At-the-market equity offerings have so far managed to keep the company afloat, while the underlying business continues to destroy shareholder value as the gap between return on capital and the weighted average cost of capital remains 25+%. Not the kind of business one wants to be invested in under today’s circumstances.
Conclusion
As for an investment in O’Reilly, all good things come in threes: inherent inflationary re-pricing, counter-cyclicality and juicy options premiums which allow for incremental cost basis reduction and as a result even faster wealth compounding.
ORLY’s valuation looks far from demanding in today’s market environment. Combined with some passive covered-call writing, the stock could yield more than 7% by FY24; comfortably ahead of the broader market. With regards to inflationary pressures, ORLY’s strategic investments targeted at gaining market share will erode some of its gross margin this year. Still, operating income should increase by 5% to 6% in FY22.
Given the solid business prospects, capital-light business model, permanently negative working capital and declining leverage ratios, ORLY’s board should further boost the share repurchase authorization by another $2B. As a result, our base case scenario yield an IRR of 14.4% when targeting a long-term fixed leverage ratio of 1.5 times EBITDA, well below management’s guidance of 2.5 times. We rate ORLY shares “BUY” for long-term conservative high-quality investors.
Be the first to comment