

agrobacter/E+ via Getty Images
Investment Summary
Since our last report on OraSure Technologies, Inc. (NASDAQ:OSUR), we have remained firmly neutral, despite the noted strengths in its latest set of quarterly numbers. We had exited our long OSUR position in FY21. Although, we opted to remain constructive on the company if it was able to spread the distribution of revenue more evenly amongst its non-COVID enterprise. It hasn’t demonstrated this trend in our view.
As a reminder, our neutral stance is predicated on these factors:
- COVID-related revenue continued to dominate the top line growth last period. But removing its contribution, overall turnover decreased 36% YoY.
- This phenomenon compressed gross margins as the revenue share continues to drift towards the lower margin diagnostics business.
- Alas, more than 54% of the company’s top-line remained unhedged from a large scale back in Covid-19 testing revenue.
Following its Q3 earnings, we noted these trends remained well in situ. Alas, we’re back today to discuss our latest findings and reiterate our hold thesis on the stock. Net-net, we also retain our price target of c.$3.00. We encourage you to read our last publications on OSUR to fully gauge our standpoint [from newest to oldest]:
OraSure Q3 financials illustrate common thematic
Switching to the company’s Q3 results, it’s abundantly clear that Covid-19-related revenue continued to dominate top-line growth. Of the $112.8mm in turnover for the period, Covid-related revenue pulled in $79.92mm, or 70.81% of total revenue share [Exhibit 1]. This is up from 54% in Q2 FY22. It is also a YoY growth of 474%.
Excluding the contribution from Covid-related revenue, the remaining divisional revenue declined 15.4% YoY, in continuation of the downtrend. A snapshot of OSUR’s operating performance from FY17–date is seen in Exhibit 2.
Exhibit 1. Non-COVID revenue continues to exhibit YoY declines in continuation with previous trends.
Data: OSUR Q3 FY22 10-Q, pp.11, “Revenues”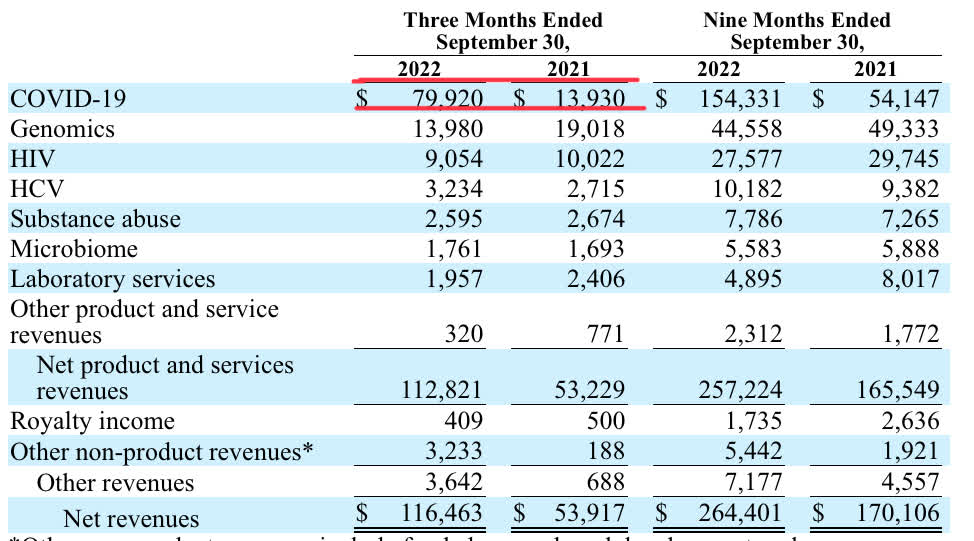
Exhibit 2. OSUR Operating Performance FY17’—date
Note: Given the company’s series of quarterly free cash outflows from FY20 to date on a TTM basis, we have opted to exclude showing the negative FCF yield on the chart. FCF yield is calculated as [TTM FCF / rolling enterprise value]]. (Data: HBI, OSUR SEC Filings, Refinitiv Eikon, Koyfin)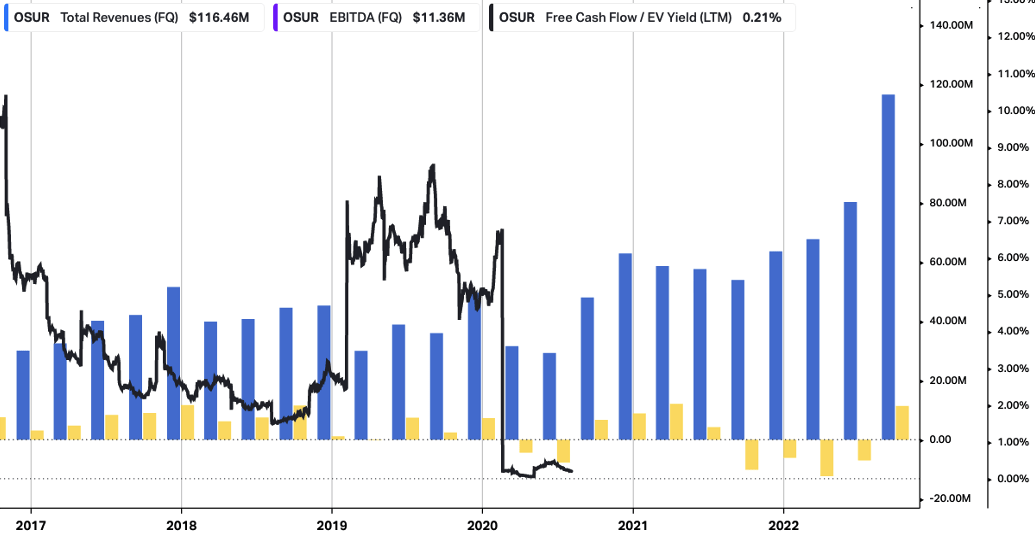
Let’s take a step back for a second and look at this pragmatically. Despite the uneven distribution of revenue growth, OSUR is still collecting large sums of revenue from COVID-related sources.
The question then turns to what it intends to do with any surplus cash flow, and where it intends to invest the same. Management touched on this during the call, noting it has begun to “evaluate new complementary offerings expanded commercial channels, and of course, strategic partnerships too.”
However, we’ve yet to see any action on this to date, and would, therefore, estimate this as a potential headwind looking down the line. The cost of capital is increasing and OSUR now has a WACC hurdle of ~8.5%, whereas the last 12 months return on capital employed is negative 4–5% [Exhibit 3]. This is despite the ongoing free cash outflow since FY19’.
Consequently, OraSure has a wide gap to fill in this regard, and we believe there will be some time before investors see this number in the green again. Comparatively, there are plenty of competing names offering this return on capital up on a silver platter in FY22. This adds to our neutral thesis.
Exhibit 3. Coupling of free cash outflows with declining return on capital leaves a wide gap to fill
Data: HBI, Refinitiv Eikon, Koyfin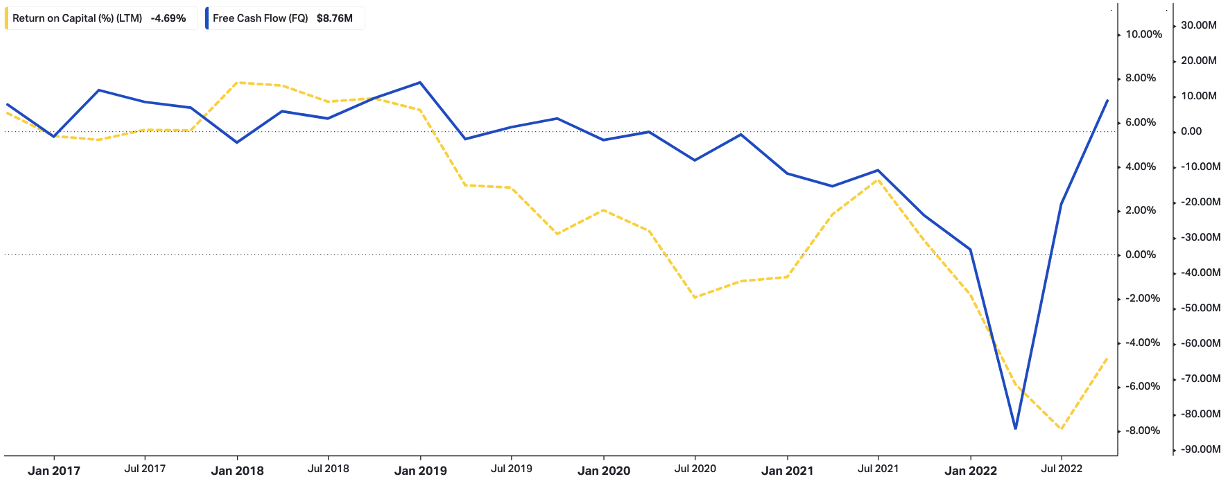
OSUR: Technical Studies balance downside
Turning to the charts, we wanted to see how the market is gauging OSUR in real time and get a sense of what investors have planned down the line. Given the lack of profitability, these chart studies will help guide price visibility in our estimation.
The stock recently bounced from an 18-month low and now trades with strong support off this floor [Exhibit 4]. It has since formed an ascending base for the last 24 weeks, having crossed the 50DMA and 250DMA in doing so.
Speaking of, both these moving averages also crossed 6 weeks ago and the 50DMA now leads the 250DMA to the upside. What we haven’t seen is the volume to support an extension of this move back to FY20/21’ highs. Nevertheless, there appears to be short-term support for the stock.
Exhibit 4. OSUR 18-month price evolution [weekly bars, log scale]
Data: Updata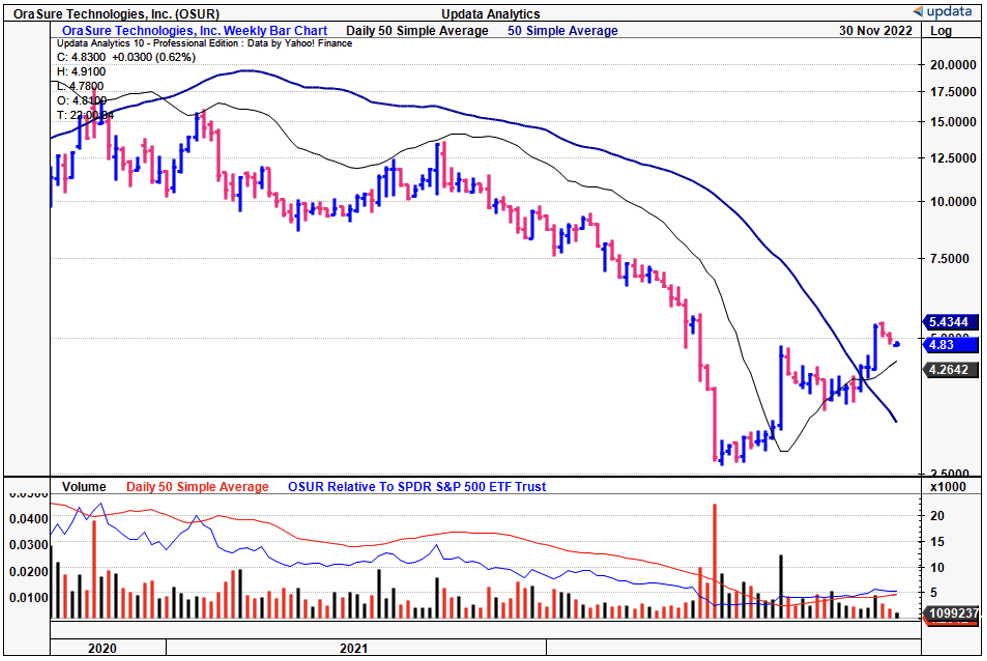
This is confirmed via our point and figure charting analysis below, that shows support to an upside target of $5.95. We’d note these targets have served us well in the past, and thus we have confidence in their use. You can see the same below.
Exhibit 5. Support to upside target of $5.95
Data: Updata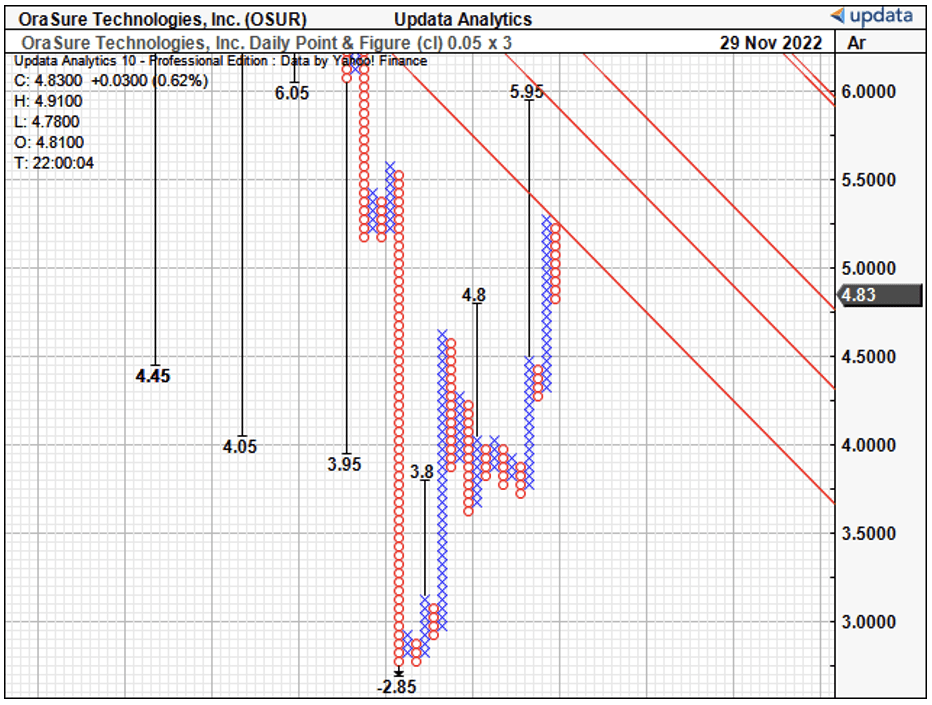
Valuation and conclusion
We should advise that consensus has OSUR priced at ~1x forward sales, behind the sector median’s 4.4x. Alas, despite the company’s optimism, investors, therefore, expect a below-market result from OSUR in the next 12 months.
Given our findings, we believe this to be a fair multiple. Moreover, we see continued EPS downside looking ahead, despite the pull-through of COVID revenue this quarter [our quarterly EPS assumptions are seen in Exhibit 6]. We, therefore, see no change to our previous valuation of $3.03 cents until the company can demonstrate otherwise.
Alas, and unfortunately, we reaffirm our hold call on OSUR.
Exhibit 6.
Data: HBI Estimates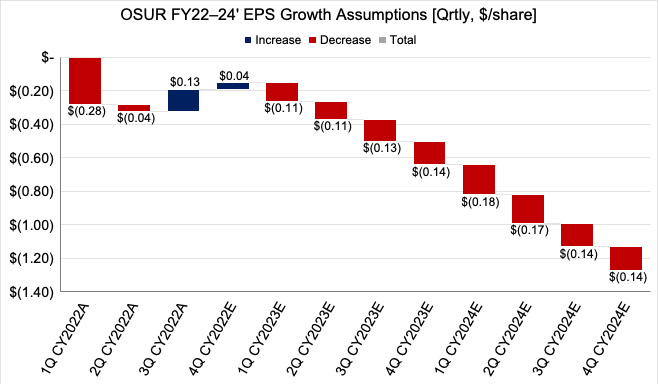
Net-net, we reaffirm our hold thesis on OraSure Technologies, Inc., as we’ve yet to see a meaningful delta in the operational, divisional aspects we’d hoped to from last period. Valuations are equally unsupportive, both in today’s and forward looking terms. Rate hold on OraSure Technologies, Inc., $3.04 price target.
Be the first to comment