

Bet_Noire
A guest post by D Coyne
The OPEC Monthly Oil Market Report (MOMR) for August 2022 was published recently. The last month reported in most of the OPEC charts that follow is July 2022 and output reported for OPEC nations is crude oil output in thousands of barrels per day (kb/d). In most of the OPEC charts that follow, the blue line is monthly output and the red line is the centered twelve-month average (CTMA) output.
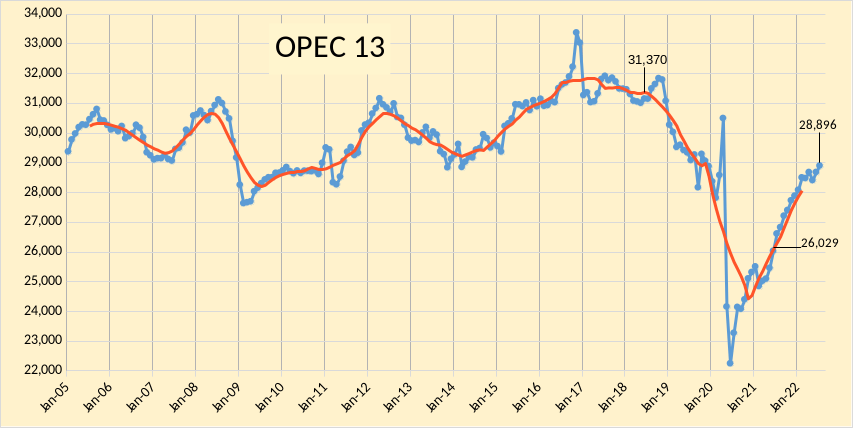
Figure 1
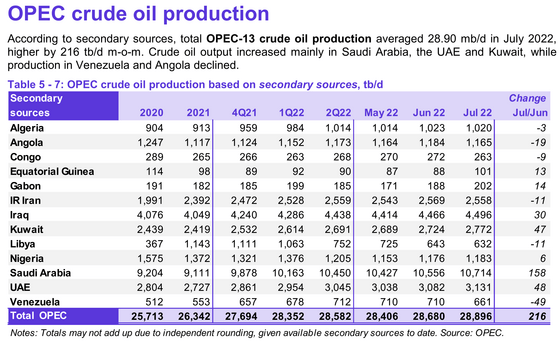
Figure 2
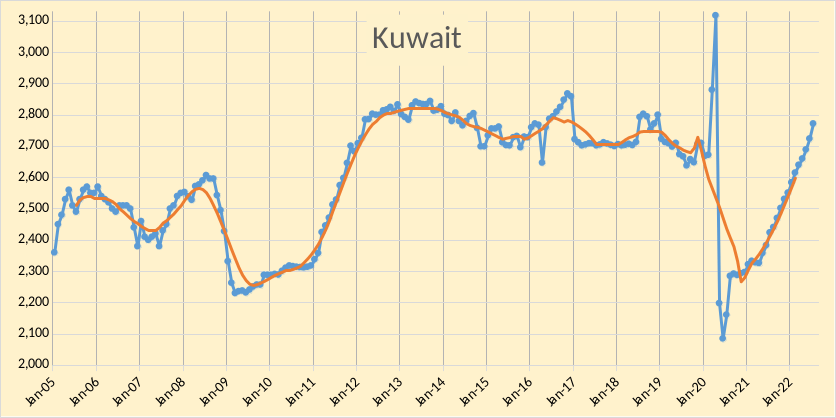
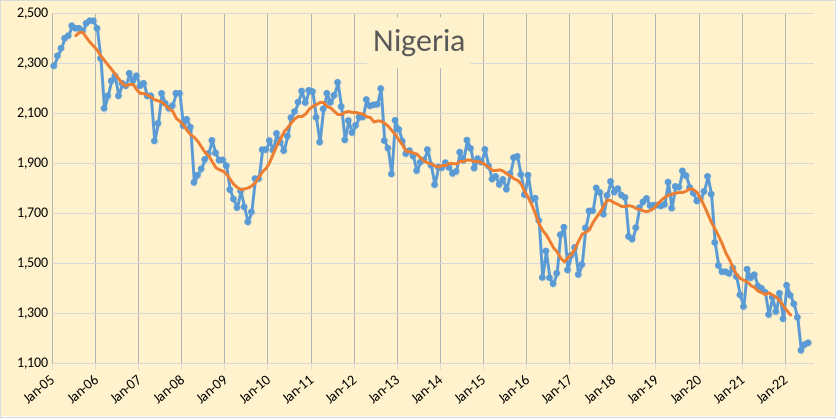
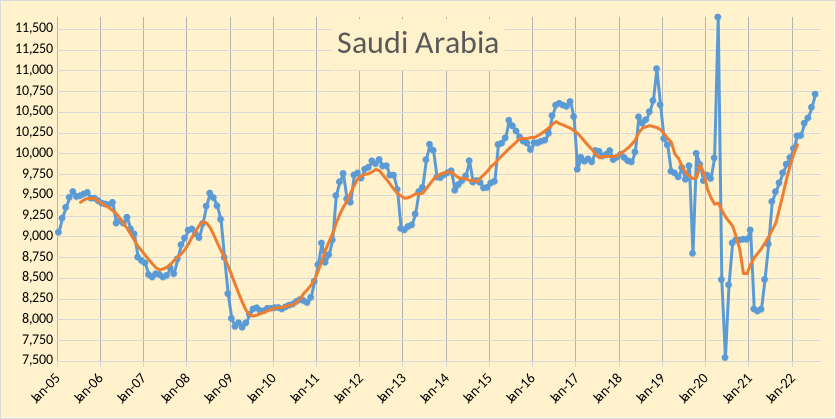
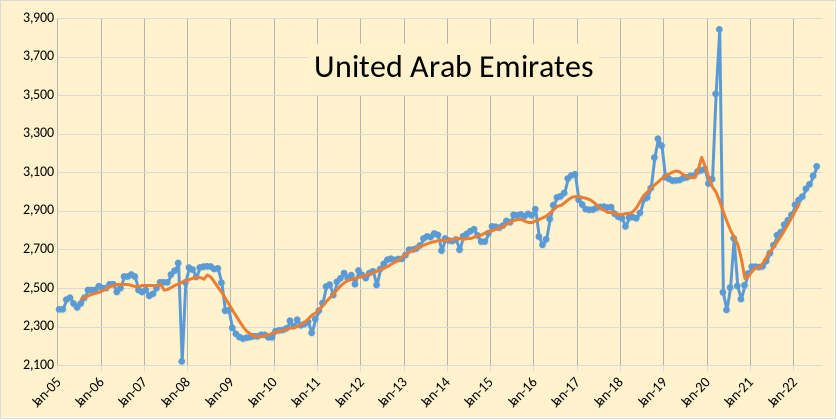
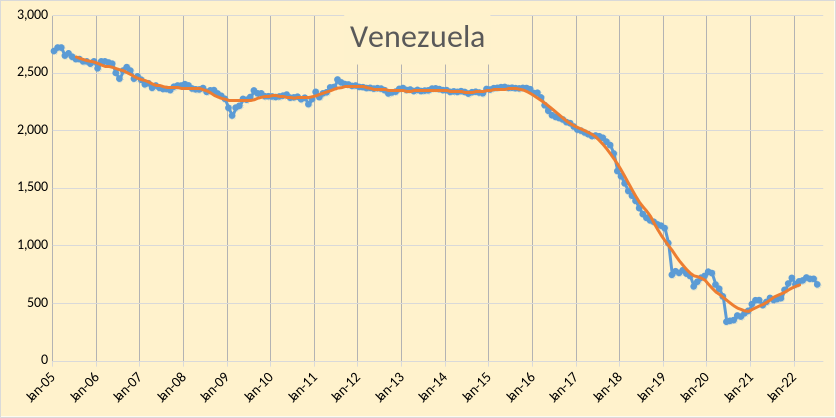
OPEC output was revised lower in June 2022 by 36 kb/d and May 2022 output was revised down by 76 kb/d compared to last month’s MOMR. The bulk of the July increase in OPEC output (73%) was from Saudi Arabia (158), with smaller increases from UAE (48), Kuwait (47), and Iraq (30). Venezuela had a decrease of 49 kb/d. The rest of the OPEC producers had small increases or decreases of less than 20 kb/d with a total decrease of 18 kb/d for all 8 nations.
In the chart below, we have Russian C + C and OPEC crude oil output. Output is 2561 kb/d below the centered 12-month average in November 2018 (when world output was at its peak). I used estimates of Russian output from Tass at this link for output in May and June (1 tonne=7.33 barrels) and the link here was used for the July 2022 estimate. The Russian crude plus condensate data has been harder to find since March when the war with Ukraine started.
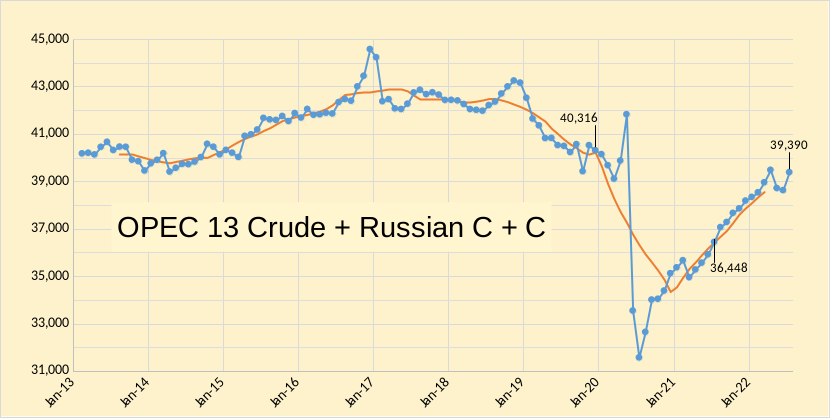
Figure 3
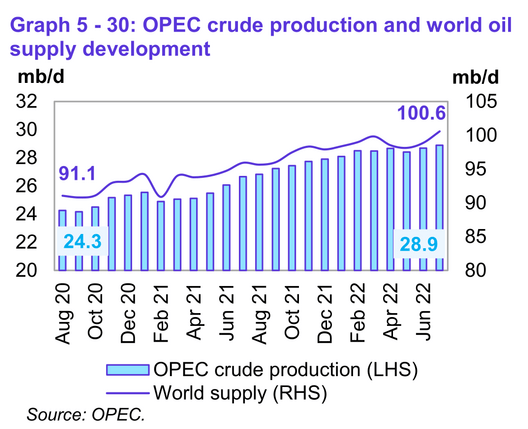
Figure 4
World Liquids supply increased to 100.6 Mb/d in July 2022, about 9.5 Mb/d higher than 2 years ago.
Figure 5
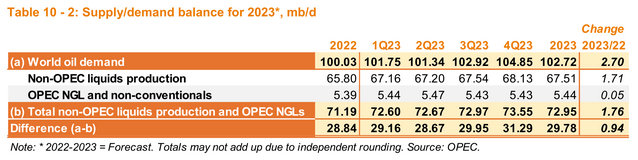
Figure 6
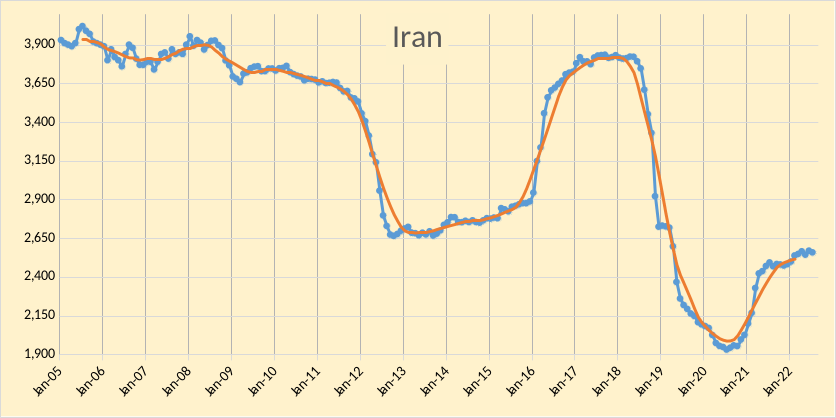
It is unlikely that OPEC will be able to meet the call on OPEC of 30 Mb/d or more in the second half of 2023 unless a deal is reached with Iran on the JCPOA (aka Nuclear Deal) in the near term and sanctions on Iran are quickly removed, even then it will take time for Iran to ramp up output, if an agreement is reached.
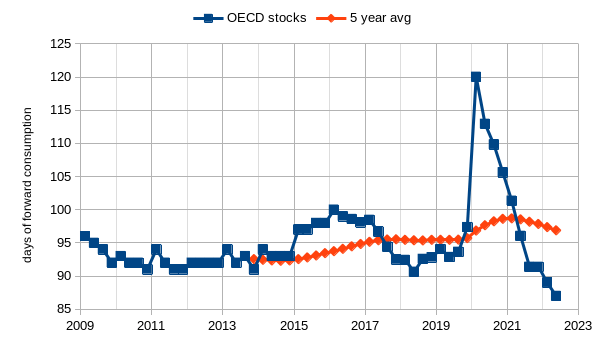
Figure 7
OECD stocks using days of forward consumption are presented in Figure 7 above along with the trailing 5-year average from 2013Q4 to 2022Q2. Currently, they are at 87 days (includes government and commercial petroleum stocks) lower than any quarter from 2009Q1 to 2022Q1 and about 10 days below the 5-year average (97 days). Looking at the chart, it seems stocks at days of forward supply between 90 and 94 days usually results in high oil prices, I expect high oil prices (which I define as $80/bo or more in 2021 US$) will continue unless we see a severe recession (which I define as World annual real GDP growth of negative 1% or lower).
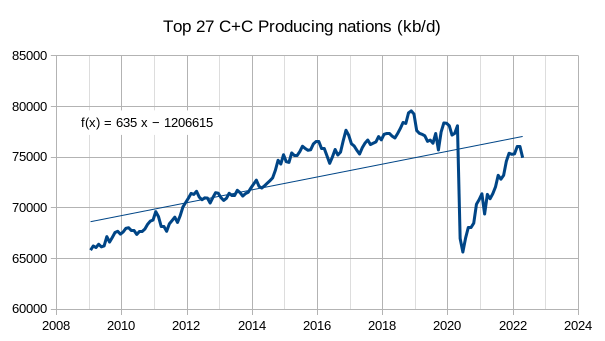
Figure 8
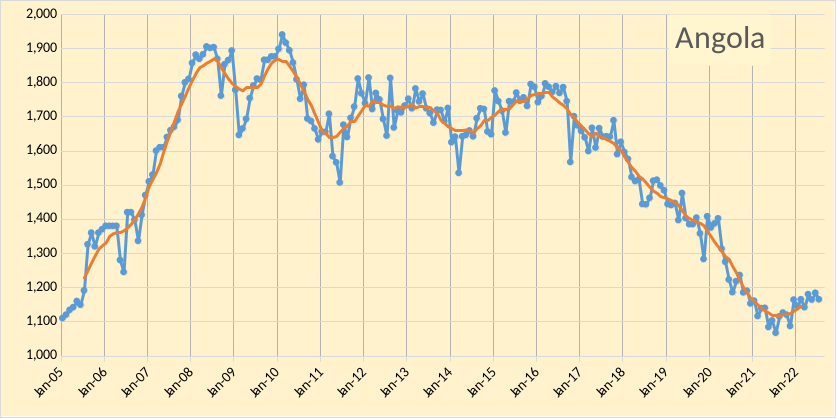
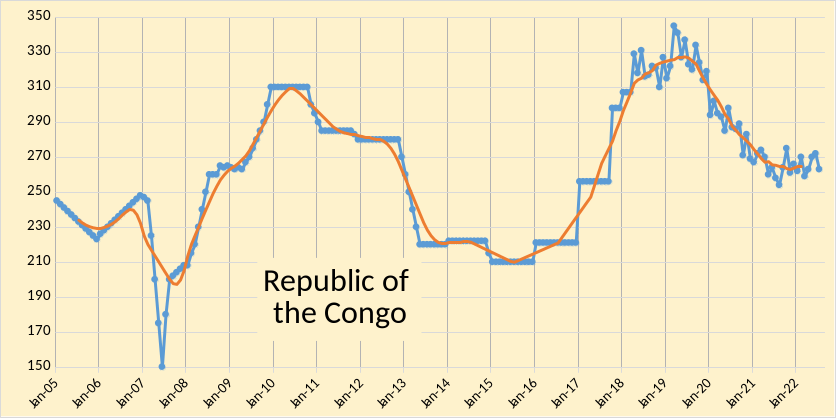
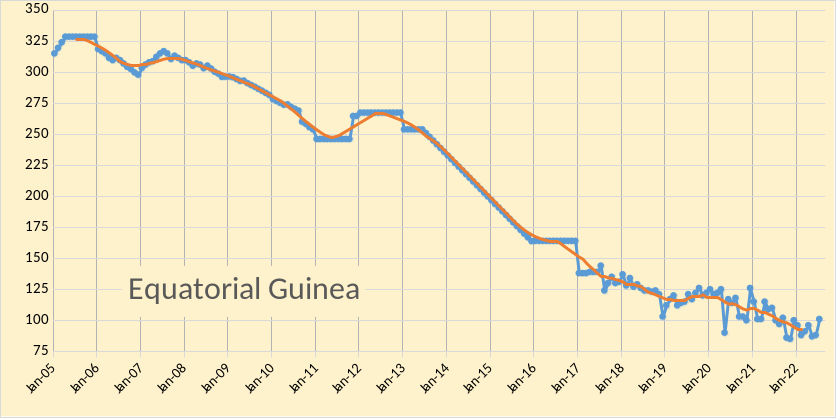
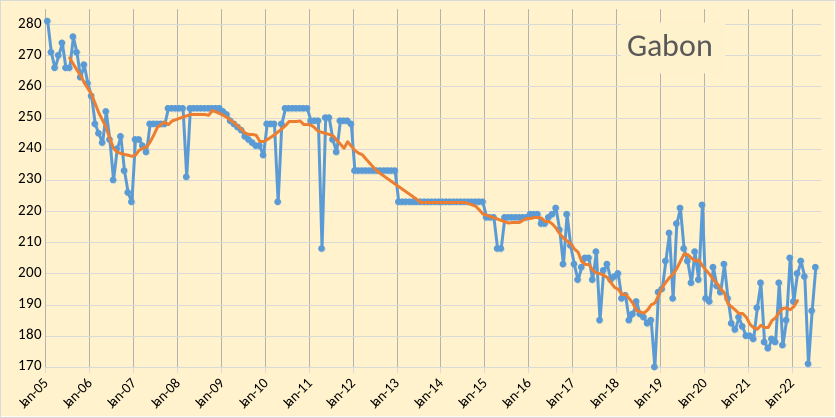
The Crude plus Condensate (C+C) output from the top 27 oil producing nations in April 2022 is presented in Figure 8 above. The average annual rate of increase in output from Jan 2009 to April 2022 using an OLS trendline is 635 kb/d each year. If we do a similar chart over the Jan 2009 to Dec 2019 period (eliminating the pandemic), the average annual rate of increase is 1272 kb/d each year using OLS to estimate the trend. The 27 nations include the 16 non-OPEC producers covered in the previous post along with Argentina, only the top 10 OPEC producers are included in this group of 27 nations, we leave out Republic of the Congo, Equatorial Guinea, and Gabon which all produce under 300 kb/d and had combined output of only 566 kb/d in July 2022.
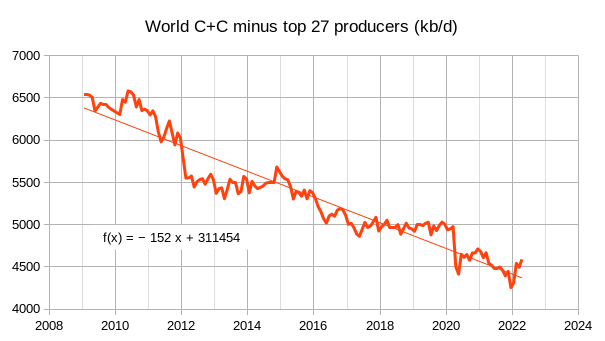
Figure 9
Figure 9 above presents World C+C minus output from the top 27 oil producing nations from Jan 2009 to April 2022. The average annual decrease in output is 152 kb/d each year, using OLS over the entire period presented to estimate the trend. Using these estimates suggests about 85 +/- 1 Mb/d for World C+C output in 2028 which I expect may be the peak in World C plus C output.
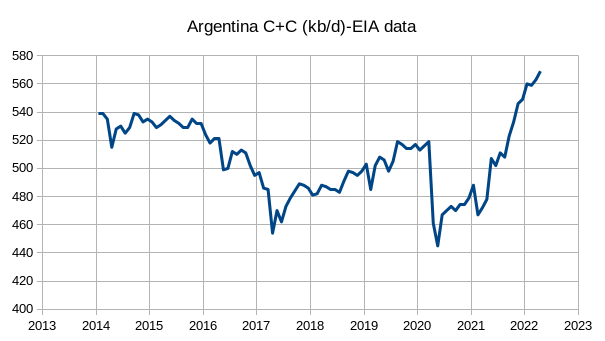
Figure 10
Above, I present output for Argentina from Jan 2014 to April 2022 for completeness. The charts for the other 26 nations that constitute the top oil producing nations are covered in this post for OPEC and in last week’s post for non-OPEC oil producers.
Editor’s Note: The summary bullets for this article were chosen by Seeking Alpha editors.
Be the first to comment