

onurdongel
This article was co-produced with Dividend Sensei.
The 2022 bear market has taught all of us important lessons, but one of the biggest is the importance of safe dividends.
When you are getting paid handsomely to wait out inevitable market declines like this one it’s a lot easier to stay calm, rational, and disciplined.
Why is that so important?
Because according to research by Citigroup, Bank of America, and JPMorgan, 80% to 99.9% of the market’s long-term returns are generated by bear markets.
In other words, stocks aren’t the best performing asset class in history despite bear markets, but precisely because of bear markets.
This is when the excessive euphoria and just plain stupidity of the last few years get washed out, and money flows back to rational places.
So let me show you why ONEOK (NYSE:OKE), a fast-growing 6.6% yielding blue-chip is a name retirees can trust.
Not just to provide generous income in all economic and market conditions, but also to help you compound your savings so you can potentially retire in safety and splendor.
Reason One: ONEOK Is The Complete Package
Here is the bottom-line up front on ONEOK.
NO K1 tax form.
-
c-corp with qualified dividends
-
none of the tax complexities of K1 tax forms
-
no dividend tax withholdings in taxable accounts like with CA pipeline companies
More Reasons To Potentially Buy OKE Today
-
89% quality low-risk 12/13 Super SWAN Midstream
-
89th highest quality company on the Master List (82nd percentile)
-
3rd highest quality midstream
-
91% dividend safety score
-
0-year dividend growth streak (no cuts for 33 years, since 1989)
-
6.6% very safe yield
-
0.5% average recession dividend cut risk
-
1.5% severe recession dividend cut risk
-
9% conservatively undervalued (potential reasonable buy)
-
Fair Value: $62.61 (9.3X cash flow)
-
8.4X forward cash flow vs 8X to 9.5X historical
-
BBB stable outlook credit rating = 7.5% 30-year bankruptcy risk
-
73rd industry percentile risk management consensus = good
-
5% to 18% CAGR margin-of-error growth consensus range
-
8.9% CAGR median growth consensus
-
5-year consensus total return potential: 8% to 18% CAGR
-
base-case 5-year consensus return potential: 12% CAGR (25% more than the S&P consensus)
-
consensus 12-month total return forecast: 33%
-
Fundamentally Justified 12-Month Returns: 17% CAGR
OKE recently sold off 25% as energy stocks fell into a bear market. That bear market was NOT justified by the companies fundamentals.
OKE Long-Term Growth Outlook Is Intact
|
Metric |
2021 Growth Consensus |
2022 Growth Consensus |
2023 Growth Consensus |
2024 Growth Consensus |
2025 Growth Consensus |
2026 Growth Consensus |
2027 Growth Consensus |
|
Sales |
97% |
33% |
0% |
10% |
NA |
NA |
NA |
|
Dividend |
0% |
0% |
2% |
3% |
1% |
10% |
4% |
|
Operating Cash Flow |
28% |
11% |
12% |
3% |
NA |
NA |
NA |
|
EBITDA |
35% |
5% |
7% |
2% |
NA |
NA |
NA |
|
EBIT (operating income) |
45% |
-1% |
8% |
3% |
NA |
NA |
NA |
(Source: FAST Graphs, FactSet)
The dividend is expected to start growing at a modest rate starting next year.
Rolling Returns Since August 1985
OKE is a very consistent market beater, with average rolling returns of 15% but from bear market lows as high as 22% over the next 15 years and 29% over the next 10 years.
-
18.7X return in 15 years
-
13.1X return in 10 years
OKE 2024 Consensus Total Return Potential
FAST Graphs Fast Graphs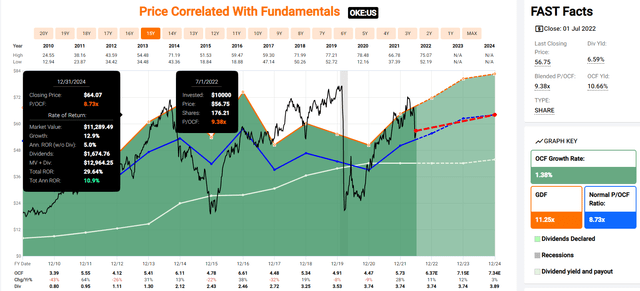
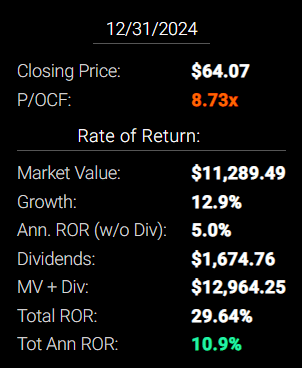
If OKE grows as analysts expect by 2024 and returns to historical mid-range fair value, it could deliver 30% total returns or 11% annually.
OKE 2027 Consensus Total Return Potential
FAST Graphs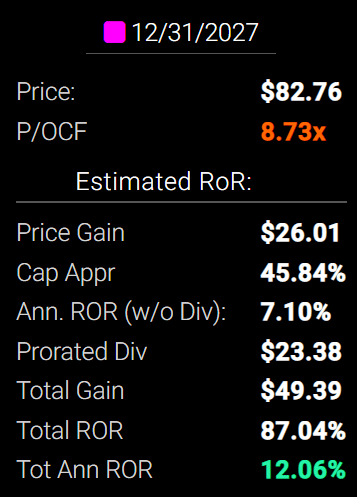
By 2027 if OKE grows as expected and returns to historical mid-range fair value, it could deliver 87% total returns or 12% annually.
-
about 25% more than the S&P 500 consensus
OKE Long-Term Consensus Total Return Potential
|
Investment Strategy |
Yield |
LT Consensus Growth |
LT Consensus Total Return Potential |
Long-Term Risk-Adjusted Expected Return |
Long-Term Inflation And Risk-Adjusted Expected Returns |
Years To Double Your Inflation & Risk-Adjusted Wealth |
10-Year Inflation And Risk-Adjusted Expected Return |
|
ONEOK |
6.6% |
8.9% |
15.5% |
10.9% |
8.4% |
8.6 |
2.24 |
|
Safe Midstream |
6.3% |
6.4% |
12.7% |
8.9% |
6.4% |
11.2 |
1.86 |
|
High-Yield |
3.1% |
12.7% |
15.8% |
11.1% |
8.6% |
8.4 |
2.28 |
|
REITs |
3.0% |
7.8% |
10.8% |
7.6% |
5.1% |
14.1 |
1.64 |
|
Dividend Aristocrats |
2.4% |
8.5% |
10.9% |
7.6% |
5.2% |
14.0 |
1.65 |
|
S&P 500 |
1.8% |
8.5% |
10.3% |
7.2% |
4.7% |
15.2 |
1.59 |
(Sources: Morningstar, FactSet, Ycharts)
-
analysts expect OKE to deliver 15.5% long-term returns, similar to what it’s done historically
-
more than most popular high-yield strategies as well as the dividend aristocrats and S&P 500
OKE Total Returns Since August 1985
OKE’s historical 13.3% CAGR total return includes the current 25% bear market.
-
102X return since 1985
-
38X adjusted for inflation
-
more than 2X more than the S&P 500
A Dividend Growth Blue-Chip You Can Trust
-
no dividend cuts since 1989
-
despite four recessions
-
and five major oil crashes
|
Portfolio |
1986 Income Per $1,000 Investment |
2021 Income Per $1,000 Investment |
Annual Income Growth |
Starting Yield |
2021 Yield On Cost |
|
ONEOK |
$87 |
$6,270 |
13.00% |
8.7% |
627.0% |
(Source: Portfolio Visualizer Premium)
OKE’s historical dividend growth rate is 13%, far higher than the S&P 500’s 8%.
Its 8.7% yield in 2006 has become a 627% yield on cost in 2021.
What about the future?
|
Analyst Consensus Income Growth Forecast |
Risk-Adjusted Expected Income Growth |
Risk And Tax-Adjusted Expected Income Growth |
Risk, Inflation, And Tax Adjusted Income Growth Consensus |
|
15.1% |
10.6% |
9.0% |
6.4% |
(Source: DK Research Terminal, FactSet)
Analysts expect 15% income growth from OKE in the future, which, adjusted for the risk of it not growing as expected, inflation, and taxes, is about 6.4% real expected income growth.
Now compare that to what they expect from the S&P 500.
|
Time Frame |
S&P Inflation-Adjusted Dividend Growth |
S&P Inflation-Adjusted Earnings Growth |
|
1871-2021 |
1.6% |
2.1% |
|
1945-2021 |
2.4% |
3.5% |
|
1981-2021 (Modern Falling Rate Era) |
2.8% |
3.8% |
|
2008-2021 (Modern Low Rate Era) |
3.5% |
6.2% |
|
FactSet Future Consensus |
2.0% |
5.2% |
(Sources: S&P, FactSet, Multipl.com)
What about a 60/40 retirement portfolio?
-
0.5% consensus inflation, risk, and tax-adjusted income growth.
In other words, OKE is expected to generate 3.5X faster real income growth than the S&P 500 and 13X faster income growth than a 60/40.
-
but with a very safe 6.6% yield on day one (about 4X higher)
What inflation-adjusted returns do analysts expect in the future?
Inflation-Adjusted Consensus Return Potential: $1,000 Initial Investment
|
Time Frame (Years) |
7.6% CAGR Inflation-Adjusted S&P Consensus |
8.4% Inflation-Adjusted Aristocrats Consensus |
13.0% CAGR Inflation-Adjusted OKE Consensus |
Difference Between Inflation-Adjusted OKE Consensus Vs S&P Consensus |
|
5 |
$1,445.67 |
$1,493.29 |
$1,844.88 |
$399.21 |
|
10 |
$2,089.97 |
$2,229.92 |
$3,403.59 |
$1,313.62 |
|
15 |
$3,021.42 |
$3,329.92 |
$6,279.22 |
$3,257.81 |
|
20 |
$4,367.98 |
$4,972.54 |
$11,584.43 |
$7,216.45 |
|
25 |
$6,314.67 |
$7,425.45 |
$21,371.90 |
$15,057.23 |
|
30 |
$9,128.95 |
$11,088.36 |
$39,428.64 |
$30,299.69 |
(Source: DK Research Terminal, FactSet)
Analysts expect OKE to continue growing at its historical rate which could mean nearly 40X inflation-adjusted returns over the next 30 years vs. 38X since 1985.
|
Time Frame (Years) |
Ratio Aristocrats/S&P Consensus |
Ratio Inflation-Adjusted OKE Consensus vs S&P consensus |
|
5 |
1.03 |
1.28 |
|
10 |
1.07 |
1.63 |
|
15 |
1.10 |
2.08 |
|
20 |
1.14 |
2.65 |
|
25 |
1.18 |
3.38 |
|
30 |
1.21 |
4.32 |
(Source: DK Research Terminal, FactSet)
Which is potentially 4X more than the S&P 500 and 3.5X the dividend aristocrats
OKE Investment Decision Score
Dividend Kings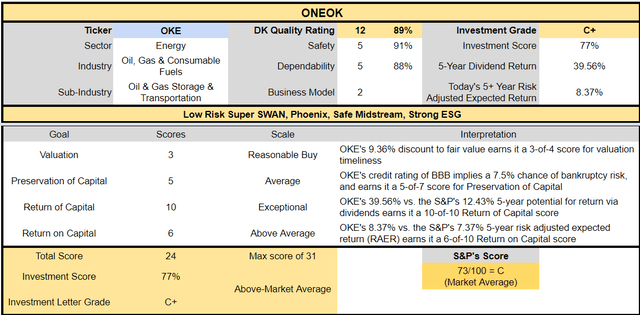
For anyone comfortable with its risk profile, OKE is a potentially reasonable and prudent fast-growing high-yield blue-chip.
-
9% discount vs 5% market discount = 4% better valuation
-
6.6% yield vs 1.7% yield (and a much safer yield at that) and about 4X higher
-
potentially 55% higher long-term return potential than S&P 500 overtime
-
about 12% better risk-adjusted expected return over the next five years
-
40% of your investment repaid in consensus dividends within five years, about 4X the S&P 500
Reason Two: One Of The World’s Highest Quality Companies
There are many ways to measure safety and quality and I factor in pretty much all of them.
The Dividend Kings’ overall quality scores are based on a 253-point model that includes:
-
Dividend safety
-
Balance sheet strength
-
Credit ratings
-
Credit default swap medium-term bankruptcy risk data
-
Short and long-term bankruptcy risk
-
Accounting and corporate fraud risk
-
Profitability and business model
-
Growth consensus estimates
-
Management growth guidance
-
Historical earnings growth rates
-
Historical cash flow growth rates
-
Historical dividend growth rates
-
Historical sales growth rates
-
Cost of capital
-
GF Scores
-
Long-term risk-management scores from MSCI, Morningstar, FactSet, S&P, Reuters’/Refinitiv, and Just Capital
-
Management quality
-
Dividend-friendly corporate culture/income dependability
-
Long-term total returns (a Ben Graham sign of quality)
-
Analyst consensus long-term return potential
In fact, it includes over 1,000 fundamental metrics including the 12 rating agencies we use to assess fundamental risk.
-
credit and risk management ratings make up 41% of the DK safety and quality model
-
dividend/balance sheet/risk ratings make up 82% of the DK safety and quality model
How do we know that our safety and quality model works well?
During the two worst recessions in 75 years, our safety model 87% of blue-chip dividend cuts, the ultimate baptism by fire for any dividend safety model.
How does OKE score on our comprehensive safety and quality models?
OKE Dividend Safety
|
Rating |
Dividend Kings Safety Score (162 Point Safety Model) |
Approximate Dividend Cut Risk (Average Recession) |
Approximate Dividend Cut Risk In Pandemic Level Recession |
|
1 – unsafe |
0% to 20% |
over 4% |
16+% |
|
2- below average |
21% to 40% |
over 2% |
8% to 16% |
|
3 – average |
41% to 60% |
2% |
4% to 8% |
|
4 – safe |
61% to 80% |
1% |
2% to 4% |
|
5- very safe |
81% to 100% |
0.5% |
1% to 2% |
|
OKE |
91% |
0.5% |
1.5% |
|
Risk Rating |
Low-Risk (73rd industry percentile risk-management consensus) |
A- stable outlook credit rating 3.4% 30-year bankruptcy risk |
20% OR LESS Max Risk Cap Recommendation (Each) |
Long-Term Dependability
|
Company |
DK Long-Term Dependability Score |
Interpretation |
Points |
|
Non-Dependable Companies |
21% or below |
Poor Dependability |
1 |
|
Low Dependability Companies |
22% to 60% |
Below-Average Dependability |
2 |
|
S&P 500/Industry Average |
61% (61% to 70% range) |
Average Dependability |
3 |
|
Above-Average |
71% to 80% |
Very Dependable |
4 |
|
Very Good |
81% or higher |
Exceptional Dependability |
5 |
|
OKE |
88% |
Exceptional Dependability |
5 |
Overall Quality
|
OKE |
Final Score |
Rating |
|
Safety |
91% |
5/5 very safe |
|
Business Model |
70% |
2/3 narrow and stable moat |
|
Dependability |
88% |
5/5 exceptional |
|
Total |
89% |
12/13 Super SWAN |
|
Risk Rating |
3/3 Low-Risk |
|
|
15% OR LESS Max Risk Cap Rec |
10% Margin of Safety For A Potentially Good Buy |
OKE is the 89th highest quality company on the Masterlist.
How significant is this? The DK 500 Master List is one of the world’s best watchlists including
-
every dividend aristocrat (S&P companies with 25+ year dividend growth streaks)
-
every dividend champion (every company, including foreign, with 25+ year dividend growth streaks)
-
every dividend king (every company with 50+ year dividend growth streaks)
-
every foreign aristocrat (every company with 20+ year dividend growth streaks)
-
40 of the world’s best growth stocks
In other words, even among the world’s best companies, OKE is higher quality than 82% of them.
-
3rd highest quality midstream behind EPD (90%) and ENB (89%)
Why I Trust ONEOK And So Can You
OKE is one of the oldest midstreams in North America, founded in 1906 in Tulsa, Oklahoma. It’s survived and thrived through:
-
18 recessions
-
four depressions
-
six major oil crashes since the 1980s
-
two World Wars
-
a pandemic that killed 5% of humanity
-
inflation as high as 22%
-
interest rates as high as 20%
-
treasury yields as high as 16%
-
77 stock market corrections
-
232 stock market pullbacks
OKE is built to last, and the bond market thinks its business will remain stable or growing through at least 2051.
Investment Thesis Summary
“Oneok brings together high-quality assets, some of the strongest near- to medium-term growth prospects in our coverage as Rockies volumes continue their ongoing rebound, a C-Corporation structure, and a well-respected management team in a compelling package.
About 90% of the firm’s earnings are fee-based, 80%-90% of its customers are investment-grade, and the firm hedges its limited commodity price exposure. With the reduced capital program, Oneok does finally have material levels of excess cash flow in 2022, perhaps 18 months behind other U.S. midstream peers to buy back more stock.
We estimate there could be up to $525 million in buybacks in 2022, though knowing Oneok’s penchant for finding accretive growth projects, this is also equally likely to be plowed back into attractive growth assets.” – Morningstar
OKE owns 40,000 miles of natural gas and NGL pipelines mostly focused on the middle of the country.
-
the North Dakota Bakken, Texas Permian, and Oklahoma Barnet shale formations
-
10% of all US natural gas runs through its network
OKE has 84% of its cash flows from fee-based revenue and hedges the remainder to minimize cash flow variability even in the face of extreme oil & gas price volatility.
This is what’s allowed it to deliver stable or growing dividends for 33 consecutive years.
|
Year |
Distributable Cash Flow |
Free Cash Flow |
Dividends |
DCF Payout Ratio |
FCF Payout Ratio |
|
2022 |
$2,713.0 |
$2,141.00 |
$1,676.25 |
61.8% |
78.3% |
|
2023 |
$2,942.0 |
$2,504.00 |
$1,707.54 |
58.0% |
68.2% |
|
2024 |
$3,116.0 |
$2,965.00 |
$1,761.18 |
56.5% |
59.4% |
|
2025 |
$3,198.0 |
$2,655.00 |
$1,779.06 |
55.6% |
67.0% |
|
2026 |
$3,266.0 |
$2,709.00 |
$1,957.86 |
59.9% |
72.3% |
|
2027 |
$3,298.0 |
$2,730.00 |
$2,033.85 |
61.7% |
74.5% |
|
Annual Growth |
3.98% |
4.98% |
3.94% |
-0.04% |
-0.99% |
(Source: FactSet Research Terminal)
Rating agencies consider a DCF payout ratio of 83% or less safe and OKE is running at 62% this year.
It’s also a fully free-cash-flow self-funding midstream with zero reliance on equity funding for growth.
-
after spending on growth OKE’s free cash flow is enough to cover its dividend with a nice safety buffer
-
FCF self-funding is the platinum safety standard for this industry
OKE’s business is:
-
60% natural gas liquids
-
over 25% natural gas processing
-
over 10% natural gas pipelines
-
84% weighted revenue from fees
-
80% to 90% of customers are investment-grade
OKE’s main focus is on natural gas liquids like ethane and liquified petroleum gas.
-
S&P estimates over 20% growth in LPG demand from 2020 through 2040
-
over 60% growth in ethane demand
-
NGLs are used in everything from 99% of pharmaceuticals to EV batteries and construction equipment
-
present in 96% of products produced by our economy
OKE’s plans for a transition to a green energy future started in 2007 and in 2020 it established a renewable investment team who been looking into opportunities in things like renewable natural gas.
According to the American Gas Foundation, RNG could replace up to 90% of current US gas consumption.
-
as well as serving as a feedstock for NGLs and petrochemicals
OKE already has some pipelines transporting RNG reducing CO2 emissions by 600,000 tons per year.
“Our net debt-to-EBITDA on an annualized run-rate basis remains below 4 times, and we continue to view 3.5 times or lower as our long-term aspirational leverage goal.” – CFO, Q1 conference call
OKE plans to retain a very strong balance sheet, with a long-term debt/EBITDA target of 3.5 vs 5.0 or less safe according to rating agencies.
Quantitative Analysis: The Math Backing Up The Investment Thesis
Ben Graham recommended combining qualitative (the story) analysis with quantitative analysis looking at the past, present, and likely future.
OKE Credit Ratings
|
Rating Agency |
Credit Rating |
30-Year Default/Bankruptcy Risk |
Chance of Losing 100% Of Your Investment 1 In |
|
S&P |
BBB Stable Outlook |
7.50% |
13.3 |
|
Fitch |
BBB Stable Outlook |
7.50% |
13.3 |
|
Moody’s |
Baa3 (BBB- equivalent) positive Outlook |
11.00% |
9.1 |
|
Consensus |
BBB Stable Outlook |
8.67% |
11.5 |
(Source: S&P, Fitch, Moody’s, AMBest)
Rating agencies like OKE’s focus on deleveraging and maintaining a low payout ratio and FCF self-funding business model.
“The change of outlook to positive from stable reflects Moody’s expectation of a sustainable increase in ONEOK’s earnings and a decline in leverage to below 4x in 2022…Moody’s now expects the company to comfortably cover its growth and maintenance investment needs, as well as its sizable dividend, from operating cash flow.
The Baa3 rating and the positive outlook emphasize the company’s conservative financial policies that include the leverage target of 4x debt/EBITDA or less, as well as its experienced management team with an established track record of disciplined and timely delivery on financial and operating targets..
ONEOK’s Baa3 rating may be upgraded if the company demonstrates strong operating performance and growth in earnings driving its financial leverage consistently below 4x.
A downgrade of the ratings may be considered if the company is unable to maintain leverage below 5x or dividend coverage drops toward 1.2x.” – Moody’s
OKE’s financials are firmly in-line with investment-grade midstream guidelines.
OKE Leverage Consensus Forecast
|
Year |
Debt/EBITDA |
Net Debt/EBITDA (5.0 Or Less Safe According To Credit Rating Agencies) |
Interest Coverage (2+ Safe) |
|
2020 |
5.03 |
5.03 |
2.77 |
|
2021 |
3.99 |
3.99 |
3.54 |
|
2022 |
3.65 |
3.65 |
4.18 |
|
2023 |
3.28 |
3.28 |
4.64 |
|
2024 |
3.07 |
3.07 |
4.93 |
|
2025 |
3.27 |
3.27 |
4.55 |
|
2026 |
2.92 |
2.92 |
NA |
|
2027 |
2.79 |
2.79 |
NA |
|
Annualized Change |
-8.10% |
-8.10% |
10.40% |
(Source: FactSet Research Terminal)
Analysts expect OKE’s steady de-leveraging post-pandemic to continue, with a debt/EBITDA falling to under 3 by 2026.
OKE Balance Sheet Consensus Forecast
|
Year |
Total Debt (Millions) |
Cash |
Net Debt (Millions) |
Interest Cost (Millions) |
EBITDA (Millions) |
Operating Income (Millions) |
|
2020 |
$13,712 |
$524 |
$13,712 |
$713 |
$2,724 |
$1,977 |
|
2021 |
$13,497 |
$146 |
$13,497 |
$733 |
$3,380 |
$2,596 |
|
2022 |
$13,342 |
$167 |
$13,342 |
$680 |
$3,660 |
$2,843 |
|
2023 |
$12,770 |
$171 |
$12,770 |
$658 |
$3,896 |
$3,056 |
|
2024 |
$12,251 |
$188 |
$12,251 |
$635 |
$3,988 |
$3,132 |
|
2025 |
$13,049 |
NA |
$13,049 |
$662 |
$3,996 |
$3,010 |
|
2026 |
$12,805 |
NA |
$12,805 |
$632 |
$4,381 |
NA |
|
2027 |
$12,563 |
NA |
$12,563 |
$630 |
$4,508 |
NA |
|
Annualized Growth |
-1.24% |
-22.61% |
-1.24% |
-1.75% |
7.46% |
8.77% |
(Source: FactSet Research Terminal)
OKE’s debt is expected to drift lower over time while cash flows grow at some of the fastest rates in the industry.
OKE Bond Profile
-
$7.4 billion in liquidity
-
well-staggered bond maturities (no problem refinancing maturing debt)
-
100% unsecured bonds for maximum financial flexibility
-
bond investors so confident in OKE’s long-term prospects they are willing to lend to it for three decades at reasonable interest rates
-
the average borrowing cost is 5.0%
-
2.5% after the bond market’s 30-year inflation expectations
-
2.5% real borrowing costs vs 8.5% cash returns on invested capital
OKE Credit Default Swaps: Real-Time Fundamental Risk Analysis From The Bond Market
FactSet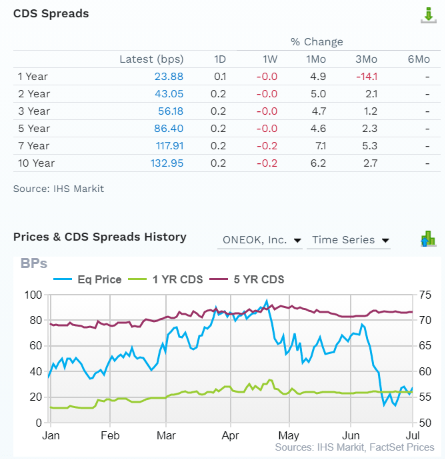
Credit default Swaps are the insurance policies bond investors take out against default.
-
they represent real-time fundamental risk assessment from the “smart money” on Wall Street
-
OKE’s fundamental risk has been relatively stable over the last six months
-
far more so than the stock price
-
the bond market is pricing in a 3.99% 30-year default risk, which is consistent with BBB+ credit ratings
-
basically, analysts, rating agencies, and the bond market all agree
-
OKE’s thesis is intact
-
23 analysts, 8 rating agencies, and the bond market make up our OKE expert consensus
-
31 expert consensus + the bond market monitoring MMM’s risk profile
-
how we track fundamental risk in real-time
-
to ensure high-probability/low-risk investment recommendations
OKE GF Score: The Newest Addition To The DK Safety And Quality Model
The GF Score is a ranking system that has been found to be closely correlated to the long-term performances of stocks by backtesting from 2006 to 2021.” – Gurufocus
GF Score takes five key aspects into consideration. They are:
-
Financial Strength
-
Profitability
-
Growth
-
Valuation
-
Momentum
OKE’s good score of 79/100 confirms its strong fundamental quality and attractive valuation.
OKE Profitability: Wall Street’s Favorite Quality Proxy
OKE’s historical profitability is in the top 30% of its peers
|
Metric |
TTM |
Industry Percentile |
Major Oil & Gas Companies More Profitable Than OKE (Out Of 1,113) |
|
Gross Margins |
19.54% |
39.62 |
672 |
|
Operating Margin |
13.79% |
63.27 |
409 |
|
Net Margin |
8.01% |
62.14 |
421 |
|
Return On Equity |
25.18% |
82.28 |
197 |
|
Return On Assets |
6.37% |
71.25 |
320 |
|
Returns On Invested Capital |
8.72% |
70.56 |
328 |
|
Return On Capital (Greenblatt) |
14% |
63.2 |
410 |
|
Return On Capital Employed |
13% |
69.71 |
337 |
|
Average |
13.58% |
65.25 |
387 |
(Source: GuruFocus Premium)
-
ROCE is the major profitability metric for the industry and OKE’s 13% ROCE in the last year is in the top 30% of its peers
-
confirming a narrow moat asset midstream
Over the last 35 years, OKE’s profitability has been relatively stable.
-
confirming a narrow and stable moat
-
FCF margin has been soaring since growth spending was cut in the pandemic.
OKE Profit Margin Consensus Forecast
|
Year |
FCF Margin |
EBITDA Margin |
EBIT (Operating) Margin |
Net Margin |
|
2020 |
-2.0% |
31.9% |
23.1% |
7.2% |
|
2021 |
11.8% |
20.4% |
15.7% |
9.1% |
|
2022 |
9.9% |
16.9% |
13.1% |
8.1% |
|
2023 |
11.4% |
17.8% |
14.0% |
8.9% |
|
2024 |
12.5% |
16.9% |
13.2% |
8.7% |
|
Annualized Growth |
NA |
-14.72% |
-13.02% |
5.01% |
|
Annualized Growth (Post Pandemic) |
2.06% |
-6.20% |
-5.50% |
-1.28% |
(Source: FactSet Research Terminal)
OKE slashed spending in 2020 boosting margins to very high levels.
As it ramps up growth spending over time in the recovery margins are expected to come down a bit though stabilize at industry-leading levels and FCF margins are expected to keep rising.
Reason Three: The Growth King Of Midstream
The way OKE has plunged 25% in a matter of weeks you might think the US energy industry was on its death bead and OKE’s cash flows were about to fall off a cliff.
Here’s what analysts actually expect.
OKE Medium-Term Growth Consensus Forecast
|
Year |
Sales |
Free Cash Flow |
EBITDA |
EBIT (Operating Income) |
Net Income |
|
2020 |
$8,542 |
-$174 |
$2,724 |
$1,977 |
$613 |
|
2021 |
$16,540 |
$1,951 |
$3,380 |
$2,596 |
$1,500 |
|
2022 |
$21,692 |
$2,141 |
$3,660 |
$2,843 |
$1,750 |
|
2023 |
$21,900 |
$2,504 |
$3,896 |
$3,056 |
$1,946 |
|
2024 |
$23,646 |
$2,965 |
$3,988 |
$3,132 |
$2,063 |
|
2025 |
NA |
$2,655 |
$3,996 |
$3,010 |
$1,861 |
|
2026 |
NA |
$2,709 |
$4,381 |
NA |
NA |
|
2027 |
NA |
$2,730 |
$4,508 |
NA |
NA |
|
Annualized Growth |
28.99% |
NA |
7.46% |
8.77% |
24.87% |
|
Annualized Growth (Post Pandemic) |
12.65% |
5.76% |
4.92% |
3.77% |
5.54% |
|
Cumulative Over The Next 3 Years |
$67,238 |
$7,610 |
$11,544 |
$9,031 |
$5,759 |
(Source: FactSet Research Terminal)
OKE’s post-pandemic recovery is expected to be fueled by its large growth projects coming online in the coming years as well as the recovery in the NGL market off the lowest prices in history.
-
another reason margins were artificially elevated in 2020
-
$7.6 billion in free cash flow from 2022 through 2024
-
$15.7 billion in FCF from 2022 through 2027
OKE Dividend Growth Consensus Forecast
|
Year |
Dividend Consensus |
FCF Consensus |
FCF Payout Ratio |
Retained (Post-Dividend) Free Cash Flow |
Buyback Potential |
Debt Repayment Potential |
|
2022 |
$3.75 |
$4.81 |
78.0% |
$474 |
1.87% |
3.6% |
|
2023 |
$3.82 |
$5.53 |
69.1% |
$764 |
3.02% |
6.0% |
|
2024 |
$3.94 |
$6.06 |
65.0% |
$948 |
3.74% |
7.4% |
|
2025 |
$3.98 |
$6.14 |
64.8% |
$966 |
3.81% |
7.9% |
|
2026 |
$4.38 |
$6.39 |
68.5% |
$898 |
3.54% |
6.9% |
|
2027 |
$4.55 |
$6.56 |
69.4% |
$898 |
3.54% |
6.9% |
|
Total 2022 Through 2027 |
$24.42 |
$35.49 |
68.8% |
$4,948.29 |
19.52% |
38.75% |
|
Annualized Rate |
3.94% |
6.40% |
-2.31% |
13.65% |
13.65% |
14.16% |
(Source: FactSet Research Terminal)
83% is the safety guideline for DCF payout ratios.
-
OKE’s 2022 consensus DCF payout ratio is 61%
Analysts expect an average FCF payout ratio of 69% over the next five years, allowing OKE to retain $5 billion in post-dividend free cash flow.
-
enough to potentially pay off 40% of its debt
-
or buyback up to 20% of its stock
OKE Buyback Consensus Forecast
|
Year |
Consensus Buybacks ($ Millions) |
% Of Shares (At Current Valuations) |
Market Cap |
|
2022 |
NA |
0.0% |
$25,345 |
|
2023 |
NA |
0.0% |
$25,345 |
|
2024 |
$600.0 |
2.4% |
$25,345 |
|
2025 |
$600.0 |
2.4% |
$25,345 |
|
2026 |
$600.0 |
2.4% |
$25,345 |
|
2027 |
$600.0 |
2.4% |
$25,345 |
|
Total 2024-2027 |
$2,400.00 |
9.5% |
$25,345 |
|
Annualized Rate |
2.46% |
Average Annual Buybacks |
$600.00 |
(Source: FactSet Research Terminal)
Starting in 2024 analysts expect OKE to start a $600 million annual buyback.
-
Morningstar believes up to $525 million could begin this year
|
Time Frame (Years) |
Net Buyback Rate |
Shares Remaining |
Net Shares Repurchased |
Each Share You Own Is Worth X Times More (Not Including Future Growth And Dividends) |
|
5 |
2.5% |
88.29% |
11.71% |
1.13 |
|
10 |
2.5% |
77.95% |
22.05% |
1.28 |
|
15 |
2.5% |
68.82% |
31.18% |
1.45 |
|
20 |
2.5% |
60.77% |
39.23% |
1.65 |
|
25 |
2.5% |
53.65% |
46.35% |
1.86 |
|
30 |
2.5% |
47.37% |
52.63% |
2.11 |
(Source: DK Research Terminal, Ycharts)
If OKE buys back stock as analysts expect in the future, that could reduce the share count by 53% over the next 30 years, increasing the intrinsic value of your shares by 2.1X, not counting future earnings or dividend growth.
OKE Long-Term Growth Outlook
-
8.9% to 112.6% growth consensus range (five sources)
-
the median consensus from all 23 analysts is 8.9%
-
the highest of any blue-chip midstream
How accurate are analyst forecasts for OKE?
-
Smoothing for outliers historical analyst margins-of-error are 35% to the downside and 40% to the upside
-
margin-of-error adjusted consensus growth range: 5% to 18% CAGR
-
70% statistical probability that OKE grows 5% to 18% over time
OKE has historically grown from low single digits to double digits and analysts expect future growth to be similar to the last 13 years.
Reason Four: A Wonderful Company At A Fair Price
For 20 years, OKE has been valued by tens of millions of income growth investors at 8X cash flow to 9.5X cash flow outside of bear markets and bubbles.
-
91% statistical probability the intrinsic value is within this range, in our estimation.
|
Metric |
Historical Fair Value Multiples (15-Years) |
2021 |
2022 |
2023 |
2024 |
12-Month Forward Fair Value |
|
5-Year Average Yield (Pure Industry Bear Market) |
5.60% |
$66.79 |
$66.79 |
$66.79 |
$70.36 |
|
|
Operating Cash Flow |
8.73 |
$50.02 |
$55.61 |
$62.42 |
$64.08 |
|
|
Average |
$57.20 |
$60.69 |
$64.53 |
$67.07 |
$62.61 |
|
|
Current Price |
$56.75 |
|||||
|
Discount To Fair Value |
0.79% |
6.49% |
12.05% |
15.39% |
9.36% |
|
|
Upside To Fair Value (NOT Including Dividends) |
0.80% |
6.94% |
13.71% |
18.19% |
10.32% (17% including dividends) |
|
|
2022 OCF |
2023 OCF |
2022 Weighted OCF |
2023 Weighted OCF |
12-Month Forward OCF |
12-Month Average Fair Value Forward P/OCF |
Current Forward P/OCF |
|
$6.37 |
$7.15 |
$3.19 |
$3.58 |
$6.76 |
9.26 |
8.39 |
I estimate OKE is worth about 9.3X cash flow and today it trades at 8.4X, an anti-bubble valuation.
|
Analyst Median 12-Month Price Target |
Morningstar Fair Value Estimate |
|
$71.89 (10.6X cash flow) |
$56.00 (8.3X cash flow) |
|
Discount To Price Target (Not A Fair Value Estimate) |
Discount To Fair Value |
|
21.06% |
-1.34% |
|
Upside To Price Target (Not Including Dividend) |
Upside To Fair Value (Not Including Dividend) |
|
26.68% |
-1.32% |
|
12-Month Median Total Return Price (Including Dividend) |
Fair Value + 12-Month Dividend |
|
$75.63 |
$59.74 |
|
Discount To Total Price Target (Not A Fair Value Estimate) |
Discount To Fair Value + 12-Month Dividend |
|
24.96% |
5.01% |
|
Upside To Price Target ( Including Dividend) |
Upside To Fair Value + Dividend |
|
33.27% |
5.27% |
Morningstar’s discount cash flow model estimates OKE’s fair value at the low end of its historical range.
Analysts expect OKE to become overvalued within a year, trading at a P/cash flow of 10.6X and generating a 33% total return.
-
17% total return would be justified within 12 months by its fundamentals
I don’t make recommendations based on 12-month price targets but on whether or not a company’s margin of safety sufficiently compensates you for its risk profile.
|
Rating |
Margin Of Safety For Low-Risk 12/13 Super SWAN quality companies |
2022 Price |
2023 Price |
12-Month Forward Fair Value |
|
Potentially Reasonable Buy |
0% |
$60.69 |
$64.53 |
$62.61 |
|
Potentially Good Buy |
10% |
$54.62 |
$58.08 |
$56.35 |
|
Potentially Strong Buy |
20% |
$48.55 |
$51.62 |
$50.09 |
|
Potentially Very Strong Buy |
30% |
$38.23 |
$45.17 |
$43.83 |
|
Potentially Ultra-Value Buy |
40% |
$36.41 |
$38.72 |
$37.56 |
|
Currently |
$56.75 |
6.49% |
12.05% |
9.36% |
|
Upside To Fair Value (Not Including Dividends) |
6.94% |
13.71% |
10.32% |
For anyone comfortable with its risk profile ONEOK is a potentially reasonable buy and pennies away from a potentially good buy.
Risk Profile: Why ONEOK Isn’t Right For Everyone
There are no risk-free companies and no company is right for everyone. You have to be comfortable with the fundamental risk profile.
What Could Cause OKE’s Investment Thesis To Break
-
safety falls to 40% or less
-
balance sheet collapses (unlikely, 7.5% probability according to rating agencies)
-
renewable energy transition plan fails
-
growth outlook falls to less than 1.2% for six years
-
OKE’s role in my portfolio is to deliver long-term 8+% returns with minimal fundamental risk
-
8+% total return requirement for defensive sectors (including midstream)
-
10+% for non-defensive (cyclical) sectors – like industrials
How long it takes for a company’s investment thesis to break depends on the quality of the company.
|
Quality |
Years For The Thesis To Break Entirely |
|
Below-Average |
1 |
|
Average |
2 |
|
Above-Average |
3 |
|
Blue-Chip |
4 |
|
SWAN |
5 |
|
Super SWAN |
6 |
|
Ultra SWAN |
7 |
|
100% Quality Companies (MSFT, LOW, and MA) |
8 |
These are my personal rule of thumb for when to sell a stock if the investment thesis has broken. OKE is highly unlikely to suffer such catastrophic declines in fundamentals.
Risk Profile Summary
“The single-greatest risk to the Oneok story is failure of international demand for natural gas liquids, particularly from China or India, to materialize…
Oneok holds some commodity price risk from volumes and equity ownership of natural gas and NGLs…However, the main risk to Oneok’s marketing business is a narrowing of spreads…
Oneok’s major ESG risks, in our view, are related to managing its carbon emissions profile at its carbon-intensive gathering and processing operations….
Oneok also has exposure to community relations or social issues in terms of managing stakeholder relationships. For example, even though it holds no direct ownership in the controversial Dakota Access Pipeline, its assets are exposed to the loss of volumes.” – Morningstar
OKE’s Risk Profile Includes
-
economic/market cyclicality risk- 16% commodity exposure (though management manages this with hedging)
-
regulatory risk (including shutting down the Dakota Access pipeline)
-
project completion risk: lots of lawsuits for big interstate projects are common
-
M&A execution risk
-
disruption risk: NGL demand growth might not materialize as planned
-
talent retention risk in the tightest job market in 50 years
-
cyber-security risk: hackers and ransomware (like the Colonial pipeline hack)
On the flip side, concerns about Oneok’s indirect exposure to the Dakota Access Pipeline and related assets have diminished as producers have lined up alternative takeaway options out of the Bakken, including rail. If DAPL were to shut down permanently (we estimate a 50% probability this could occur), Oneok’s exposure is immaterial.” – Morningstar
How do we quantify, monitor, and track such a complex risk profile?
By doing what big institutions do.
Long-Term Risk Analysis: How Large Institutions Measure Total Risk
-
see the risk section of this video to get an in-depth view (and link to two reports) of how DK and big institutions measure long-term risk management by companies
OKE Long-Term Risk-Management Consensus
|
Rating Agency |
Industry Percentile |
Rating Agency Classification |
|
MSCI 37 Metric Model |
98.0% |
AA Industry Leader, Positive Trend |
|
Morningstar/Sustainalytics 20 Metric Model |
87.8% |
24.0/100 Medium-Risk |
|
Reuters’/Refinitiv 500+ Metric Model |
86.4% |
Good |
|
S&P 1,000+ Metric Model |
59.0% |
Average, Positive Trend |
|
Just Capital 19 Metric Model |
66.7% |
Above-Average |
|
FactSet |
50.0% |
Average, Positive Trend |
|
Morningstar Global Percentile (All 15,000 Rated Companies) |
61.0% |
Above-Average |
|
Just Capital Global Percentile (All 954 Rated US Companies) |
76.1% |
Good |
|
Consensus |
73% |
Low-Risk, Good Risk-Management, Stable Trend |
(Sources: MSCI, Morningstar, FactSet, S&P, Just Capital, Reuters)
OKE’s Long-Term Risk Management Is The 149th Best In The Master List (70th Percentile)
|
Classification |
Average Consensus LT Risk-Management Industry Percentile |
Risk-Management Rating |
|
S&P Global (SPGI) #1 Risk Management In The Master List |
94 |
Exceptional |
|
Strong ESG Stocks |
78 |
Good – Bordering On Very Good |
|
Foreign Dividend Stocks |
75 |
Good |
|
ONEOK |
73 |
Good |
|
Ultra SWANs |
71 |
Good |
|
Low Volatility Stocks |
68 |
Above-Average |
|
Dividend Aristocrats |
67 |
Above-Average |
|
Dividend Kings |
63 |
Above-Average |
|
Master List average |
62 |
Above-Average |
|
Hyper-Growth stocks |
61 |
Above-Average |
|
Monthly Dividend Stocks |
60 |
Above-Average |
|
Dividend Champions |
57 |
Average |
(Source: DK Research Terminal)
OKE’s risk-management consensus is in the top 30% of the world’s highest quality companies and similar to that of such other blue-chips as
-
Enbridge (ENB) – dividend aristocrat
-
Clorox (CLX) – dividend aristocrat
-
Canadian National Railway (CNI) – dividend aristocrat
-
NextEra Energy (NEE) – dividend aristocrat
-
McCormick (MKC) – dividend aristocrat
-
Johnson & Johnson (JNJ) – dividend king
-
Federal Realty Investment Trust (FRT) – dividend king
-
Becton, Dickinson & Company (BDX) – dividend aristocrat
-
V.F. Corp. (VFC) – dividend king
-
T. Rowe Price (TROW) – dividend aristocrat
-
Home Depot (HD)
-
UnitedHealth Group (UNH)
-
Pembina Pipeline (PBA)
The bottom line is that all companies have risks, and OKE is good at managing theirs.
How We Monitor OKE’s Risk Profile
-
23 analysts
-
3 credit rating agencies
-
8 total risk rating agencies
-
31 experts who collectively know this business better than anyone other than management
-
and the bond market for real-time fundamental risk updates
“When the facts change, I change my mind. What do you do sir?” – John Maynard Keynes
There are no sacred cows at iREIT or Dividend Kings. Wherever the fundamentals lead we always follow. That’s the essence of disciplined financial science, the math behind retiring rich and staying rich in retirement.
Bottom Line: 6.6% Yielding ONEOK Can Help You Retire In Safety And Splendor
I can’t tell you when OKE will bottom, that’s likely to depend on a lot of macro and company-specific factors. For example, Citigroup thinks oil could fall 35% more in a recession to $65.
While this wouldn’t have a significant impact on OKE’s business, combined with a potential 25% decline in the stock market, I’d be shocked if OKE didn’t fall more if we get a mild recession in 2023.
However, Wall Street doesn’t run on certainty, but probabilities and stocks don’t stop falling because bad news stops coming but when the bad news is fully priced in.
Here’s what I can tell you with high confidence about OKE right now.
-
OKE is one of the world’s safest, most dependable, and highest quality companies on earth
-
top 18% of the world’s best companies
-
6.6% very safe yield
-
15.5% CAGR long-term total return potential
-
9% discount to fair value = potential reasonable buy
-
8.4X cash flow
-
almost 100% consensus return potential over the next five years, 19% CAGR, 25% more than the S&P 500
-
about 12% better risk-adjusted expected returns of the S&P 500 over the next five years but with 4X the safer yield
If you want to lock in, in our opinion, exceptional safe high-yield today, consider ONEOK.
If you want to enjoy potentially 15% to 16% long-term returns for years or even decades to come, consider ONEOK.
If you want to take charge of your financial destiny, make your own luck on Wall Street, and potentially retire in safety and splendor, consider ONEOK.
Be the first to comment