

da-kuk
The thought looking at the softening economic data is that the Fed and Jay Powell could be “behind the curve” again, initially with inflation on the way up in 2021 and now with the weakening economic data and the market-driven inflation signals, which seem to be plummeting.
Weakening Economic Data, Plummeting Market-Driven Inflation Signals (Bespoke)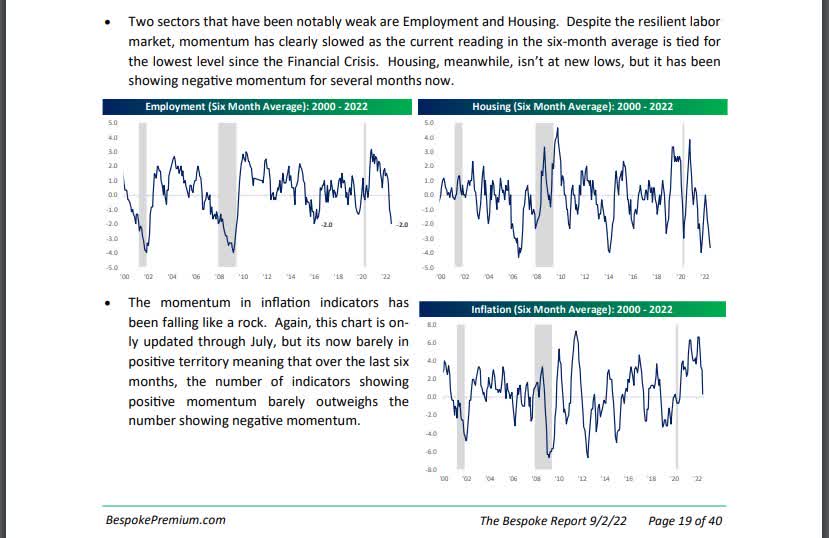
Bespoke published these graphs with the weekly Bespoke Report on Friday, September 2nd, after the market reversed its early gains and the S&P 500 wound up -3.3% on the week. The problem with all economic – with the possible exception of jobless claims – is that when it’s reported to investors by the various government agencies, it’s typically a month old.
Note that these graphs are “6-month averages,” and while it was obvious that market-based inflation indicators were falling sharply, the labor and housing data deterioration was a surprise. It’s the “rate of change” too that’s interesting, which these graphs pick up.
Having told clients many times that the Fed is always late because it’s not their job to guess or change monetary policy in anticipation of what they think will happen but to wait for the data, the short end of the Treasury curve will tell us – probably before Powell does – when monetary policy is on the verge of shifting to neutral or accommodation.
Here’s a look at the Treasury yield curve since mid-June ’22:
Treasury Yield Curve (Author)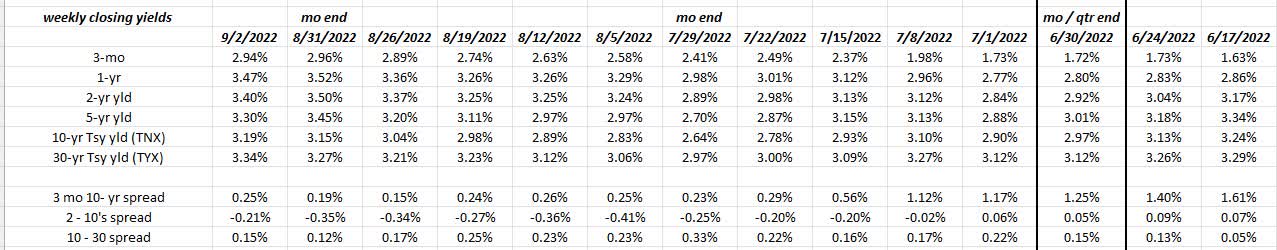
Enlarge this data (my own) and you’ll see that the 3-month – 10-year Treasury spread has never gone negative or inverted this year, while the “2’s – 10’s” has inverted. It depends on who you ask, but it’s the “3-month T Bill yield vs. the 10-year Treasury yield” that seems to be the more important of the two spreads, although I haven’t found a good reason why that is so, only that it seems to carry more importance than “2’s vs 10’s”. If the odds of a recession start to increase, the yield curve will likely flatten first and then steepen, and short rates will start to reflect a softening or relaxing of monetary policy.
We still seem to be a ways away from that happening.
Updating annual returns (after the brutal August ’22):
S&P 500 Average Annual Returns (Author)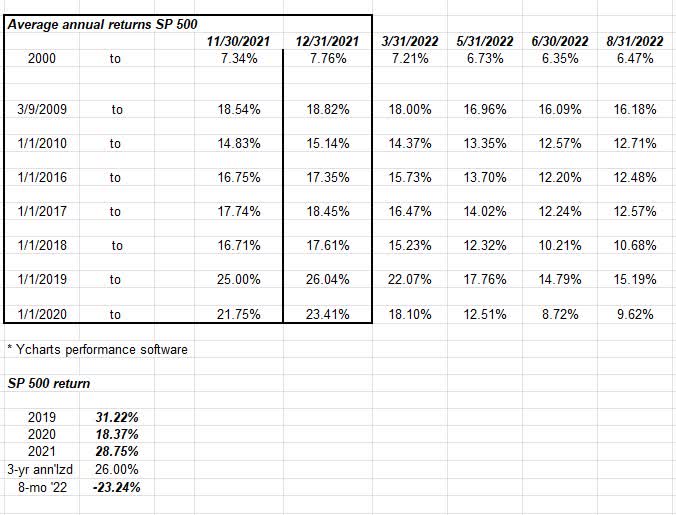
The original of this table was posted in mid-January ’22 here, so note what has happened to the shorter-term returns since the end of 2021.
Also note, underneath the annualized return table, the actual returns for the S&P 500 each year from 2019 to 2021, and then note what the YTD annualized return is for ’22.
Returns are correcting in the right direction, but it’s likely more pressure is needed.
Looking at annual returns as of 8/31/22, this data is still bearish in the sense that a weak September ’22 would continue to pull down those elevated numbers.
Thinking in terms of secular bull and bear markets, though, since the S&P 500 never made a new all-time-high from its March 2000 peak until early May 2013, from a time perspective this secular bull market is only just a little over 9 years old. From the absolute low in March 2009, it took another 4 years just to get back to breakeven from the March 2000 peak. The S&P 500 went 13 years – from March 2000 through May 2013, without making a new all-time high.
By the way, the average, annual return for the S&P 500 from 5/1/2013 through 8/31/2022 is 12.5%. (Source YCharts)
To be blunt about it, my own opinion is that Jeremy Grantham and Michael Burry and all the “uber-bears” are still too early. A 9-year bull market is still young. Granted, the returns were above average, but that’s being worked off. It would be perfectly logical (to me anyway) to see small and mid-cap asset classes perform well, while the “mega-cap” tranche of the S&P 500 goes nowhere. (This was covered in the style-box update in mid-August ’22.)
Inflation data
The CPI and PPI data for August are due out Tuesday, September 12th, and Wednesday, September 13th, correcting an earlier post when the reporting days looked to be Monday and Tuesday. (Thanks to a reader who caught the error.) Readers have 5 more days of trading to await the next CPI data point, which is painful enough, after last Friday, September 2nd’s stock market reversal. The blame for the reversal was thought to be laid at the feet of the Gazprom (OTCPK:OGZPY) headline, which stated that the critical Nord Stream 1 natural gas pipeline would remain closed thanks to an oil leak, and if you believe that statement, I’ve got a Chicago bridge to sell you.
Economic Data – Week Of September 12-16, 2022 (Briefing.com)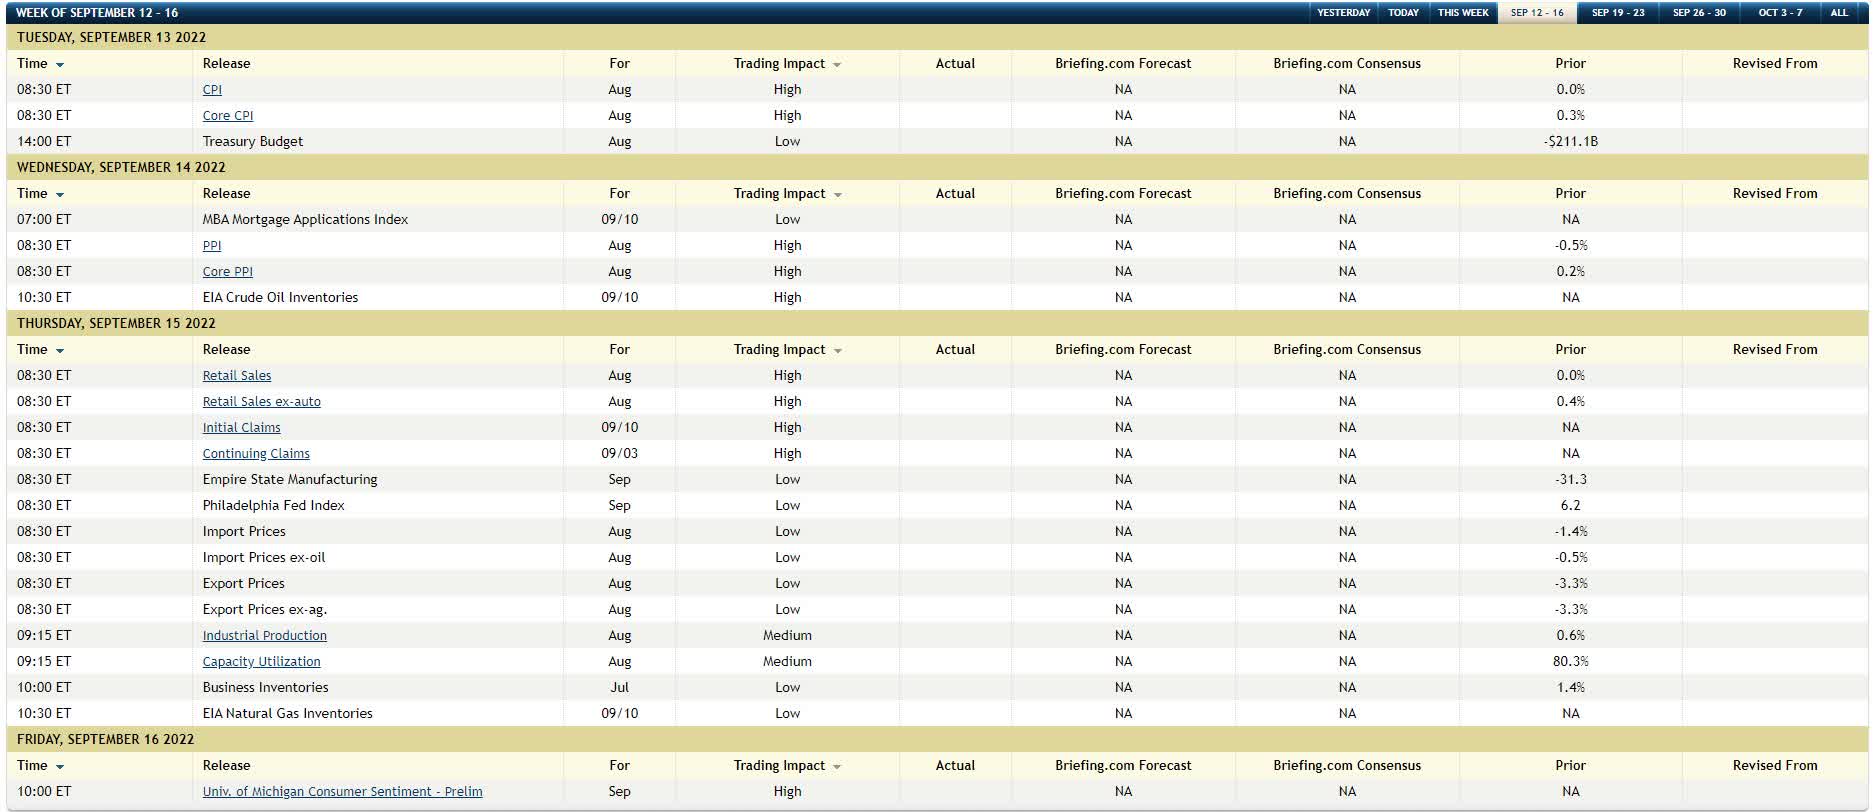
There isn’t much in the way of important economic data coming out this week – September 6th through 9th – but the Briefing.com table shows the detail on what’s expected next week.
Summary / conclusion
It’s expected to be a quiet week for both economic data and earnings. Kroger (KR), a Warren Buffett holding, and DocuSign (DOCU), the software darling from 2020 and 2021 that traded up from $50 in mid-2019 to $300 by late 2021, only to come back down to earth beginning in late ’21, both report this week. Neither stock has ever been bought for clients. DOCU’s drop from $300 down to $55 has left it with a more reasonable valuation for the growth stock, but it’s not the kind of name that’s going to be rewarded even with good results and guidance as long as Jay Powell has his boot on the neck of the market.
Given the Bespoke data, which was surprising (very first table above), the narrative could begin to shift to an economy slowing faster than was originally believed even as recently as two weeks ago.
Liz Truss’s ascension to the British Prime Minister’s position this weekend is interesting. The narrative around the UK and Europe is as negative as I’ve ever seen it. Some think the pound could break the buck. International (non-US) and emerging markets have been completely out of favor as investments since pre-2008.
Take everything you read here as one person’s opinion and with substantial skepticism. It could all change tomorrow.
Thanks for reading.
Editor’s Note: The summary bullets for this article were chosen by Seeking Alpha editors.
Be the first to comment