


ismagilov/iStock via Getty Images
Investment Summary
From the Portfolio Manager’s Desk
Constructing equity-focused and cross-asset portfolios has become increasingly difficult in FY22. Therefore, in order to examine Omnicell, Inc.‘s (NASDAQ:OMCL) suitability into an equity-focused, long-only portfolio, we first have to understand what themes are positioned to outperform looking ahead.
OMCL 6-month price action

Data: Updata
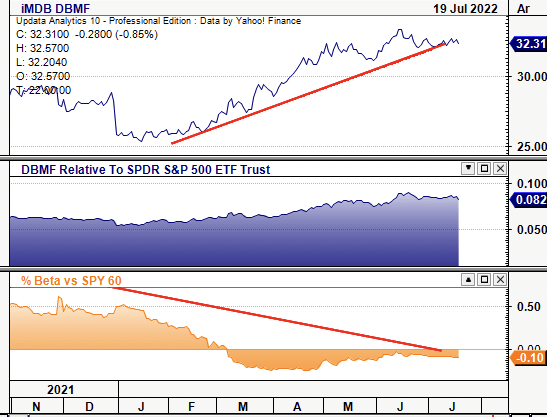
Equity strategies have been hammered this year, especially those held to long-only mandates. Moreover, the high beta trade that fuelled FY20–21’s parabolic growth in US equities has shown a complete reversal, leading to strengths in alternative premia, as seen in Exhibit 1. Alas, retail liquidity has dried up across the market and growth has de-rated to the downside.
As a result of this structural rotation, low-beta, high-quality strategies have agreed with investors this year. This trend looks set to continue. The valuation spread these factors have traditionally enjoyed is present again, as investors have priced in more systematic risks over idiosyncratic risk. This creates a strong case for cash-compounding names to re-rate to the upside. Moreover, as retail liquidity has been swept up in many corners of the market, there is now plenty of safety margin left for allocators to work with, especially in defensible sectors such as medical technology (“medtech”).
Exhibit 1. Alternative premia has lent investors uncorrelated alpha in both tactical and strategic positioning
Trend looks set to continue as investors look to step up in quality and increasingly position to hedge recession
Data: Updata
Alas, we advocate investors to step up in quality and resiliency in portfolio construction from H2 FY22. Noteworthy is that balanced portfolios – especially those with meaningful exposure to alternatives – have obtained strategic and tactical real risk-adjusted alpha, and are primed to continue doing so. Seeking alternatives-like exposure and reducing beta is integral to reducing equity risk and preventing further equity drawdown, we estimate.
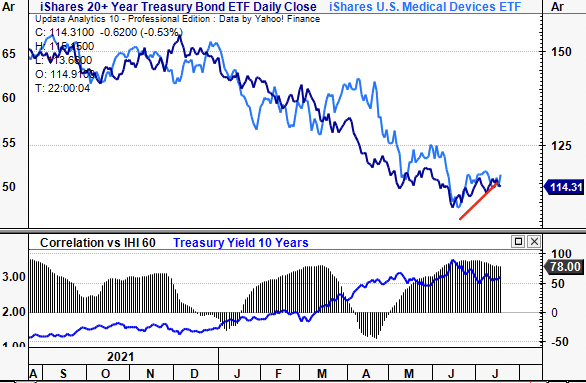
What’s supporting this view? Firstly, investors are adding duration back into portfolios. The long-end of the UST curve has caught a bid in June/July as investors increasingly price in prospects of short-term recession. This is good for US medtech equities, we estimate. We’ve seen evidence of this in H2 already, as seen in Exhibit 2. Only the most resilient business models will survive a slowdown in GDP. In this vein, investors are turning to bottom-line fundamentals over top-line growth.
Exhibit 2. Investors are adding duration back to portfolios to compensate for short-term slowdown
Covariance of US medtech suggests the long-term outlook for the sector is optimistic
Data: Updata
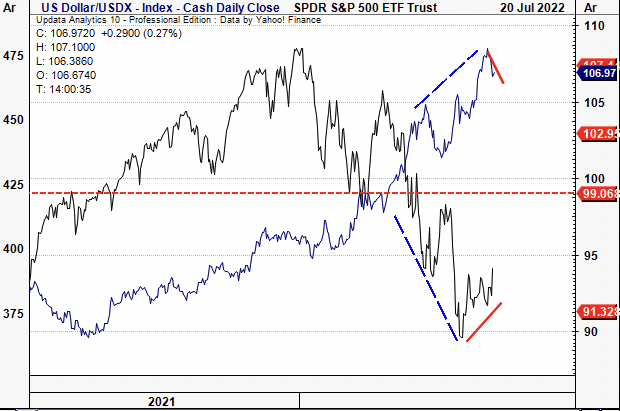
Moreover, the macro-divergence in the DXY/SPX relationship has shown signs of narrowing, as seen in Exhibit 3. If recent correlations hold, then we could see further recovery in equities amid a potential shift in risk appetite. This would serve as a solid bedrock for quality factors to shine through in our estimation. Therefore, we are on the hunt for characteristics of quality – profitability, return on capital, market data, earnings momentum, FCF, market support, just to name a few.
Exhibit 3. Reversal of macro-divergence at DXY/SPX level
This could signal shift in risk budgeting towards equities if recent correlations hold
Data: Updata
Hence, in order to gauge OMCL’s inclusion, we’ve taken a hard data approach and put it through a series of litmus tests. We have to examine its affinity to market, fundamental, valuation, technical and portfolio statistical factors to make the most informed investment reasoning possible. Here we demonstrate OMCL fails to justify its inclusion in the culmination of these factors. Rate neutral PT $121.
Market factors
Long duration equities have sold off en masse in FY22 amid a wind down in the growth trade. With that, investors have positioned away from exposure to equity beta. This mirrors the alternative premia we spoke of earlier. We are seeking to replicate alternatives like weighting across all portfolios and believe investors will continue paying a premium for these characteristics beyond H2 FY22.
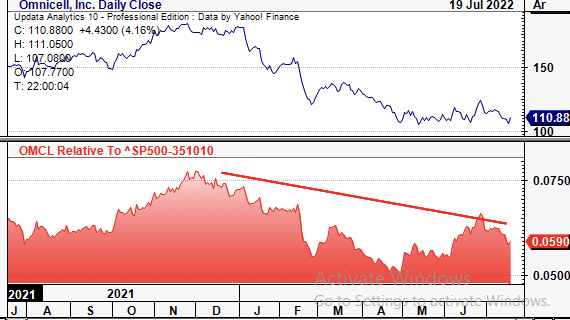
OMCL is largely agnostic to these characteristics. The stock has pushed lower since January–date along with a simultaneous jump in equity beta, as seen in Exhibit 4. This, whilst weakening in price performance relative to the benchmark up until this day. Meanwhile, its covariance structure has shifted upwards since January and continues to rise. These findings illustrate a lower probability of upside potential looking ahead.
Exhibit 4. Upshifting covariance structure along with weakening price performance relative to the benchmark
Factors that investors are pushing away from in FY22

Data: Updata
The stock has also lost performance against the medical devices and health care equipment sector since rolling into FY22. We’re seeking names that are outsizing peers in the sector, in order to separate away to the upside. For portfolio inclusion, OMCL would ideally be strengthening against the sector, and hence fails this litmus test.
Exhibit 5. OMCL is weakening against the medical devices and health care equipment sector as well
Data: Updata
Idiosyncratic Factors
Sales and gross profit have been lumpy over the past 7 years whereas operating profit has remained thin. Free cash conversion has also been light in this time. OMCL is now trading on a 1.5% T12M FCF yield (down from recent averages of ~2.5–3%) and printed a loss of $43 million in FCF last quarter. It has averaged 7.9% quarterly FCF margin since FY15–date, whilst FCF has grown ~10% geometrically in the past 5 years. Operating income declined 44% sequentially and were down 57% YoY to ~$12 million off a base of $28 million in March 2021.
Exhibit 6. Operating income and FCF have been lumpy from FY15–date as investors realize a 1.5% T12M FCF yield
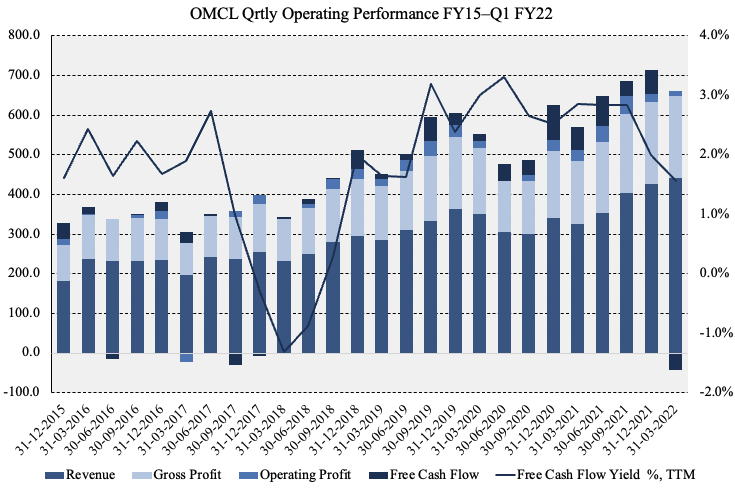
Data: HB Insights, Refinitiv
Meanwhile, earnings have narrowed ~28% YoY to $0.24 and have come down more than 52% from Q4 FY19. After listing 21 years ago, OMCL is yet to deliver a steady stream of quarterly earnings at $1 per share. We’ve baked in $1.4 billion and $1.5 at the top in FY22 and FY23, respectively, to carry through to a 48.7% gross and 9.6% operating margin this year, potentially driving $3.91 in FY22 EPS. OMCL pays no dividends for additional upside capture/downside cover either.
ROIC and ROA have curled over in FY21 and are off pre-pandemic highs, as seen in Exhibit 7. This does help the earnings outlook for OMCL by estimation. However, normalized ROIC is below the WACC of 9.5% and is reasonably stable for medtech at 5.5% per annum. However, this return has not been fed below the bottom line and its asset base generated $0.72 for every $1 capital invested in Q1. As a result of these drivers, available liquidity has drifted lower. Short-term liabilities are now covered less than 2x from liquid assets. Moreover, trends look set to continue. We estimate FCF to decrease 42% YoY in FY22 to $99 million, spiking 53% YoY into FY23.
Exhibit 7. Return on capital fails to meet the WACC hurdle at 9.5% whilst liquidity looks drained

Data: HB Insights, Refinitiv
Valuation factors
Investors are paying ~68x forward P/E for access to the low-quality characteristics described above. Shares are also trading at 4.2x book value and are priced at 56x T12M FCF. As seen in the table below, OMCL is trading at a premium to peers across key multiples. The question is if this premium is warranted. Our answer is no, it’s not warranted, as there’re numerous long-term cash compounders within the GICS industry group of peers that look to offer more respectable upside potential.
Exhibit 8. Multiples & Comps
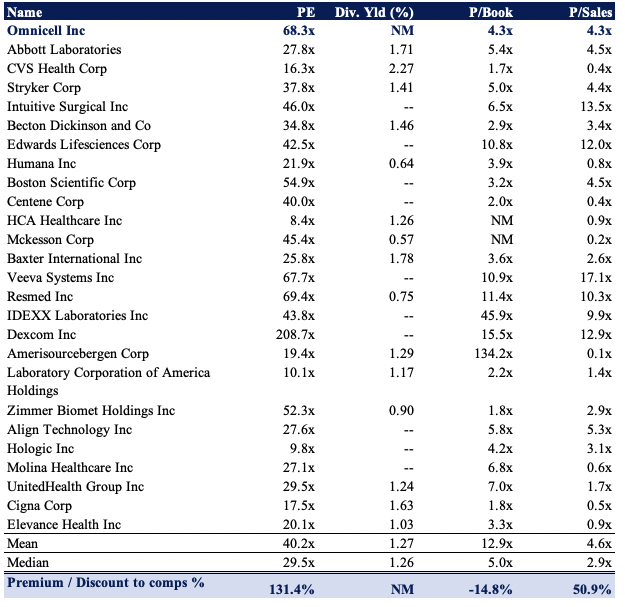
Data: HB Insights
Point and figure charting also points to heavy downside with multiple downside targets clustered around the $94 level. Shares are trading beneath deep resistance and there have been several downthrusts in price action leading us to the current OMCL share price. This chart looks bearish to us and validation of 4x previous downside targets adds further validity to the $94 objective set below.
Exhibit 9. Multiple downside targets
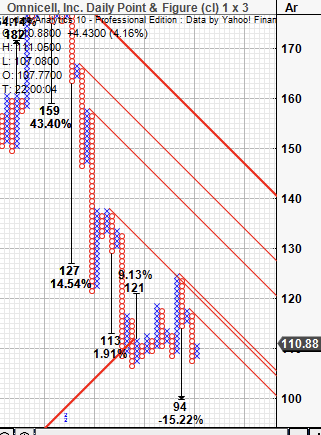
Data: Updata
At 5-year normalized P/E of 38x this sets a price target of $148. Combining this with the $94 derived above gives us a price objective of $121, or ~9% return potential.
Portfolio Statistical testing
As mentioned, balanced portfolios with an alternatives weighting have outperformed in FY22. As seen in Exhibit 10, backtesting from 2 Jan–20 July corroborates the same with an equal-weight allocation to alternatives and other asset classes. The strategy has delivered total return of 0.6% versus the benchmark’s 20% loss this YTD (18.4% alpha). Drawdown has been contained to just -3%, whereas standard deviation of portfolio returns is tight at ~6%. Out of the 3 tests performed, it’s unsurprising to see the low beta (0.85) balanced portfolio outperform, based on findings from this report.
Exhibit 10. Portfolio simulation and statistical testing
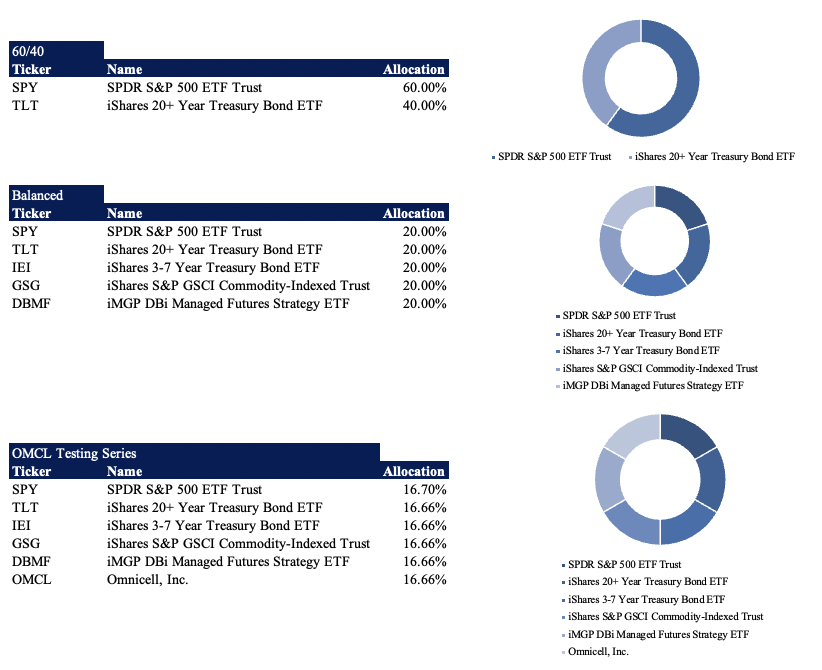
Data: HB Insights

Data: HB Insights
Testing OMCL on this backward-looking basis demonstrates its inclusion only adds to equity risk without lending superior return. At an equal weight (shown above) standard deviation is more than 7%, whereas drawdown doubles to more than 6% and return is -6%. Similar trends are observed in OMCL all the way down to a 1% weighting, whereby changes are negligible. This tells us that adding OMCL to an equity focused, long-only portfolio is likely to increase equity risk without the additional upside capture to compensate for this.
In short
Based on the culmination of factors discussed in this report, OMCL fails to justify its inclusion into a long-only, equity-focused portfolio. Our macro strategy now seeks to identify long-term cash compounders that are growing earnings and FCF at above-average and above-industry rates. On this note, OMCL fails the litmus test.
It also displays a loose affinity to the current premia driving equity returns, with its covariance structure shifting upwards and performance weakening relative to benchmarks. We’ve priced OMCL at $121, leading to a small amount of upside, but certainly not bearish on valuation. Moreover, statistical testing on portfolio weighting demonstrates OMCL only adds to equity risk without any additional upside capture vs. a balanced setup. With these factors, we rate it neutral, and encourage investors to search elsewhere for now.
Be the first to comment