

Michael M. Santiago/Getty Images News
Sophisticated factor-based high-turnover active or quasi-active equity strategies have one essential problem – they underperform the U.S. market en masse. Yet there are remarkable exceptions, like the somewhat underfollowed Invesco Russell 1000 Dynamic Multifactor ETF (BATS:OMFL), an outperformer we will be discussing today.
I briefly touched upon this ETF in my April 2022 note on the BlackRock U.S. Equity Factor Rotation ETF (DYNF) titled “DYNF: Returns Illustrate Limitations Of Active Factor-Based Strategies.” It seems OMFL skillfully defies these limitations, timely rotating out of laggards and boosting exposure to winners, even despite being managed passively, in contrast to DYNF.
Let me corroborate with the following table comparing the performance of the market represented by the iShares Core S&P 500 ETF (IVV), iShares Russell 1000 ETF (IWB), Goldman Sachs ActiveBeta U.S. Large Cap ETF (GSLC), which I covered in December, Xtrackers Russell US Multifactor ETF (DEUS), and WisdomTree U.S. Multifactor (USMF) during the December 2017 – December 2022 period.
| Portfolio | IVV | OMFL | GSLC | DEUS | USMF | IWB |
| Initial Balance | $10,000 | $10,000 | $10,000 | $10,000 | $10,000 | $10,000 |
| Final Balance | $15,834 | $18,072 | $15,556 | $14,284 | $15,090 | $15,559 |
| CAGR | 9.46% | 12.35% | 9.08% | 7.27% | 8.43% | 9.09% |
| Stdev | 18.49% | 19.35% | 18.20% | 19.40% | 17.65% | 18.78% |
| Best Year | 31.25% | 35.58% | 30.75% | 28.80% | 23.52% | 31.06% |
| Worst Year | -18.16% | -13.97% | -18.72% | -11.19% | -8.83% | -19.19% |
| Max. Drawdown | -23.93% | -22.11% | -24.52% | -27.31% | -22.89% | -24.57% |
| Sharpe Ratio | 0.51 | 0.63 | 0.5 | 0.39 | 0.48 | 0.49 |
| Sortino Ratio | 0.76 | 1.04 | 0.74 | 0.56 | 0.69 | 0.72 |
| Market Correlation | 1 | 0.92 | 1 | 0.97 | 0.96 | 1 |
Created using data from Portfolio Visualizer
OMFL’s results are outstanding. First, its compound annual growth rate is almost 3% higher compared to IVV, well above IWB’s, also dwarfing its peers. Second, it delivered the strongest return in its best year (2019). Third, the Sharpe and Sortino ratios are the highest (hence, it boasts the best risk-adjusted returns). The standard deviation being amongst the largest in this group is a minor disappointment.
Another table provides a bit more context by adding DYNF; the period analyzed was narrowed to April 2019 – December 2022 as this BlackRock ETF was incepted in March 2019. A similar picture can be observed.
| Portfolio | IVV | OMFL | GSLC | DEUS | DYNF | IWB |
| Initial Balance | $10,000 | $10,000 | $10,000 | $10,000 | $10,000 | $10,000 |
| Final Balance | $14,422 | $15,834 | $14,119 | $13,722 | $12,924 | $14,188 |
| CAGR | 10.26% | 13.04% | 9.64% | 8.80% | 7.08% | 9.78% |
| Stdev | 19.72% | 21.07% | 19.34% | 20.81% | 19.29% | 20.05% |
| Best Year | 28.76% | 28.96% | 27.16% | 25.56% | 25.06% | 26.32% |
| Worst Year | -18.16% | -13.97% | -18.72% | -11.19% | -20.27% | -19.19% |
| Max. Drawdown | -23.93% | -22.11% | -24.52% | -27.31% | -25.91% | -24.57% |
| Sharpe Ratio | 0.54 | 0.64 | 0.52 | 0.46 | 0.4 | 0.51 |
| Sortino Ratio | 0.82 | 1.09 | 0.78 | 0.67 | 0.58 | 0.77 |
| Market Correlation | 1 | 0.92 | 1 | 0.97 | 0.99 | 1 |
Created using data from Portfolio Visualizer
The next table illustrates that OMFL beat IVV every single year since its inception, including one month in 2017. It successfully navigated the challenging market environment when the trade war narrative was reigning, then outperformed tech- and growth-heavy S&P 500 ETF during the pandemic rally; when the coronavirus rally lost steam, it found a way to profit from the capital rotation to smaller, cheaper cyclical players in 2021, and then shrugged off the doom and gloom of the 2022 bear market once again adapting to a new environment dominated by the inflation and higher interest rate narrative. In short, this is an impeccable track record.
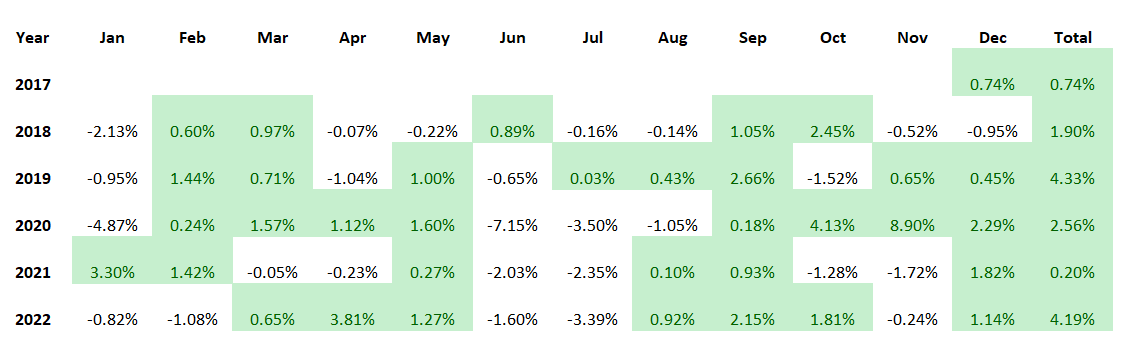
Created using data from Portfolio Visualizer
What principles lie at the crux of OMFL’s strategy?
OMFL is managed passively, with the Russell 1000 Invesco Dynamic Multifactor Index being the cornerstone of its high-turnover strategy, one I would like to call a quasi-active as the index is reconstituted and rebalanced monthly.
The index encompasses the Russell 1000 constituents selected using the size, value, momentum, quality, and low volatility factors. To decide what styles should dominate the portfolio, the provider looks at a mix of indicators to assess “the economic cycles and market conditions” to arrive at a conclusion about whether they are pointing to an “expansion, slowdown, contraction or recovery.”
What factors does OMFL favor at this point?
In my view, factors OMFL currently places its bets on are mostly smaller size and value, and, to some extent, quality, yet some natural profitability (thankfully modest) issues inherent to mid- and small-caps still could be uncovered upon deeper analysis. With a weighted-average 24-month beta of the portfolio being ~1.04 as per my calculations, I would not say it favors less-volatile stocks. And this is a blend I find appealing.
Implicitly, as apparently comes from this mix, at least for now OMFL does not bet on interest rates dropping soon or the economy grossly surprising to the upside, as it would not favor cheaper and smaller stocks in that case.
Looking under the hood, I found out that the weighted-average market cap is about $10.3 billion, with the reason for that being about 58% of the net assets allocated to the mid and small caps. Amongst 379 total holdings, mega caps are completely absent, with the most generously valued company in the basket as of January 23 being Interactive Brokers Group (IBKR), with a market cap of around $33.6 billion.
Likely anticipating the tailwinds from rising interest rates to contribute to investors’ optimistic view of the sector, OMFL is overweight financials (20.7%). With almost 18% allocated to industrials, it seems it is not preparing for an outright recession. Defensive sectors like utilities and consumer staples are meaningfully underrepresented (7.4% in total), again hinting a profound economic downturn is not the fund’s base case right now.
Speaking of value exposure, OMFL has an approximately 8.6% weighted-average earnings yield (vs. the S&P 500’s yield of less than 5%) coupled with a 1.5x Price/Sales ratio, as per my calculations, which clearly indicates that the portfolio is attractively priced. At the same time, the share of stocks with a B- Quant Valuation grade and better is over 33%, a solid level. Anyway, around 36% are priced at a premium to their respective sectors (D+ grade and lower), which still poses risks.
Meanwhile, quality is comparatively strong, with a few nuances inherent to the mid- and small-size echelon. First, almost 78% of the stocks have a B- Profitability grade and better, which is a substantial level, though still below results typical for portfolios heavy in mega-caps (over 90%). Second, there are trace amounts of low-quality stocks (D+ grade and lower), only 4.3%. Third, only about 6% are unprofitable.
The table below provides essential performance, valuation, growth, and quality data for the key ten holdings of the fund.
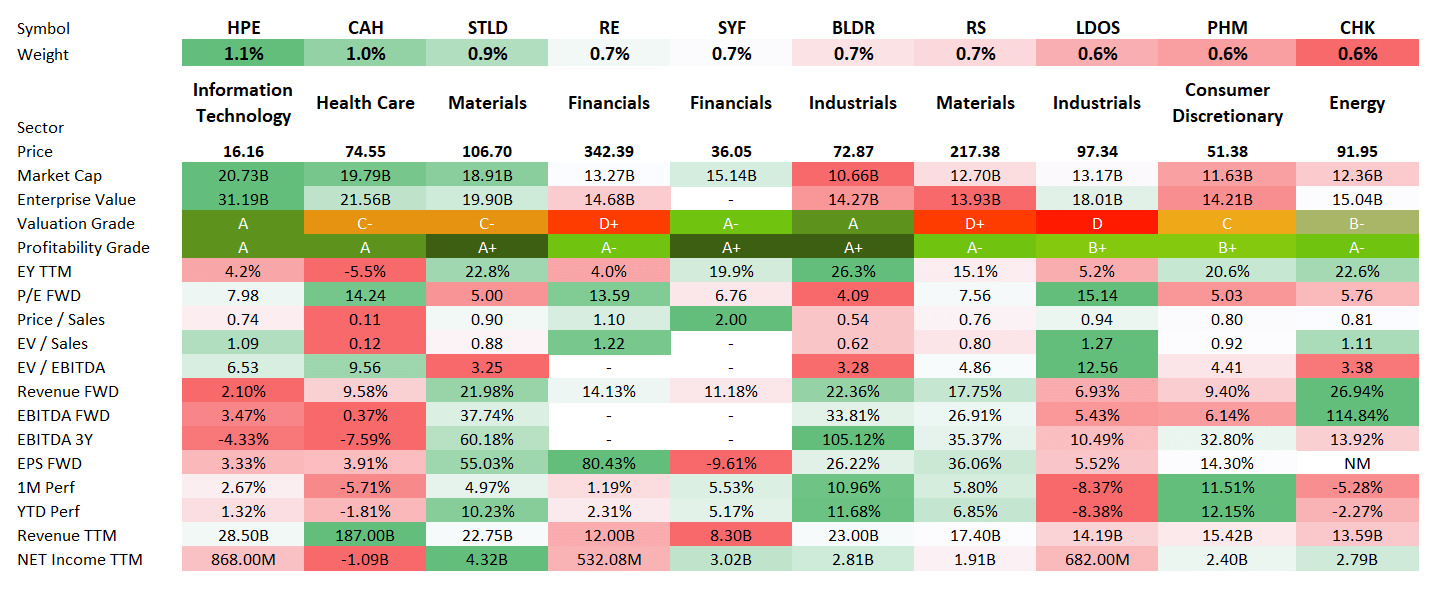
Created by the author using data from Seeking Alpha and the fund
Conclusion
There is no denying that factor-rotation active and quasi-active strategies attempting to time the market are clearly prone to underperformance owing to their natural limitations. For instance, they may be exploiting dislocations that were supportive of alpha in the past but then were rendered defunct in the ever-changing market, etc. Also, they might bet on a recession in the offing, then growth takes off; they might bet on a rampant economic expansion, then the one-off event knocks it off course, etc.
However, it seems OMFL’s strategy stands out here. Owing to the combination of convincing past performance, favorable factor exposure of the current version of the portfolio, as well as competitive expenses of 29 bps, and robust liquidity, I assign a Buy rating to the Invesco Russell 1000 Dynamic Multifactor ETF.
Be the first to comment