


Wirestock/iStock Editorial via Getty Images
Investment Thesis
From the peak of the 2021-2022 market sell-off, Olo Inc. (NYSE:OLO) lost about 85% of its market capitalisation, experiencing significant multiple contraction along the way. I believe that Olo has robust competitive advantages such as high switching costs and strong network effects, which the company is leveraging in order to capture market share and expand its customer cohorts.
Moreover, I expect the company to grow its revenue base at 20-25% CAGR over the next 5-years because of the vast untapped market with only 15% of restaurant orders being digital. Over the first half of 2023, I expect Olo’s share price to trend significantly down as the market bubble unwinds, but nevertheless if the management team continues to execute as they have done in the past years, I believe that at this point there is a robust margin of safety and an attractive potential return over the next 5 years.
Olo Business Model
Olo is a software as a service [SaaS] company that offers an open platform for restaurant technology solutions. The company generates revenue through a hybrid model, which includes subscription and transaction-based fees. The subscription model includes a fixed monthly fee per restaurant location for access to the Ordering module, as well as a fixed monthly fee for a certain number of orders, with additional fees for excess orders.
The transaction-based model includes fees for the Rails and Dispatch modules, as well as fees for aggregators, channel partners, and other service providers for access to these modules. Olo also generates transactional revenue from other products, such as Network, which allows brands to take orders from non-marketplace digital channels.
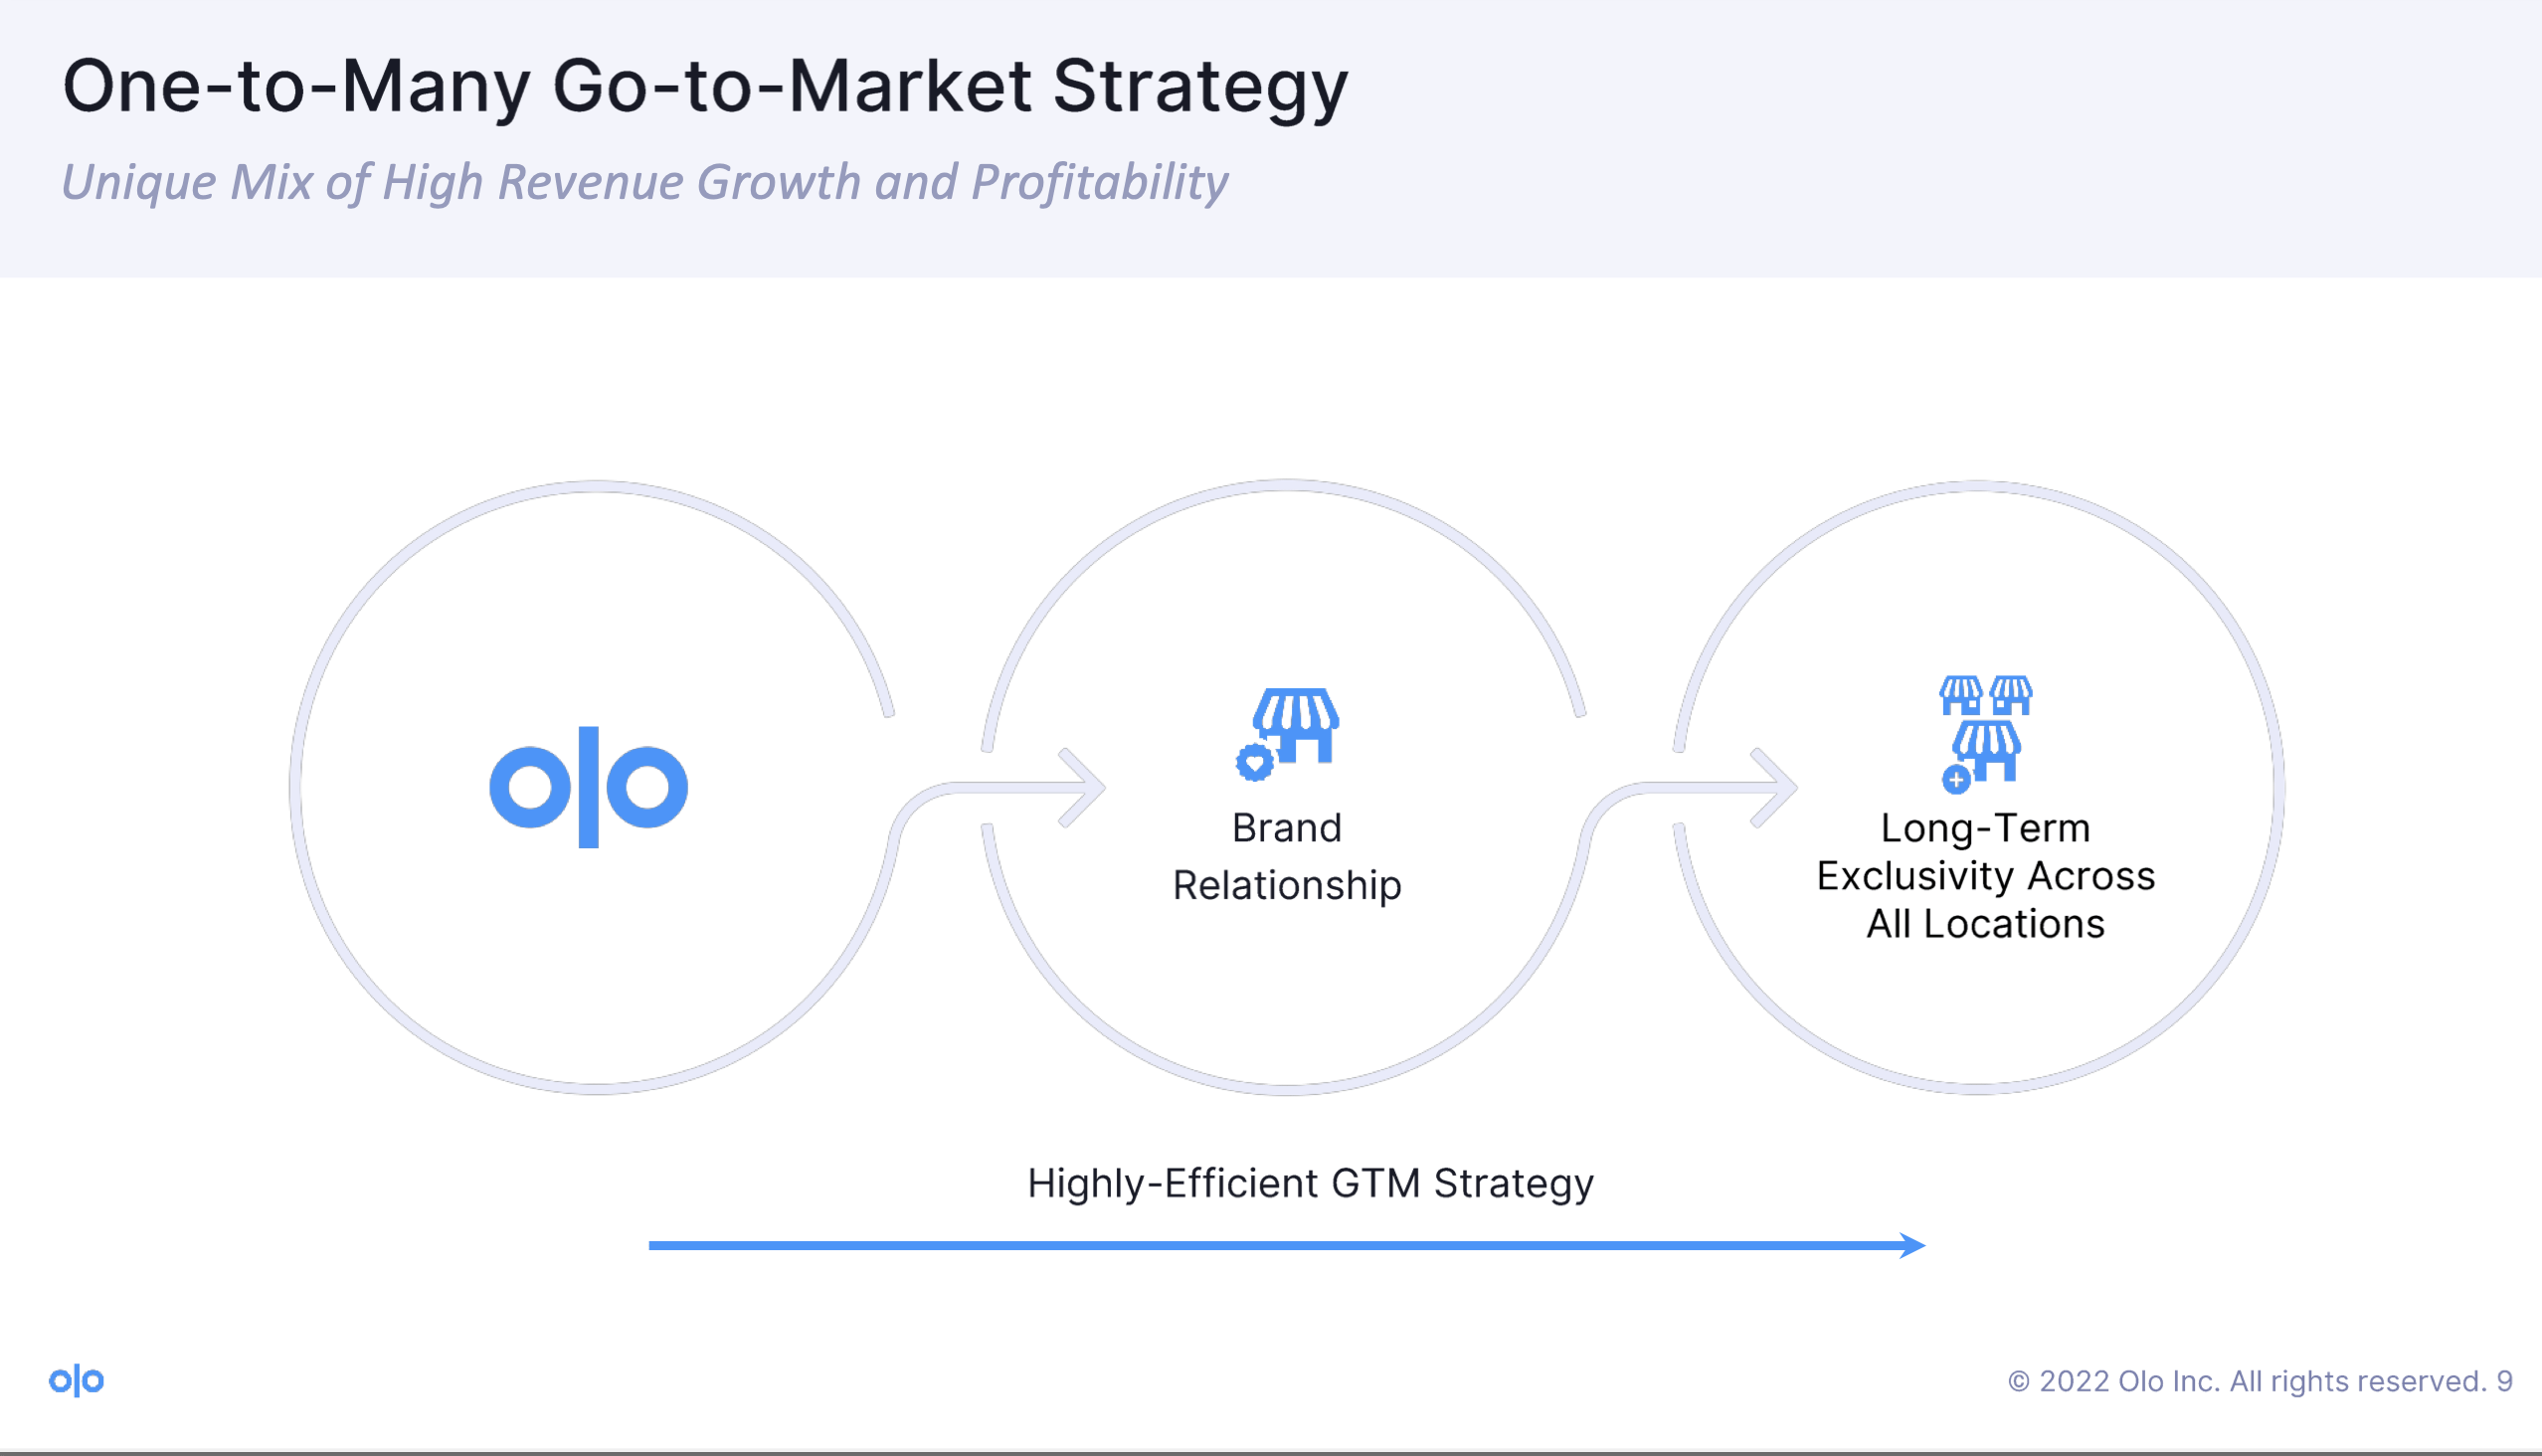
Olo’s approach to onboarding new brands has been extremely effective in quickly and efficiently integrating its software into the enterprise marketplace. Olo’s clients usually sign 3-year contracts alongside the possibility to renew for another year. The company signs exclusive agreements with enterprise chains, which enables Olo to have a consistent, long-term relationship with a single client, rather than having to continually onboard new individual locations. This can help to provide a constant and growing stream of revenue for the company. Additionally, having a presence across an entire enterprise chain ecosystem can increase the visibility and adoption of Olo’s software, as it will be available at all locations within that chain.
| Revenue breakdown | Transaction-based Revenue | Subscription-based Revenue |
| 2019 | 72.4% | 27.6% |
| 2020 | 48.2% | 51.8% |
| 2021 | 46.4% | 53.6% |
| Q1 2022 | 49.8% | 50.2% |
| 1H 2022 | 49.1% | 50.9% |
| Q3 2022 | 48.4% | 51.6% |
Olo Products
Olo Inc.
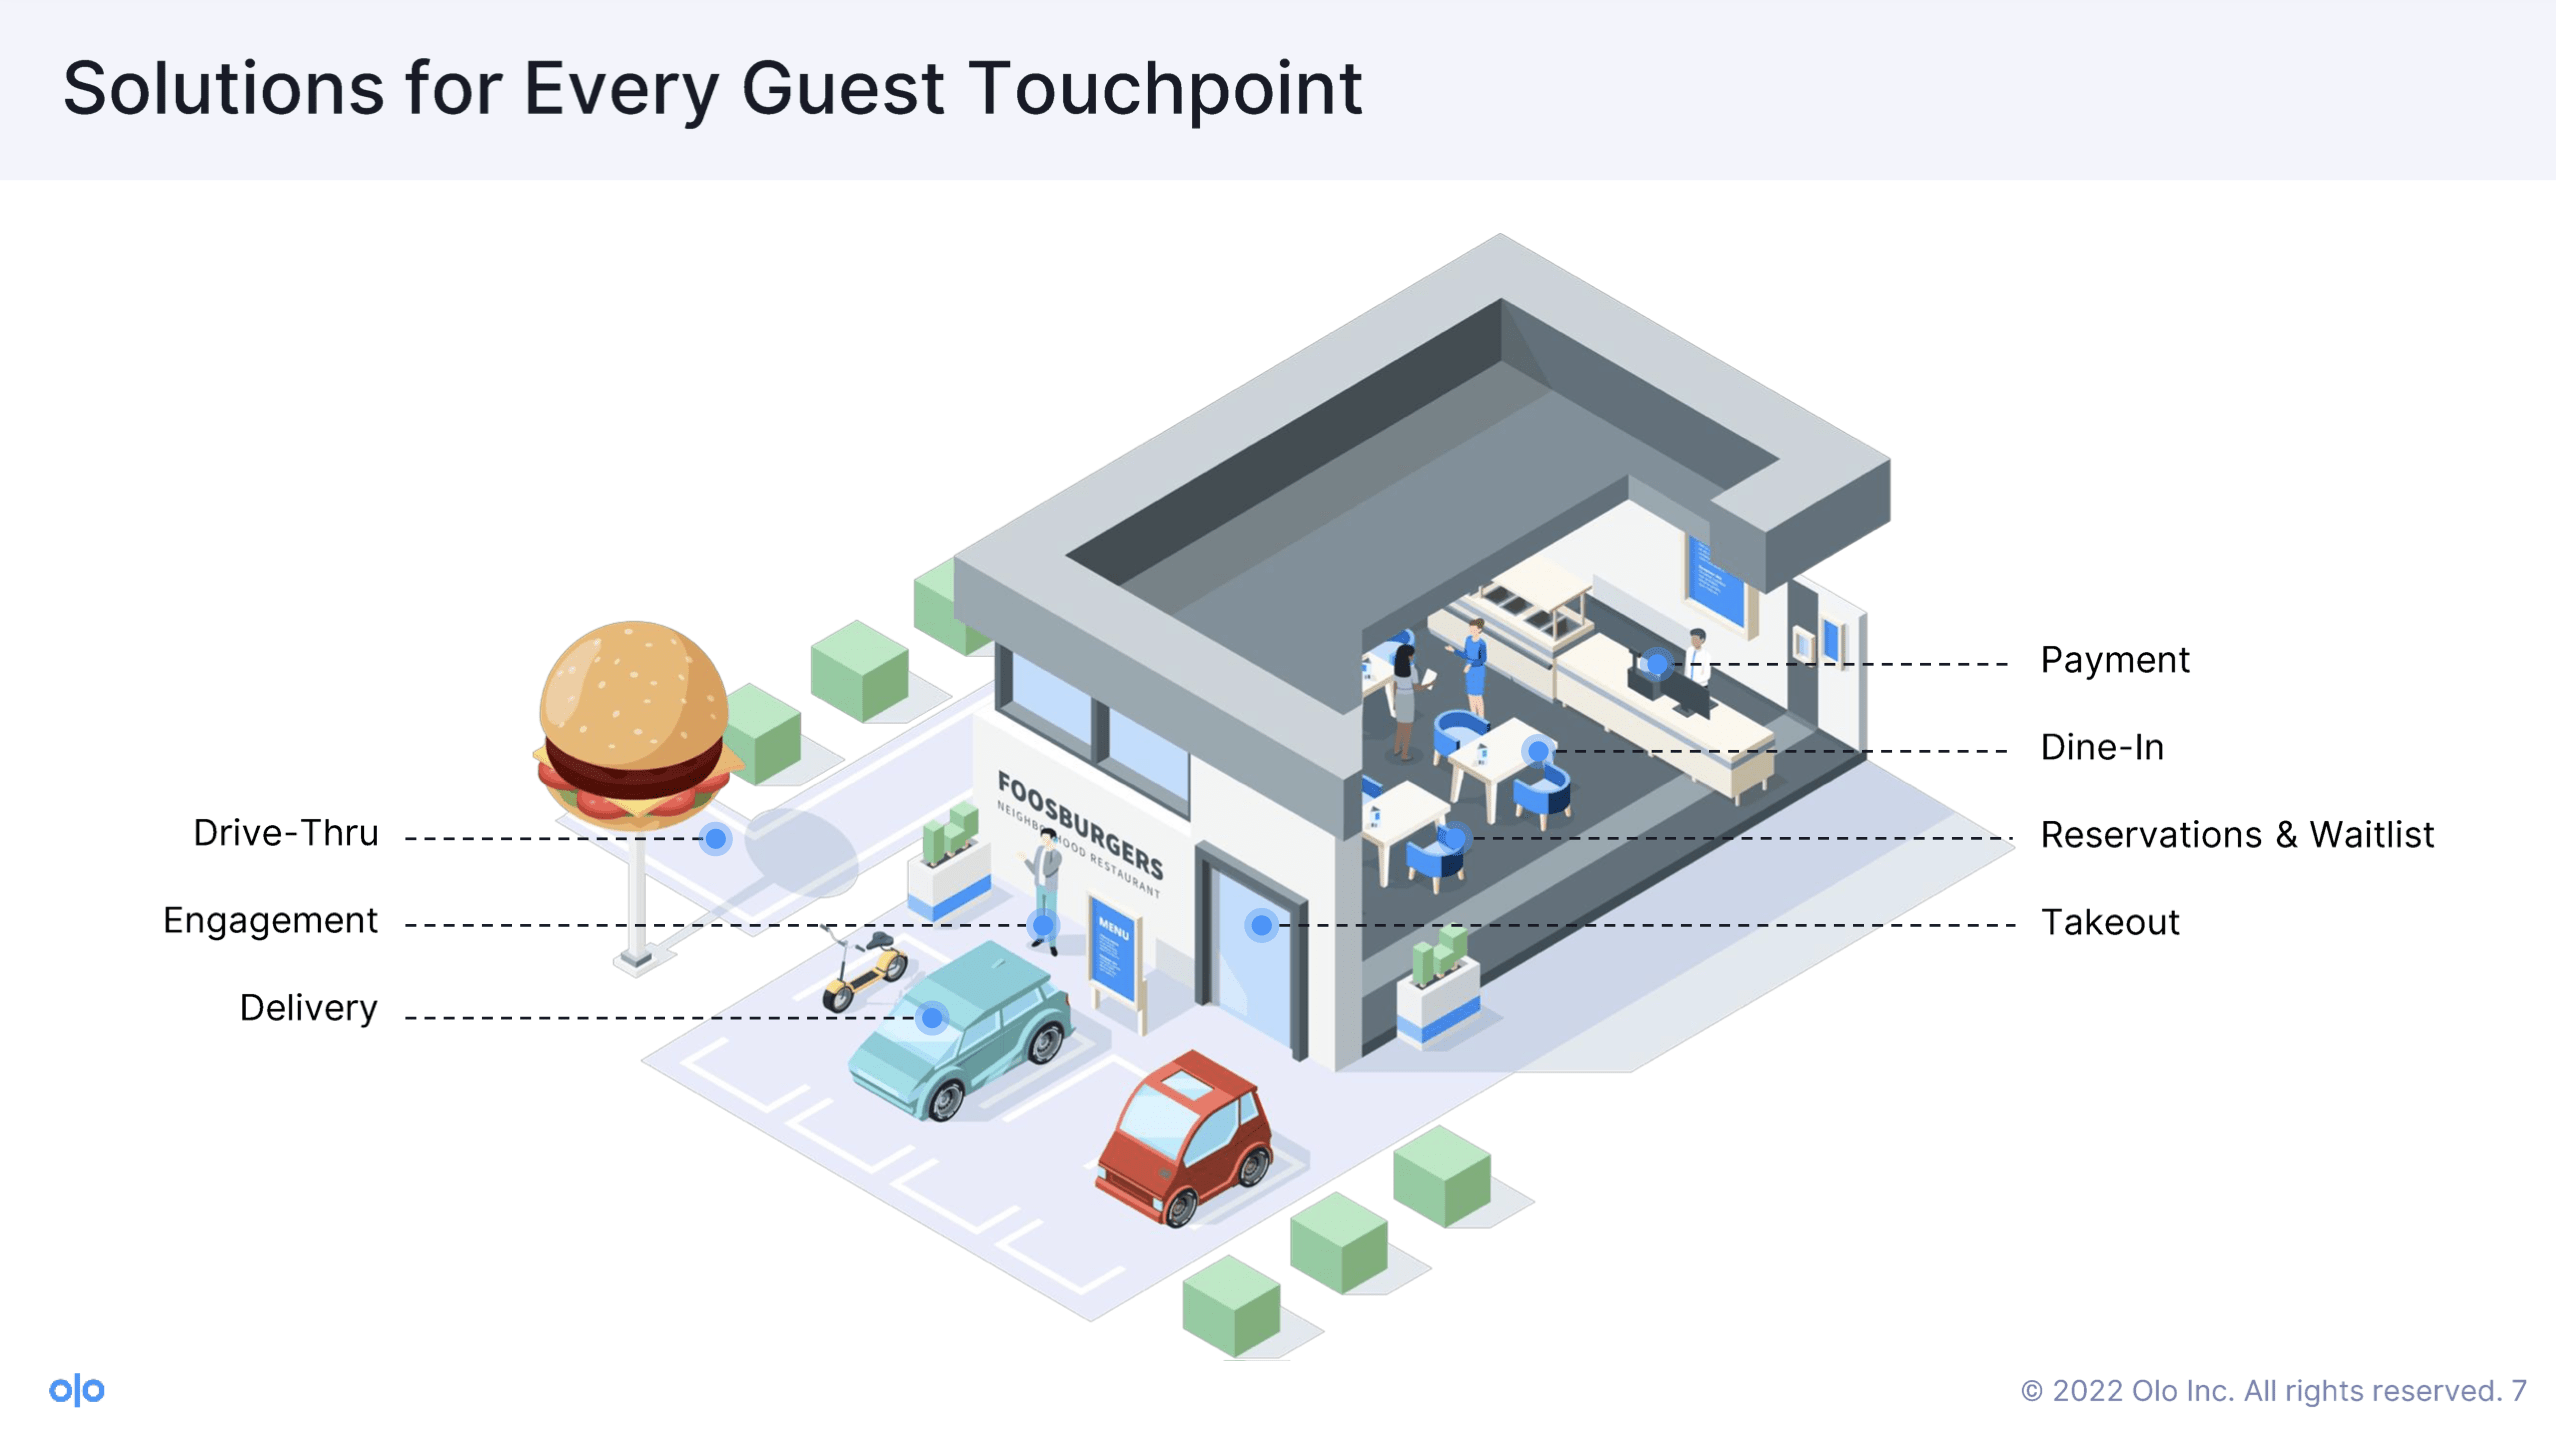
Ordering
Olo Ordering is a white-label Application Programming Interface [API] that enables and manage the influx of orders coming from every digital channel such as mobile, web, social and messaging, in-car, voice, personal assistants, kiosk, and staff use. Then, the mentioned digital channels are connected with the restaurant POS and inventory management system so that order volumes can be enhanced with more streamlined and seamless operations. Also, the Ordering module allows restaurants to keep updated and to manage their menus with regards to ingredients availability, to adjust prices on a per location basis, stock items availability and etc.
As it was mentioned, Olo offers a white-label platform allowing its customers to personalize the interface and to highlight their brands without showing an Olo logo. This enables Olo’s customers to boost their brand value and as a result their clients are more attracted by restaurant chain offerings.
Delivery
Olo’s delivery module is called Dispatch and it basically connects restaurants with a nationwide fulfillment network of delivery providers (sometimes up to 8 different DSPs in a single region) on a single and centralized platform which according to Olo covers 99.9% of the company’s customer locations along with 97.7% of restaurant locations being covered by at least 2 or more DSPs. Therefore, Olo’s customers enjoy flexibility and have the freedom to evaluate and choose the best DSP on a range of several criteria such as: time, cost and, quality of service. In this way, restaurants can set their own terms and are at all effects commoditizing DSPs which can now compete only on a price level as they are losing control of the customer relationship.
Rails
This module is offered to aggregators or marketplace like Door Dash and Grub Hub which can access to more than 600 brands and 82,000 restaurant locations. This module allows marketplaces to integrate restaurant menus, prices, item availability with their system on a brand or on a per location basis. When an order is submitted through a marketplace, this is sent to the Olo’s ordering platform which connects that same order to the restaurant POS and KDS (Kitchen Display System). Another benefit that this module provides to brands is that it eliminates the need of having several order management tablets through integration and it allows to monitor and manage from a single and centralized system administration tools and sales reporting.
Olo Pay
Olo Pay is a new module that allows restaurants to integrate several payment options (Visa, Mastercard, AmEx, Discover) facilitating and simplifying the customers’ transaction experience. The module enables chains to have integrated reporting for reconciliation via the Olo dashboard and provides PCI reporting. If a chain adopts Olo Pay, its customers no longer need to give their credit/debit card information, meaning that they can use the same payment method at any location that is part of the Olo ecosystem.
This has the effect of eliminating frictions that undermine the payment process and as a result it improves basket conversion rates while driving up sales. The beta version launched in October 2020 provided great results. Approximately 76% of customers saved their credit card information translating into a savings rate that is 2.5x higher than the average. Also, this module is highly beneficial for Olo itself as every restaurant that signs for both the ordering and the pay module enables Olo to generate 4x the revenue compared to a restaurant that uses only the order management module. In addition, Olo Pay has the potential to serve 4 times the number of restaurants that Olo could have served before introducing this solution and 6.25x the number of orders per location.
Value Proposition: Aggregators
There are two main reasons why DSPs want to have access to the Olo ecosystem. One is that they can link their marketplaces to Olo’s customers which count more than 600 brands and 82,000 active locations. Also, they are attracted to Olo (the go to solution) because it has exclusivity for all its customer locations and this is hugely beneficial to both marketplaces and Olo itself as they don’t have to increase their marketing and sales expenses to acquire a new customer location and Olo can more easily upsell with its new offerings without any additional costs. Second reason behind this choice is that aggregators can integrate and offer more accurate information about restaurants’ menus, prices, item availability, etc.
Olo Inc.
Value proposition: Restaurants
As it was already mentioned, restaurant chains can commoditize DSPs by choosing the one that best serves restaurants needs from a price, time, and quality standpoint. More specifically, in an industry with complex and strict regulations, time is a crucial factor when it comes to perishable goods and food safety. As it’s shown below, Olo guarantees the best average point to point transit time across the industry.
|
Service provider |
Average delivery time |
|
Olo |
12 min. |
|
DoorDash |
35 min. (2.9x) |
|
Uber Eats |
30-36 min. (2.5x-3x) |
|
Grubhub |
50 min. (4x) |
|
Postmates |
40 min. (3.3x) |
Industry main pain points
Restaurants must be able to efficiently use their resources to manage orders from both on- and off-premise. However, there is a great deal of complexity and many don’t have the funds or expertise to maintain a high level of customer experience while handling digital orders. To ensure food safety, Olo’s Dispatch module allows restaurant chains to automatically filter out delivery service providers that don’t meet the FDA regulations, so that food remains fresh and orders are fulfilled correctly.
Studies by Toast show that the majority of restaurants (69%) use multiple technologies. This means they need a software system to combine all their different point–of–sale systems and third–party delivery services, so orders can be processed and fulfilled efficiently. Unfortunately, restaurant businesses have slim profit margins due to high commission fees charged by Delivery Service Providers (DSPs), which range from 20% – 30%. Olo provides an effective way for restaurants to reduce costs while expanding digital demand; thus allowing them to save money on commissions and increase overall profits.
Olo has recently launched a new module called Olo Network, allowing restaurant chains to have more control of their customer data and reduce the number of orders from third–party delivery services. In addition, this module helps restaurants to increase the percentage of digital orders coming directly through their website while reducing the number of orders from third-party delivery services. Thanks to a partnership signed with Alphabet, Olo’s customers are able to gain exposure to a new pool of customers as they can offer direct order fulfilment through Google search results and Maps. This means that Olo Network will be responsible for enhancing a chain’s brand value, while increasing customer loyalty through more direct relationships. Therefore, restaurants can strengthen their presence into new digital channels which enables them to invest in advertising at a faster pace achieving at the same time higher ROAS (Return On Ad Spend.)
|
KPIs |
2019 |
2020 |
2021 |
Q1 2022 |
Q2 2022 |
Q3 2022 |
|
ARPU |
$1,160 |
$1,740 |
$2,019 |
$516 |
$544 |
$558 |
|
Active locations |
42,000 |
64,000 |
79,000 |
82,000 |
82,000 |
84,000 |
|
NRR |
+120% |
+120% |
+120% |
107% |
106% |
107% |
|
N° of modules per location |
N/A |
2.1 |
2.7 |
N/A |
N/A |
N/A |
|
Penetration rate |
N/A |
21.3% |
27.3% |
N/A |
N/A |
N/A |
Valuation
In the table below, I assume a five year horizon and three growth scenarios with the base one aligned with the management team’s expected growth rate. With regards to the shares outstanding figure, I assume that it will grow by 5% CAGR going from about 162 million in 2022 to 207 million in 2027. Moreover, I expect three EBIT margins ranging from 25% to 30% as the business starts seeing the benefits of operating leverage. Among the scenarios, the base and high ones have a margin of safety higher than 50% compared to the low case which provides little protection.
| Assumptions | Low | Base | High |
| Revenue | $462,100 | $512,262 | $566,711 |
| CAGR | 20% | 22.5% | 25% |
| EBIT margin % | 25% | 27.5% | 30% |
| EBIT | $115,525 | $140,872 | $170,013 |
| Tax rate | 21% | 21% | 21% |
| Net Profit | $91,265 | $111,289 | $134,310 |
| Multiple | 20x | 25x | 30x |
| Intrinsic value | $1,825,300 | $2,782,225 | $4,029,308 |
| Shares outstanding | 207,223 | 207,223 | 207,223 |
| Intrinsic value per share | $8.8/share | $13.4/share | $19.4/share |
| Margin of safety | 27.3% | 52.2% | 67% |
Risks
I believe that 2023 will be a turbulent year for Olo and the restaurant industry, which will result in short-term pain for the business. Moreover, there is the risk of competitors strengthening their value propositions, resulting in increasing competition for Olo. Another risk is represented by Olo rising its modules prices high enough to create damages in the company’s relationships with its clients. Another risk worth considering is fees concentration. As of the third quarter of 2022, one client accounted for more 12% of total revenues (down from 16% YoY).
Conclusion
Therefore, I believe the company enjoys significant network effects and switching costs as it would take significant expenses and almost a year to replace Olo’s services with another provider’s services. I expect these competitive advantages to further strengthen in the future as the company continues to improve its offerings. Finally, despite short-term headwinds in 2023, I believe the company is a buy as it provides a robust margin of safety over the next 5-years.
Be the first to comment