

Torsten Asmus
The facts have changed. How so?
-
U.S. oil demand is starting to trend higher, one of the key indicators we pointed out in our article last week.
-
OPEC+ announcing a production cut of ~2 million b/d with a real impact on the oil market of 0.8 to 1.1 million b/d.
-
China’s zero-COVID policy is set to unwind post-October. How? Signals from Chinese teapot refineries, reopening signals (Beijing marathon, Hong Kong reopening, and more).
-
The end of Strategic Petroleum Reserve release post-November. SPR release is being used for political purposes, if you think otherwise, I have a bridge to sell you.
All of these point to the direction of oil going up.
If you take a step back at the craziness of the oil market over the last 4 months, there was a certain clarity to the madness. Both the upper bound and the lower bounds of the oil market have been defined by demand reduction and OPEC+ policy. At $180/bbl (crude + refining), we saw a visible demand reduction via the EIA monthly data from July. At Brent below $90/bbl, we saw OPEC+ take action via a production cut.
The range going forward then is $80 to $125/bbl WTI. Oil prices will oscillate in this range until something visibly breaks. As you will see in the chart below, we are likely to break to the upside of that range.
For example, with China set to reopen and oil demand recovering going into 2023, the implied oil market deficit will greatly increase. Updating our global oil supply & demand model using the latest OPEC+ production policy, this is what we have:
IEA, HFIR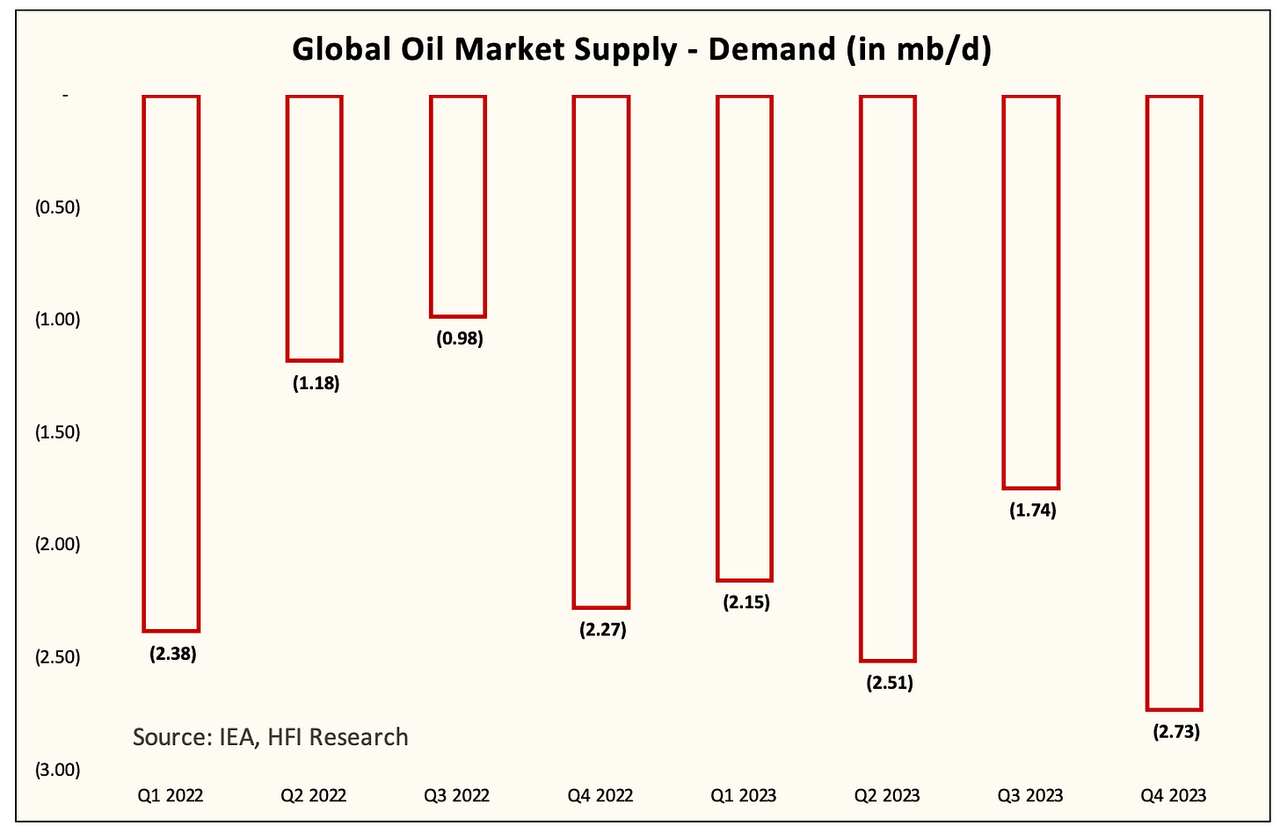
What oil watchers need to understand about the latest OPEC+ production cut is not how much they are actually cutting. No, that’s not even the point. The main point is the fact that this cut all but guarantees no production increase. Going into 2023, we had Saudi, UAE, Kuwait, and Iraq ramping up oil production in response to Russia losing oil production. With this agreement now, this increase has flipped, and as a result, the deficit you see for 2023 is massive.
What’s even more troubling about this chart above is that we are assuming Iran returns to full capacity in the 2nd half of 2023. In addition, we are assuming US oil production increasing to 12.75 – 12.90 million b/d in Q3 and Q4 2023, respectively. And even in this scenario, the global oil market is set to show a deficit of 2.73 million b/d.
Said it in another way, global oil demand can fall by an average of ~2 million b/d in 2023, and we will still show an oil market that’s in deficit. That’s a lot.
For oil bulls, the global supply and demand deficit should be viewed as a margin of safety. Oil market prediction is inherently difficult, so one needs to be cautious when making these calls, but in my years of analyzing the oil market, I have never seen a larger deficit than this. And while I am trying to be as conservative as possible on my assumptions, I am having a hard time shaving off these deficit assumptions.
The facts have changed and we are ready.
Be the first to comment