

Oil Price Talking Points
The price of oil extends the advance following the Organization of the Petroleum Exporting Countries (OPEC) meeting amid the ongoing slack in US output, and looming developments in the Relative Strength Index (RSI) may show the bullish momentum gathering pace as the indicator flirts with overbought territory.
Oil Price Approaches February 2020 High Following OPEC Meeting
The price of oil trades to a fresh weekly high ($51.28) as it carves a series of higher highs and lows, and crude may continue to approach the February 2020 high ($54.66) as OPEC and its allies appear to be on track to regulate the energy market throughout 2021.
Following the 13th OPEC and non-OPEC Ministerial Meeting (ONOMM), Saudi Arabia announced plans to reduce oil production by 1 million b/d in February and March, with Energy Minister Prince Abdulaziz bin Salmangoing onto say that the group “will take all necessary actions” during an interview with Bloomberg News as the adjustment is set to expire in April.
The ongoing efforts by OPEC and its allies should help to keep oil prices afloat as recent data prints coming out of the US revealed a 8010K decline in crude inventories, with oil output still sitting at its lowest level since 2018.
The update from the Energy Information Energy (EIA) showed field production holding steady at 11,000K for the fourth consecutive week, and the ongoing slack in US output may keep crude prices afloat even though OPEC+ plans to “gradually return 2 mb/d to the market, with the pace being determined according to market conditions.”
With that said, the price of oil may continue to approach the February 2020 high ($54.66) as it extends the series of higher highs and lows from earlier this week, and looming developments in the Relative Strength Index (RSI) may show the bullish momentum gathering pace as the indicator flirts with overbought territory.

Recommended by David Song
Learn More About the IG Client Sentiment Report
Oil Price Daily Chart
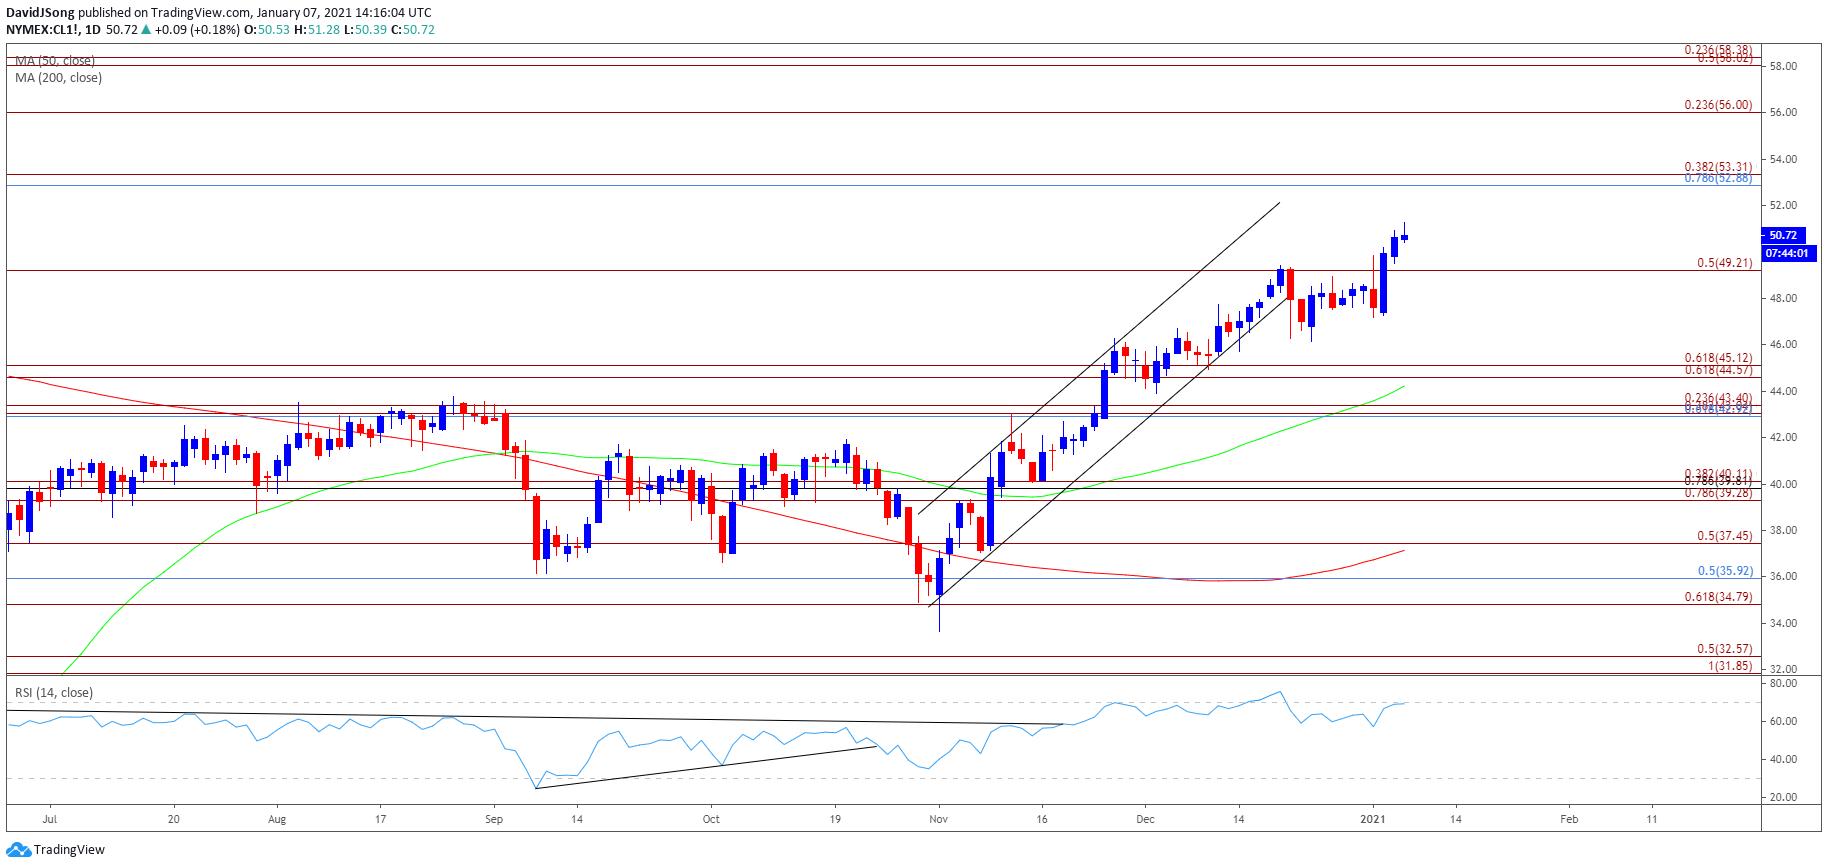
Source: Trading View
- Keep in mind, crude broke out of the range bound price action from the third quarter of 2020 following the failed attempt to close below the Fibonacci overlap around $34.80 (61.8% expansion) to $35.90 (50% retracement), and the price of oil may continue to retrace the decline from the start of 2020 as it clears the March high ($48.66).
- The price of oil may continue to approach the February 2020 high ($54.66) as it carves a series of higher highs and lows, and theRelative Strength Index (RSI) may show the bullish momentum gathering pace if the indicator breaks above 70 and pushes into overbought territory like the behavior seen in December.
- The close above the $49.20 (50% expansion) region brings the Fibonacci overlap around $52.90 (78.6% retracement) to $53.30 (38.2% expansion) on the radar even though the price of oil no longer tracks the upward trend carried over from November, with the February 2020 high ($54.66) up next.

Recommended by David Song
Traits of Successful Traders
— Written by David Song, Currency Strategist
Follow me on Twitter at @DavidJSong
Be the first to comment