

Chaay_Tee
Overview
I currently have a monthly article series here on Seeking Alpha for my DGI portfolio, tracking my dividend growth and reviewing my transactions. The most recent installment of this series can be found here. However, I have not spent the time to provide a deeper analysis of the portfolio’s structure and its performance. In this article I will discuss my investing strategy along with taking a look at category breakdowns, portfolio yield metrics, and performance.
Portfolio Strategy and Philosophy
My overall investment philosophy is based on a focus in dividend growth and investing in healthy, established companies with a long term buy-and-hold strategy. Obviously there are some minor deviations from this ideology but for the overwhelming majority of my holdings this philosophy holds true.
Some important notes on my portfolio:
- I invest more heavily into REITs than most standard portfolios, accounting for roughly 20% of all holdings. I view distributions from my REITs as monthly rental income earned from tenants. A large, reliable base of monthly income from these tenants provides a strong capability to increase my dividend income by utilizing the combination of higher yields, dividend increases, and recurring cash injections to purchase additional shares.
- I only own one ETF as I prefer to choose my individual investments and avoid management fees.
- I only hold 2 non-dividend paying positions, totaling about 4% of my entire portfolio.
- I automatically reinvest all dividends as I am still in the accumulation phase.
My long term goal is to be able to retire early and live largely off of my dividend income. By remaining diligent and sticking to my strategy this reality is achievable and if future performance is anywhere near the ball park of this past year, that reality may come even earlier than I expected.
Portfolio Breakdown
Instead of breaking down my holdings simply into sectors, I view my positions as members of six different categories. By viewing my investments in this light I find it easier to visualize my strategy and identify areas where I may want to direct future contributions. Below I break down these six categories and why they are important.
- Cornerstones – This is made up of just two companies, Microsoft (MSFT) and Visa (V). A full description of my cornerstone philosophy can be found here but in short, I find these two blue chips to be some of the greatest investments available today. They exhibit several desirable qualities such as high profitability, excellent balance sheets, and strong historical growth that will likely carry well into the future.
- Core DGI – This is the largest percentage of any category and contains the majority of my holdings. These companies exhibit an above average combination of historical dividend growth and dividend yield.
- REITs – As mentioned before, I utilize REITs for their ability to provide large dividends that can be snowballed to build a real estate empire without the hassle of being a real landlord.
- High-Yield Equities – I define high yield as 4.5%+ for equities. While yield chasing can be dangerous, a healthy level of higher yielding companies in combination with Core DGI stocks can provide accelerated growth in dividend income.
- ETFs – Only one holding exists here, the Schwab U.S. Dividend Equity ETF (SCHD). A popular holding amongst dividend oriented investors, this ETF has provided unbeatable dividend growth rates amongst ETFs and provides a strong starting yield. The ultimate goal for this holding is to begin using its distributions to add to high conviction holdings or initiate new positions. Essentially I will view it as a source of fresh capital that allows me greater flexibility of what I want to do with cash on hand.
- Non-Dividend Payers – The two members of this category are Amazon (AMZN) and Boston Omaha Corporation (BOC). I view both of these members as prospects for strong growth in the future. Amazon does not require much explanation as there are a plethora of articles here on Seeking Alpha discussing the future potential growth of the company. Boston Omaha is a more under-the-radar holding that can be understood in more detail through my article here.
Portfolio Composition (Personal accounting tracker)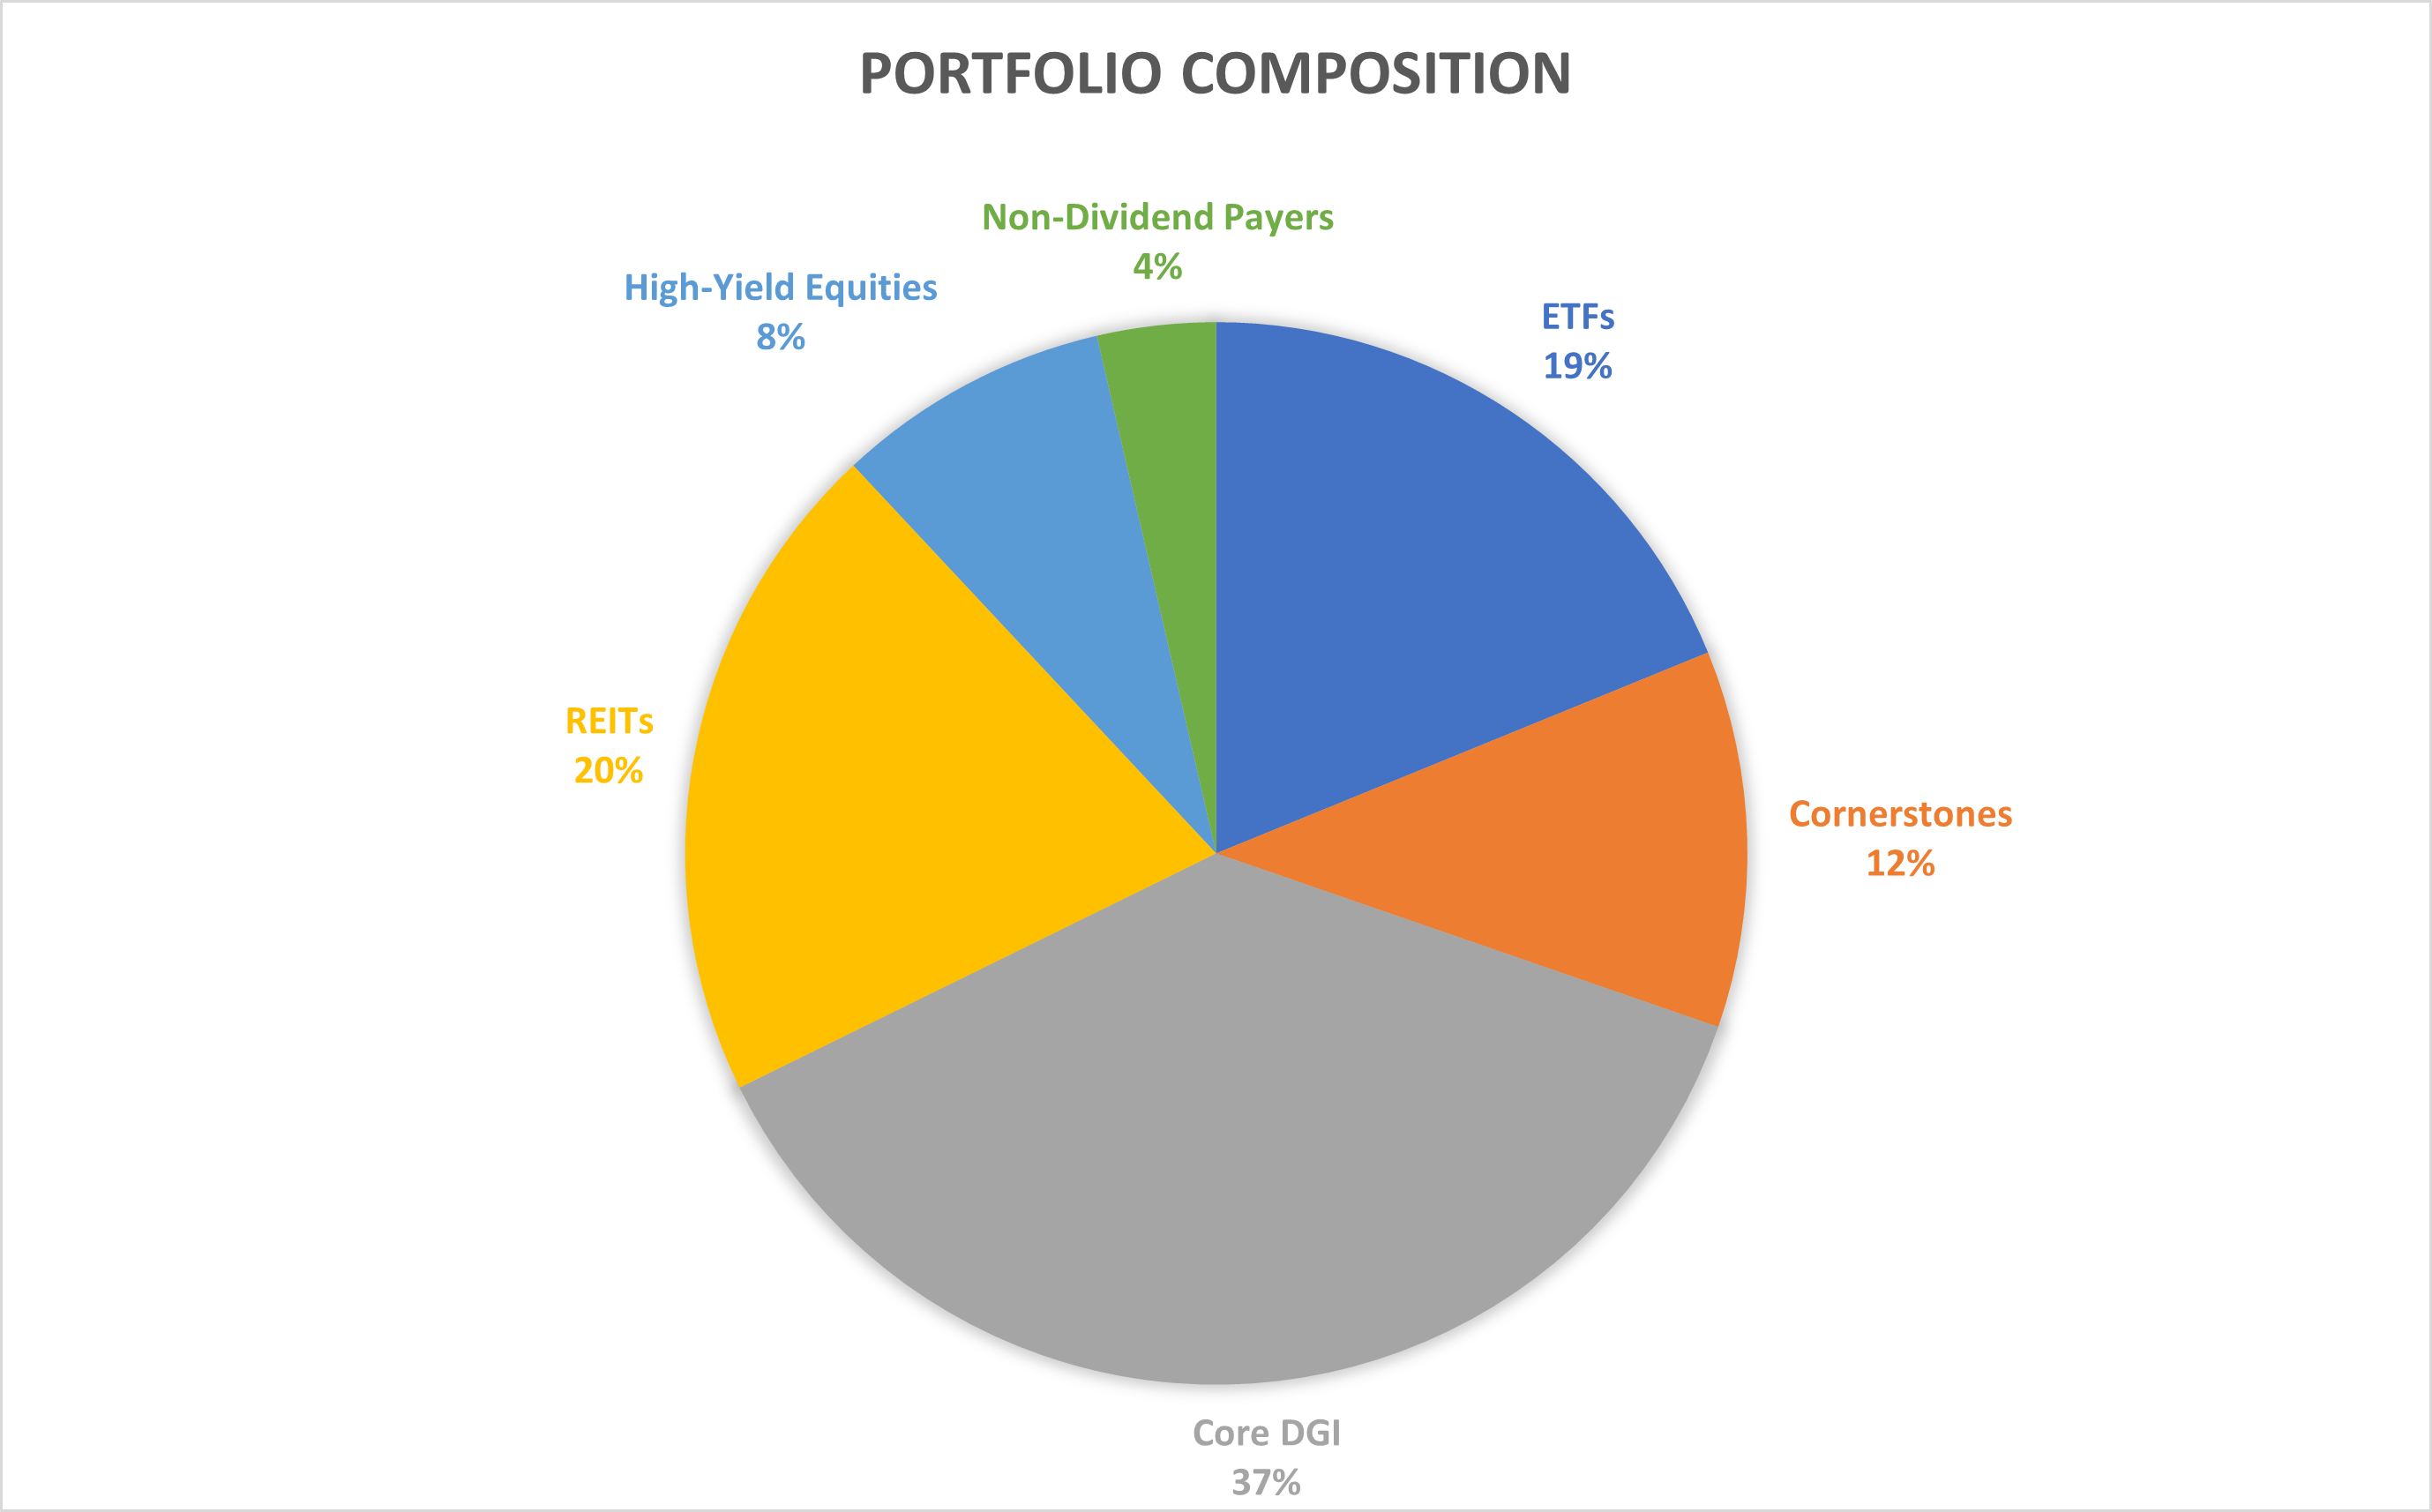
One aspect I like about this composition is that 35% of my portfolio (Cornerstones, ETFs, and Non-Dividend Payers) doesn’t require active management or high levels of attention. I believe in the long term potential of these positions and I am not concerned about the day-to-day changes surrounding these holdings. I do not have a target composition as of now and will default to the more simple strategy of letting my winners run and to monitor for any major news or changes in business plans for the companies I hold.
For a more detailed look, here are the members of each category.
Performance and Metrics
Dividend income and dividend growth is great but at my age (30+ years from the no-penalty retirement account minimum withdrawal age) it is extremely important to have strong total performance from my investments so I can maximize my portfolio value come retirement. To evaluate my performance and the capability of my portfolio to continue the compounding process I have taken a look at several major metrics including weighted dividend yield, weighted trailing 5-year dividend growth rate, and total returns then compared these values to the S&P 500 benchmark (SPY).
| Current Yield | 5-yr DGR | 1-month Total Returns (annualized) | 3-month Total Returns (annualized) | 1 Year Total Returns | |
| SPY | 1.52% | 5.65% | 6.28% | 5.76% | -8.22% |
| My Portfolio | 3.33% | 12.90% | 7.79% | 9.58% | -4.46% |
| Comparison Delta | +1.81% | +7.25% | +1.51% | +3.82% | +3.76% |
I am more than happy to see that my portfolio has more than double the current yield, a dividend growth rate that has been greater than 2 times faster, and greater total returns in the past month, 3 months, and trailing twelve months than the S&P 500. Obviously this performance cannot be expected every year in the future but it does provide at least some evidence to support the effectiveness of my strategy and investment philosophy.
To visualize and understand the magnitude of the large outperformance of my portfolio in regards to dividend income and growth, I have put together a quick simulation of what my annual dividend income would be in 30 years once I’m close to retirement age. For this comparison I applied the same dividend growth rates and yields as current for all 30 years. Because I am assuming automatic dividend reinvestment for both, it is prudent to use what is known as the Chowder Number to model total dividend returns annually. This formula takes into account the 5-year dividend growth rate CAGR and current yield to accurately estimate the total increase in dividends after a full year.
Chowder Number Calculation (dividendgrowthinvestingandretirement.com)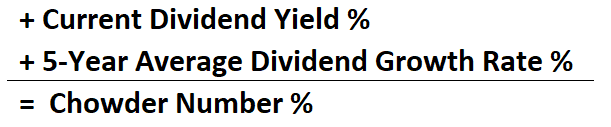
As a starting basis for both SPY and my portfolio, I have used my current estimated dividend income of $5,661 that was reported in my last DGI monthly article for each.
| Year 0 Dividends | Chowder Number | Dividend Income at Year 30 | |
| SPY | $5,661 | 7.17% | $45,195 |
| My Portfolio | $5,661 | 16.23% | $515,751 |
| Comparison Delta | — | +9.06% | +$470,556 |
This is truly an unfathomable difference and it’s obviously not a realistic expectation to assume this high level of dividend growth or this large outperformance versus SPY for 30 straight years. However, this is valuable information for understanding how large of an effect that an outperformance in total dividend growth rate versus the S&P 500 can have on your portfolio when you get to retirement.
REIT Investing Strategy
My strategy to utilize REITs for a sizeable percentage of my portfolio is based on my goal to treat my REIT dividends as if they were monthly payments paid to me by my tenants across my real estate empire. From my current holdings that would mean I am receiving payments from a diverse group of tenants. I receive monthly income from hospitals, casinos, cell towers, data centers, gyms, car washes, auto repair shops, restaurants, grocery stores, retail shops and more. What I like about REITs is that they offer a great combination of dividend yields and dividend growth with more stable income as they generally have long term leases.
REITs on average have not had the total returns performance of the S&P 500 in recent decades and may reduce my chances of maximizing my total portfolio value, a crucial goal at my age that I mentioned earlier. While that seems counterintuitive, it’s important to keep in mind the purpose of this portion of my portfolio. My objective is to use this chunk of my portfolio to grow my dividend income for when I hit retirement. The remaining 80% of my portfolio can remain focused on total returns. I will use the triple headed attack of dividend yield, dividend growth, and recurring new cash investments to grow my REIT dividend pile. To illustrate the income potential from this method I have provided an example of what my tenant payments could pile up to over the next 30 years using my actual current REIT holdings data.
To create this projection, I started with the total value of my current REIT holdings and current REIT income. Next, I used several conservative inputs of 4.5% yield along with a 4.5% annual dividend growth rate and share price increase. I say these are conservative estimates as they are definitively lower than the historical performance of my current holdings and REITs are currently trading at historically discounted multiples due to the high inflationary environment. Lastly, I also modeled a total monthly contribution of $300 across these holdings, in line with what my historical contributions have been.
| REIT Total Holding Value | Annual REIT Income | Avg. Monthly Income | |
| Current | $32,954.18 | $1,615.03 | $134.59 |
| Year 5 | $62,980.52 | $2,834.12 | $236.18 |
| Year 10 | $118,448.30 | $5,300.17 | $441.68 |
| Year 15 | $203,792.35 | $9,170.66 | $764.22 |
| Year 20 | $335,104.76 | $15,079.71 | $1,256.64 |
| Year 25 | $537,145.16 | $24,171.53 | $2,014.29 |
| Year 30 | $848,009.37 | $38,160.42 | $3,180.04 |
According to this projection, when I enter retirement I would be collecting rental checks of nearly $3,200 every month and would be sitting on a real estate portfolio worth $850,000. The potential to receive over $38,000 per year from just my real estate holdings alone with a simple investment strategy is inspiration enough for me to at least continue pursuing this route for the time being. For comparison, to earn $38,160 in retirement from SPY at its historical yield of 1.7% it would require a $2,244,706 position.
Takeaways
Throughout the past 7 months of providing monthly updates and performing this deeper dive analysis, I have a few major takeaways.
- REITs provide an important benefit to long term DGI portfolios, higher yields with greater stability.
- Increasing the number of levers used for growing your total portfolio value accelerates the compounding effect and is crucial for sustaining high levels of growth. Utilizing three different mechanisms for growing my portfolio is critical to my success (dividend reinvestments, investing in dividend growers, and making scheduled recurring cash investments). Further mechanisms exist such as writing covered calls that can provide even greater acceleration.
- Give your investments purpose. By breaking down my holdings into categories I am able to more easily visualize and confirm that my portfolio is in line with my goals or identify changes that I may need to make.
Conclusion
Every investor has different goals and objectives for their investments but it’s hard to deny that large incomes and high growth rates are both ideal characteristics. The purpose of this article was to show a little more detail on the structure of my portfolio and how I view my investments to go along with my monthly DGI updates. Additionally, the important lessons that I have learned and strategies that I have implemented are now quantifiable and may inspire other fellow investors to think about their investing goals and assess the strategies that have or haven’t helped them toward that goal.
I am realistic and understand I won’t always see such outperformance as I did in the past 12 months but believe I have built a framework that will lead me in the right direction to retire early and live off dividends without the necessity of withdrawing from my principal.
Be the first to comment