

Crude Oil Talking Points:
- Oil prices are holding on to a second consecutive day of gains after support showed at a Fibonacci level on Friday.
- There’s a short-term falling wedge here and resistance is confluent with another Fibonacci level, opening the door for bullish reversal potential if buyers can push the theme.
- The analysis contained in article relies on price action and chart formations. To learn more about price action or chart patterns, check out our DailyFX Education section.
Recommended by James Stanley
Get Your Free Oil Forecast
WTI crude oil is holding on to a bounce so far this week, with a Fibonacci level coming in last Friday to help establish the low. That support held through this week’s open and WTI has been able to push back above the 75 psychological level. The big question, of course, is whether this is a meaningful low or whether it’s a mere speed bump on the way back into the 60’s.
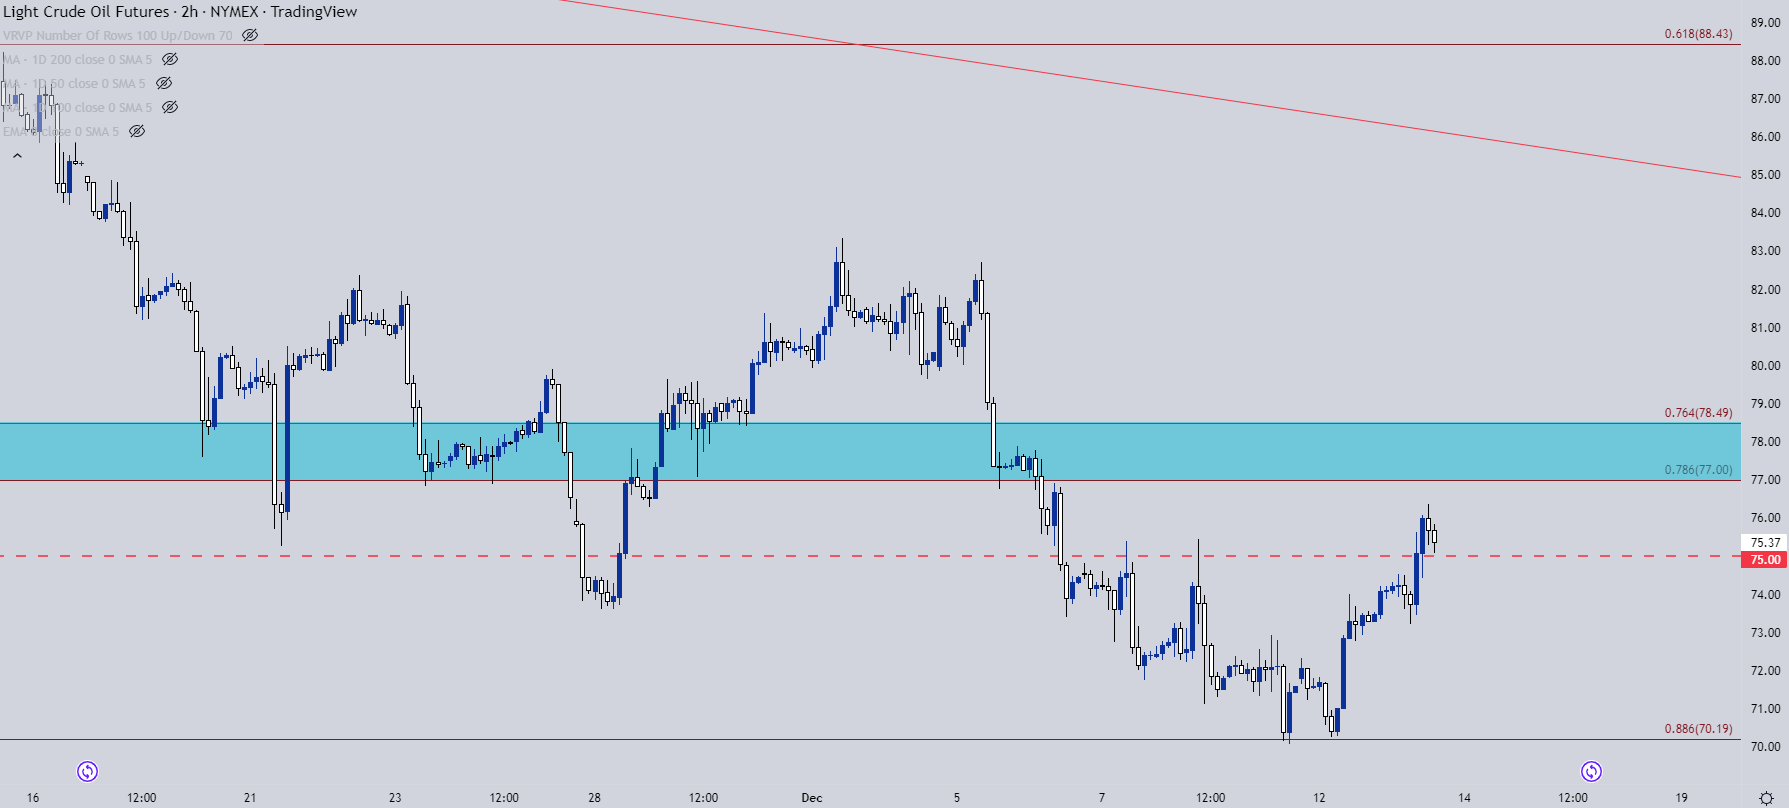
From short-term charts, there could possibly be something to work with, as this morning saw prices push up to a fresh higher-high, keeping the door open for a re-test of the $77-78.49 area of resistance sitting overhead.
WTI Crude Oil Two-Hour Price Chart
Chart prepared by James Stanley; CL1 on Tradingview
Taking a step back, we can put this recent bounce into scope and the bearish trend remains prominent. There has been a slower approach from bears at or near support, however, leading to the build of a falling wedge formation. This can keep the door open for bigger-picture bullish reversal scenarios, but bulls will first have to contend with that overhead resistance that runs from the 77 handle up to 78.49, which are the 76.4 and 78.6% Fibonacci retracements of the Dec 21 – March 2022 major move.
Recommended by James Stanley
How to Trade Oil
WTI Crude Oil Four-Hour Price Chart
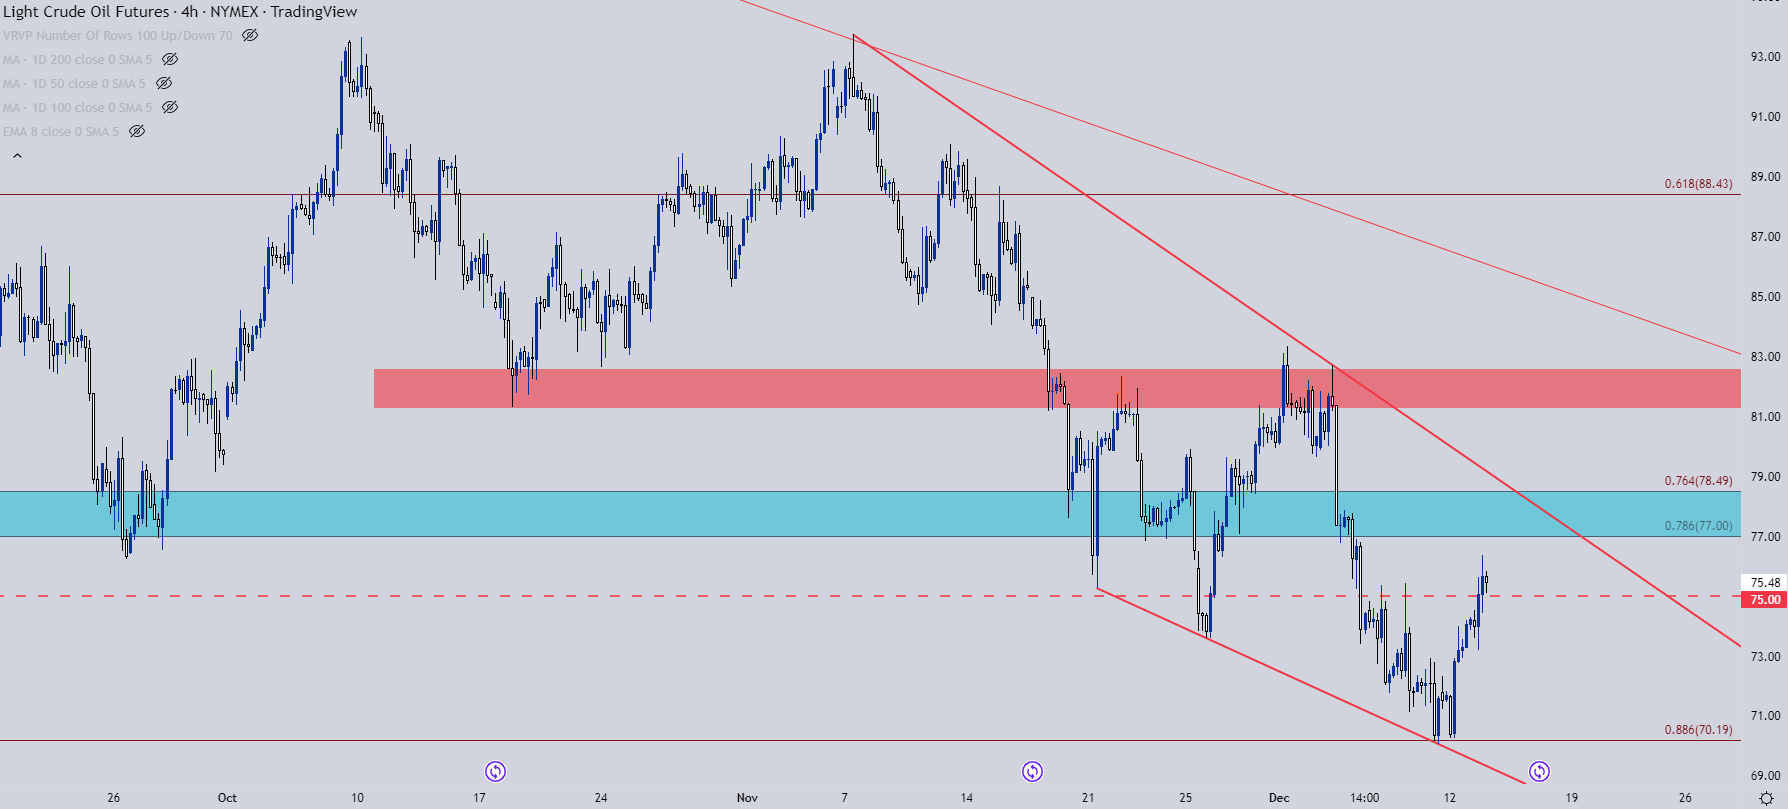
Chart prepared by James Stanley; CL1 on Tradingview
Taking a further step back, and we can start to see why the bullish side of this is somewhat exciting. As prices get closer and closer to that rumored figure at which the US might begin to re-stock crude inventories in the SPR, it’s difficult to get too excited about continued bearish momentum, unless another surprise factor appears.
But, the structure is there for bullish reversal potential if bulls want to make the move. A breach of the shorter-term falling wedge opens the door for a re-test of a big spot of support-turned-resistance, plotted around the 81.30 level.
Recommended by James Stanley
Understanding the Core Fundamentals of Oil Trading
WTI Crude Oil Daily Price Chart
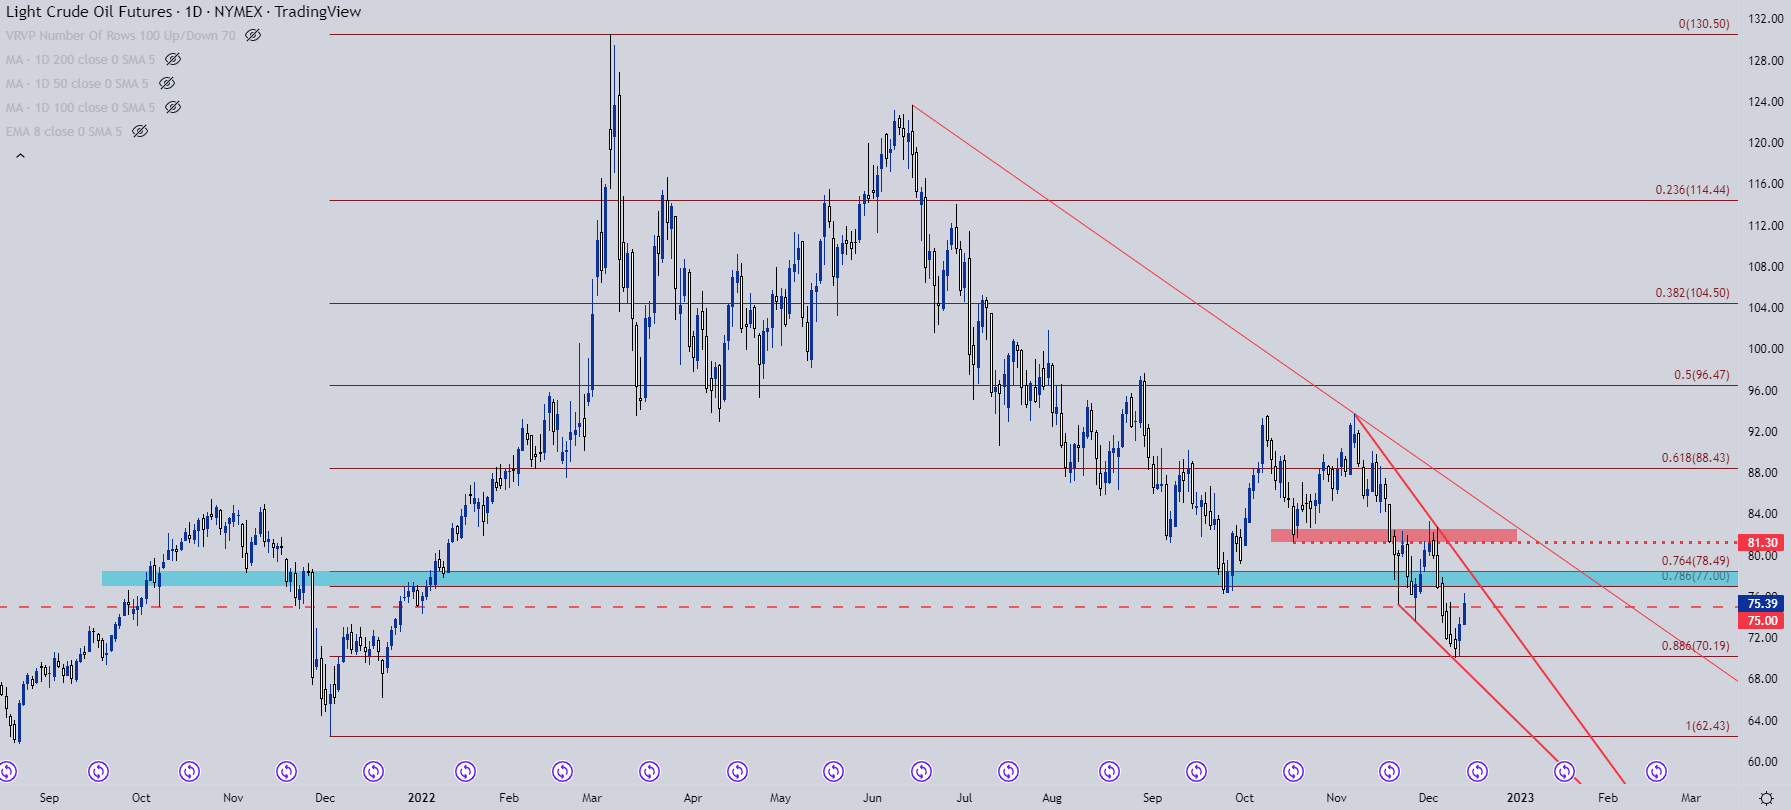
Chart prepared by James Stanley; CL1 on Tradingview
— Written by James Stanley, Senior Strategist, DailyFX.com & Head of DailyFX Education
Contact and follow James on Twitter: @JStanleyFX
Be the first to comment