

Sakorn Sukkasemsakorn
A Quick Take On Ohmyhome Limited
Ohmyhome Limited (OMH) has filed to raise $14.6 million in an IPO of its ordinary shares, according to an F-1 registration statement.
The firm provides real estate brokerage and other related services in Singapore.
OMH is still a tiny company with no track record of successful expansion outside of its home market and the IPO is highly priced.
I’m on Hold for the OMH IPO.
Overview
Singapore-based Ohmyhome Limited was founded to facilitate real estate property brokerage transactions as part of an integrated real estate services company.
Management is headed by co-founder and Chief Executive Officer Ms. Wong Wan Chew, who has been with the firm since inception in 2015 and has previously co-founded a real estate consulting firm and has several years experience as a real estate broker.
The company’s primary offerings include:
-
Online brokerage
-
Home renovation
-
Furnishings
-
Listing and research
-
Mortgage referrals
-
Legal services
-
Insurance referrals
As of June 30, 2022, Ohmyhome has booked fair market value investment of $8.1 million from investors including Anthill, Vienna Management Ltd. and GEC Tech Ltd.
Customer/User Acquisition
The firm markets its website, mobile app and related services online as well as through word of mouth.
As of July 31, 2022, the company’s platform had ‘over 20,000 active listings for residential properties for sale and rental on a monthly basis.’
Selling and Marketing expenses as a percentage of total revenue have trended lower as revenues have increased, as the figures below indicate:
|
Selling and Marketing |
Expenses vs. Revenue |
|
Period |
Percentage |
|
Six Mos. Ended June 30, 2022 |
29.7% |
|
2021 |
39.2% |
|
2020 |
35.4% |
(Source – SEC)
The Selling and Marketing efficiency multiple, defined as how many dollars of additional new revenue are generated by each dollar of Selling and Marketing spend, rose to 1.0x in the most recent reporting period, as shown in the table below:
|
Selling and Marketing |
Efficiency Rate |
|
Period |
Multiple |
|
Six Mos. Ended June 30, 2022 |
1.0 |
|
2021 |
0.6 |
(Source – SEC)
Market & Competition
According to a 2022 market research report by Mordor Intelligence, in 2021, there were over 28,000 non-landed residential deals worth $2 billion.
The market is expected to grow at a CAGR (Compound Annual Growth Rate) of 3.2% from 2022 to 2027.
The main drivers for this expected growth are affordable projects located in the Outside Central Region and a ‘preference for larger homes due to enduring work-from-home arrangements.’
Also, in the office segment, there has been continued demand from tenants ‘eyeing locations farther away from the city center to woo talent.’
Large technology companies are also expected to drive additional demand as the region experiences a greater influx of technology businesses.
Major competitive or other industry participants include offline sales agencies, which are the chief competition for the firm as there were over 1,100 agencies in Singapore in 2021.
Financial Performance
The company’s recent financial results can be summarized as follows:
-
Growing topline revenue
-
Higher gross profit but variable gross margin
-
Operating losses
-
Reduced cash used in operations
Below are relevant financial results derived from the firm’s registration statement:
|
Total Revenue |
||
|
Period |
Total Revenue |
% Variance vs. Prior |
|
Six Mos. Ended June 30, 2022 |
$ 2,432,938 |
41.7% |
|
2021 |
$ 3,240,890 |
31.2% |
|
2020 |
$ 2,470,619 |
|
|
Gross Profit (Loss) |
||
|
Period |
Gross Profit (Loss) |
% Variance vs. Prior |
|
Six Mos. Ended June 30, 2022 |
$ 1,097,872 |
6.9% |
|
2021 |
$ 1,764,838 |
73.9% |
|
2020 |
$ 1,014,949 |
|
|
Gross Margin |
||
|
Period |
Gross Margin |
|
|
Six Mos. Ended June 30, 2022 |
45.13% |
|
|
2021 |
54.46% |
|
|
2020 |
41.08% |
|
|
Operating Profit (Loss) |
||
|
Period |
Operating Profit (Loss) |
Operating Margin |
|
Six Mos. Ended June 30, 2022 |
$ (820,369) |
-33.7% |
|
2021 |
$ (1,733,782) |
-53.5% |
|
2020 |
$ 1,955,610 |
79.2% |
|
Comprehensive Income (Loss) |
||
|
Period |
Comprehensive Income (Loss) |
Net Margin |
|
Six Mos. Ended June 30, 2022 |
$ (681,254) |
-28.0% |
|
2021 |
$ (1,396,002) |
-57.4% |
|
2020 |
$ (2,093,905) |
-86.1% |
|
Cash Flow From Operations |
||
|
Period |
Cash Flow From Operations |
|
|
Six Mos. Ended June 30, 2022 |
$ (209,712) |
|
|
2021 |
$ (1,340,284) |
|
|
2020 |
$ (1,183,132) |
|
(Source – SEC)
As of June 30, 2022, Ohmyhome had $1.3 million in cash and $2.5 million in total liabilities.
Free cash flow during the twelve months ended June 30, 2022, was negative ($1.0 million).
IPO Details
Ohmyhome intends to raise $14.6 million in gross proceeds from an IPO of its ordinary shares, offering 3.25 million shares at a proposed midpoint price of $4.50 per share.
No existing shareholders have indicated an interest in purchasing shares at the IPO price.
The company also filed a Resale Prospectus for selling shareholders who may wish to sell up to 975,000 shares separately.
Assuming a successful IPO, the company’s enterprise value at IPO would approximate $74.2 million, excluding the effects of underwriter over-allotment options.
The float to outstanding shares ratio (excluding underwriter over-allotments) will be approximately 16.7%. A figure under 10% is generally considered a ‘low float’ stock which can be subject to significant price volatility.
Management says it will use the net proceeds from the IPO as follows:
Proposed Use Of Proceeds (SEC)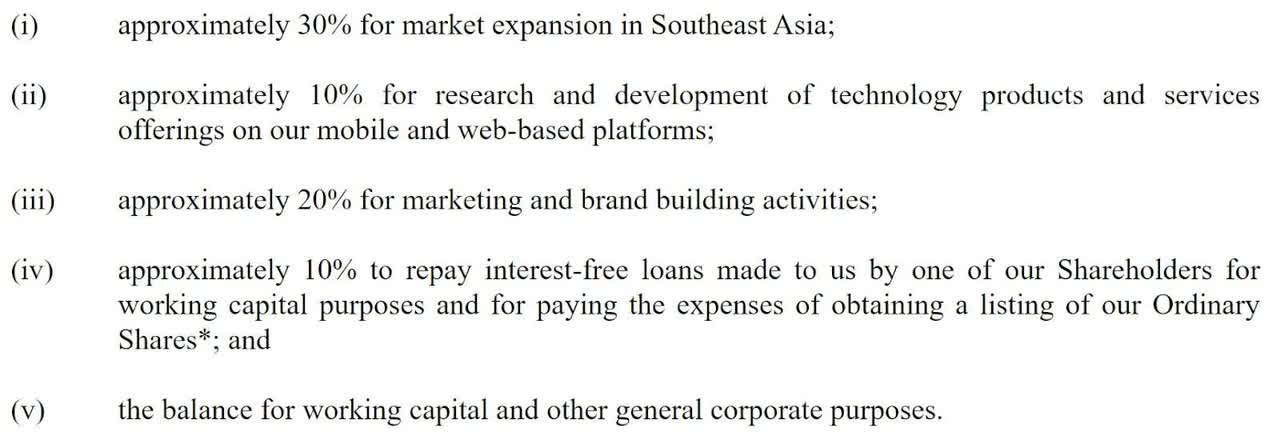
(Source – SEC)
Management’s presentation of the company roadshow is not available.
Regarding outstanding legal proceedings, management says the firm is ‘currently not involved in any material legal or arbitral proceedings.’
The sole listed bookrunner of the IPO is Spartan Capital Securities.
Valuation Metrics
Below is a table of relevant capitalization and valuation figures for the company:
|
Measure [TTM] |
Amount |
|
Market Capitalization at IPO |
$87,750,000 |
|
Enterprise Value |
$74,160,014 |
|
Price / Sales |
22.18 |
|
EV / Revenue |
18.74 |
|
EV / EBITDA |
-24.00 |
|
Earnings Per Share |
-$0.09 |
|
Operating Margin |
-78.10% |
|
Net Margin |
-43.34% |
|
Float To Outstanding Shares Ratio |
16.67% |
|
Proposed IPO Midpoint Price per Share |
$4.50 |
|
Net Free Cash Flow |
-$1,032,994 |
|
Free Cash Flow Yield Per Share |
-1.18% |
|
Debt / EBITDA Multiple |
-0.22 |
|
CapEx Ratio |
-34.98 |
|
Revenue Growth Rate |
41.68% |
(Source – SEC)
Commentary About Ohmyhome’s IPO
OMH is seeking U.S. public capital market investment to pay down debt and for its general corporate expansion plans, both inside and outside of Singapore.
The firm’s financials have produced increasing topline revenue, growing gross profit but variable gross margin, continued operating losses and lowered cash used in operations.
Free cash flow for the twelve months ended June 30, 2022, was negative ($1.0 million).
Selling and Marketing expenses as a percentage of total revenue have trended lower as revenue has increased; its Selling and Marketing efficiency multiple was 1.0x in the most recent reporting period.
The firm currently plans to pay dividends according to its dividend policy, which takes into account a wide variety of factors and which may include regulatory restrictions.
The market opportunity for providing online real estate services in Singapore is moderate, which is likely why management is seeking to expand in select areas of Southeast Asia.
Spartan Capital Securities is the sole underwriter and the sole IPO led by the firm over the last 12-month period has generated a return of negative (78.3%) since their IPO. This is a bottom-tier performance for all major underwriters during the period.
Risks to the company’s outlook as a public company include its tiny size and its plans to expand outside of Singapore.
As for valuation, management is asking investors to pay an Enterprise Value/Revenue multiple of approximately 18.8x.
OMH is still a tiny company with no track record of successful expansion outside of its home market and the IPO is highly-priced.
I’m on Hold for the OMH IPO.
Expected IPO Pricing Date: To be announced.
Be the first to comment