

Reserve Bank of New Zealand, New Zealand Dollar, Housing Prices, NZD/USD, NZD/JPY – Talking Points:
- The RBNZ’s dovish stance may pave the way for NZD to continue moving lower against its haven-associated counterparts.
- NZD/USD at risk of further losses as prices track within a Descending Channel.
- NZD/JPY rates consolidating above key support at the 55-EMA.
Discover what kind of forex trader you are
The New Zealand Dollar has toppled lower against its haven-associated counterparts since late-February, falling 6.8% and 4.4% against the US Dollar and Japanese Yen respectively. This dramatic sell-off was ignited by the swift repricing of hawkish Reserve Bank of New Zealand bets in the wake of the local government’s move to address the remarkable climb in housing prices.
Prime Minister Jacinda Ardern announced sweeping changes to capital gains property taxes in March, building on previous changes to the central bank’s remit to include the impact of its monetary policy settings on the housing market.
So far, these changes appear to be having an impact, as the number of investors in the market notably declines and the percentage of dwellings rising in price falls below 60% for the first time since August last year.
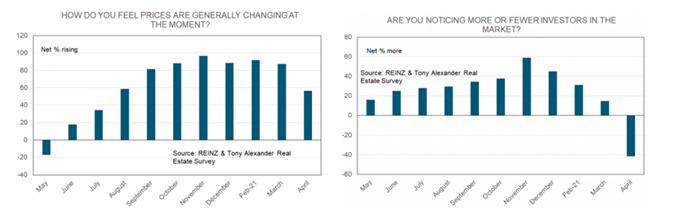
Source – REINZ
These developments could ease the pressure on the RBNZ to begin winding back some of its accommodative measures in the near term. Indeed, with a double-dip recession all but assured for the local economy, the central bank will likely retain its dovish stance over the coming months.
Fourth-quarter GDP unexpectedly contracted 1% in the last three months of 2020, and is expected to contract once again in the first quarter of this year. With that in mind, dovish rhetoric from the central bank could keep NZD on the back foot and open the door to further losses against the lower-beta USD and JPY in the near term.
NZD/USD Daily Chart – Descending Channel Guiding Price Lower

Chart prepared by Daniel Moss, created with Tradingview
From a technical perspective, the outlook for NZD/USD rates appears relatively bearish, as prices consolidate below the trend-defining 55-EMA (0.7108) and track within the confines of a Descending Channel.
With both the MACD and RSI tracking below their respective neutral midpoints, the path of least resistance seems skewed to the downside.
A daily close below the sentiment-defining 144-EMA (0.6998) probably intensifies near-term selling pressure and carves a path for price to challenge the 61.8% Fibonacci (0.6875).
On the other hand, a convincing break above psychological resistance at 0.7100 could invalidate bearish potential and bring the 0.7250 mark into the crosshairs.
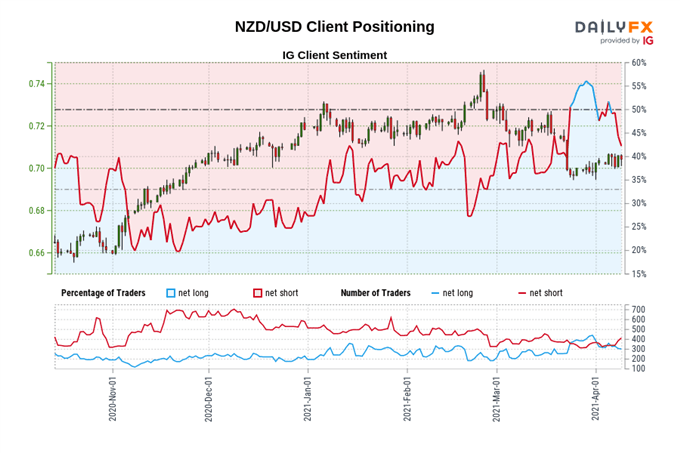
The IG Client Sentiment Report shows 41.51% of traders are net-long with the ratio of traders short to long at 1.41 to 1. The number of traders net-long is 6.54% lower than yesterday and 12.27% lower from last week, while the number of traders net-short is 1.71% lower than yesterday and 19.94% higher from last week.
We typically take a contrarian view to crowd sentiment, and the fact traders are net-short suggests NZD/USD prices may continue to rise.
Traders are further net-short than yesterday and last week, and the combination of current sentiment and recent changes gives us a stronger NZD/USD-bullish contrarian trading bias.
NZD/JPY Daily Chart – 55-EMA Capping Downside Potential

Chart prepared by Daniel Moss, created with Tradingview
In stark contrast to the price action seen on the NZD/USD chart, NZD/JPY rates appear poised to continue moving higher, as prices bounce away from the 55-EMA (76.63) and the uptrend extending from the March 2020 nadir remains intact.
Clambering back above the 8-EMA (77.20) probably propels the exchange rate to challenge the monthly high (77.49), with a daily close above that bringing the yearly high (79.21) into play.
Alternatively, a daily close below 76.60 could neutralize buying pressure and generate a downside push to challenge the 61.8% Fibonacci (75.77).
— Written by Daniel Moss, Analyst for DailyFX
Follow me on Twitter @DanielGMoss

Recommended by Daniel Moss
Top Trading Lessons
Be the first to comment