

AlbertPego
Thesis: Strong Performance Outweighs Heavy Debt Load
NexPoint Residential Trust (NYSE:NXRT) is a rapidly growing apartment REIT focused on affordable, Class B apartment communities in Sunbelt states with strong job and population growth. The REIT also engages in a value-add strategy in which it targets properties with potential upgrades, performs those upgrades, and earns high returns on investment from them.
Though NXRT has a strong track record of high growth, this year has been its best. In the second quarter, AFFO per share rose 37% year-over-year. In the first half of the year, AFFO per share reached 36%.
Indeed, the COVID era has been phenomenal for NXRT’s performance. In the four quarters ending Q2 2022, NXRT generated $3.27 in AFFO per share. Compare that to full-year 2019 AFFO per share of $2.20.
Let’s think about this for a moment. Over the twelve months ending June 30th, 2022, NXRT’s AFFO per share surged 49%. Meanwhile, its share price has collapsed back to the level it was in February 2020, just before the onset of COVID-19.
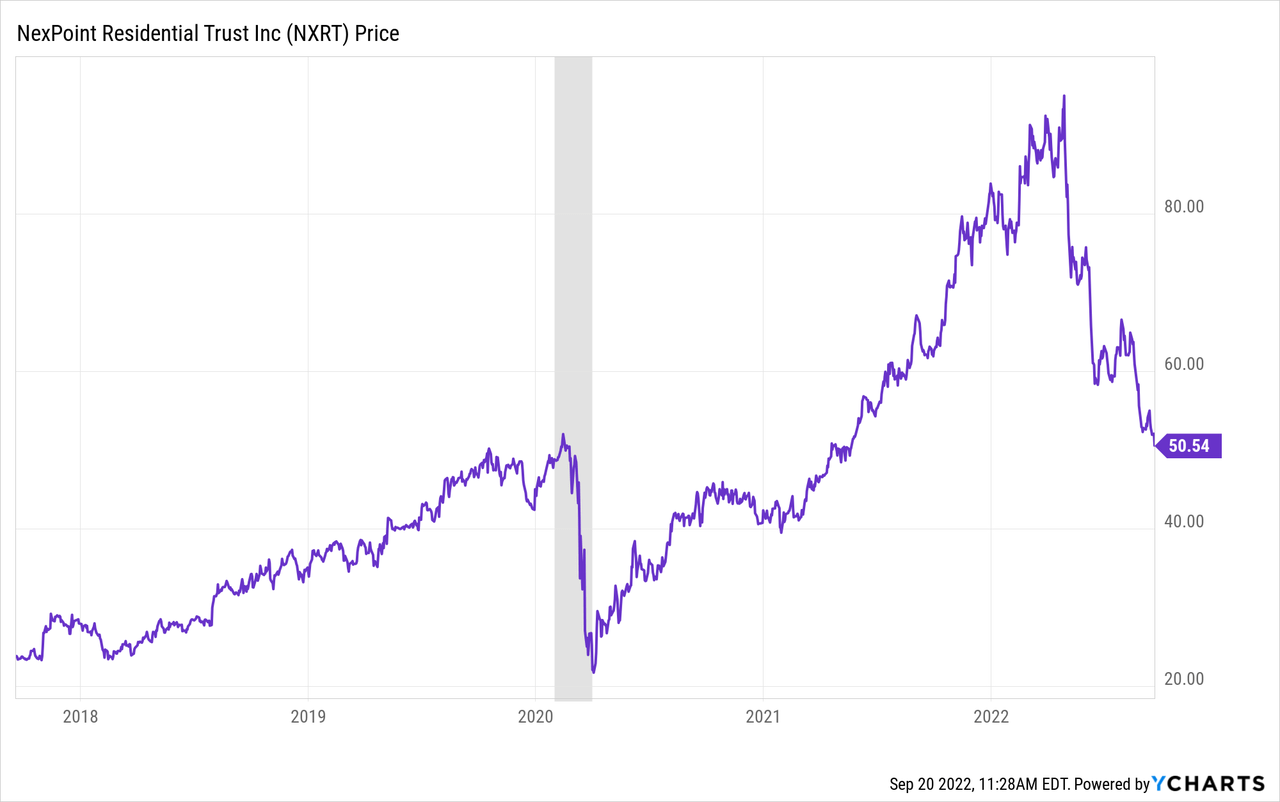
That has brought NXRT’s price to TTM AFFO to about 15.6x. Compare that to the price to forward (2022 guidance) AFFO multiples of NXRT’s Sunbelt peers:
- Mid-America Apartment Communities (MAA): 21.4x
- Camden Property Trust (CPT): 21.0x
- Independence Realty Trust (IRT): 17.2x
NXRT’s management also puts out its own estimate of the REIT’s net asset value (“NAV”) per share every quarter. In Q2, based on an average assumed cap rate of 4.1%, NXRT’s estimated NAV per share range of $80.70 to $96.27 had a midpoint of $88.48.
Going off of that NAV per share estimate, NXRT is currently trading at only 57.5% of NAV, indicating 74% upside to NAV.
The big problem with NXRT is the company’s heavy debt load, which we’ll address below. In short, I believe the REIT’s strong fundamental performance outweighs the high debt.
Plus, with a payout ratio south of 50% of AFFO, NXRT’s 3% dividend yield looks extremely attractive for long-term dividend growth investors.
Midyear Update On NXRT
NXRT is externally managed by NexPoint Real Estate Advisors LP, which should normally set off alarm bells for investors. But in the case of NXRT, I think interests are adequately aligned between management and shareholders.
The first reason for this is the roughly 12% insider ownership among management. The second reason is that the external manager charges 3% of monthly gross income to manage the properties. Compare this to the average residential property management fee equal to 8-12% of rental revenue.
NXRT’s strategy from inception has been to target Class B apartments in dynamic, fast-growing cities of Sunbelt states.
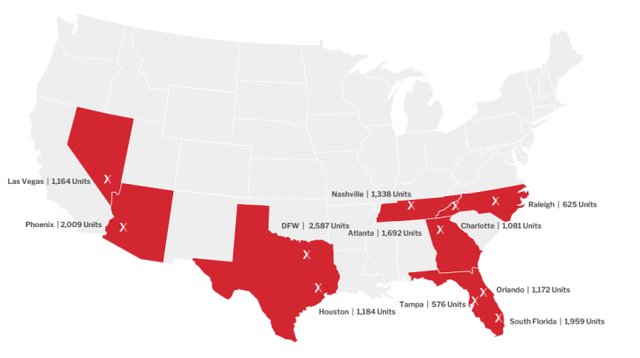
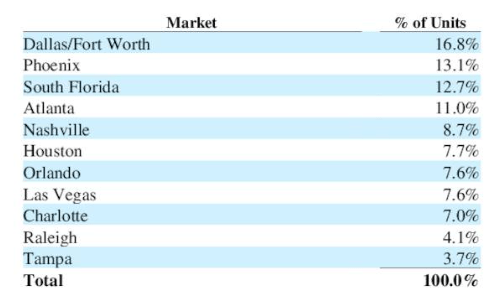
NXRT June Presentation
Unsurprisingly for a Dallas-based company, the DFW metro area boasts the top spot for number of units under management. But NXRT’s handpicked markets have all been beneficiaries of the COVID-era interstate migration trends.
NXRT Q2 Presentation
This year, despite multiple sources cautioning investors about supply-demand dynamics bringing the multifamily market back into equilibrium and rent rates cooling, it’s important to acknowledge that the setup is still favorable to Class B landlords like NXRT.
That is true for a few reasons. First, housing affordability has declined for everyone, renters and would-be home buyers alike. This makes NXRT’s relatively affordable Class B units more attractive, as slightly over 2/3rds of employed Americans could afford to live in them.
NXRT Q2 Presentation
Second, the situation is still favorable to NXRT because of the REIT’s value-add strategy. Basically, NXRT acquires B or B- apartments, then applies various upgrades to bring them up to today’s standards of design and technology, and the result is a higher rent rate.
In Q2, NXRT completed upgrades on 650 units, leasing 609 of them to produce an ROI of ~25%.
This gives NXRT an edge in the current environment because it positions its recently upgraded units as an attractive, affordable alternative to renters who are being priced out of Class A communities.
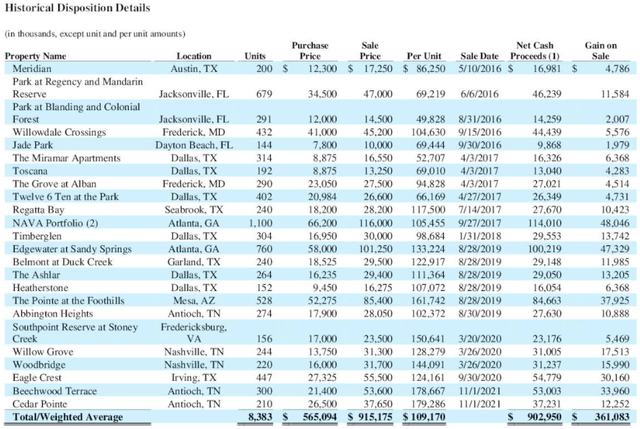
Once NXRT has more or less exhausted its upgrade opportunities at a certain property, it will recycle capital by selling the appreciated property and reinvesting the proceeds back into new Class B properties in need of upgrades. Rinse and repeat.
Following this strategy, NXRT has racked up an impressive history of gains on its dispositions.
NXRT Q2 Presentation
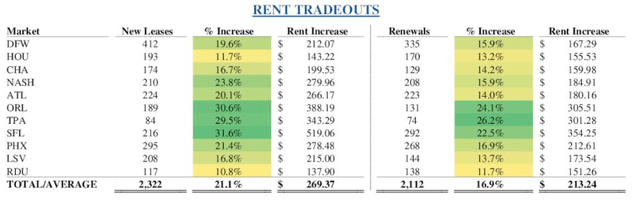
But, of course, the ability to recycle capital profitably is linked to the REIT’s ability to raise rents and net operating income. NXRT could buy and sell a property at a 4% cap rate, but if NOI has risen considerably in the intervening period, then the REIT will book a nice gain on the sale.
As such, it is nice to see that in both Q2 and the first half of this year, same-store NOI growth has been 16.4%. That is based on lease-over-lease rent growth of 21% for new leases and 17% for renewals.
NXRT June Presentation
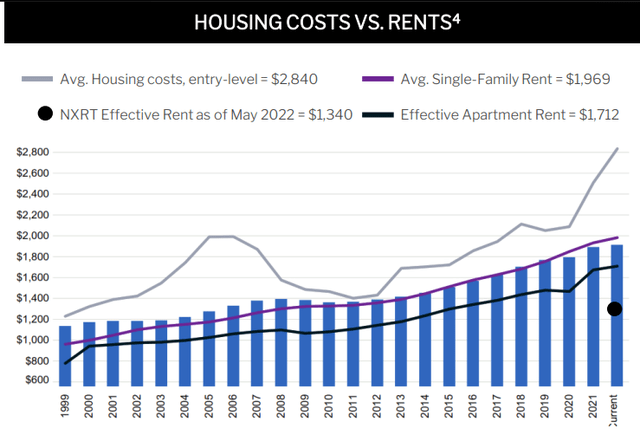
On the surface, you might think that this can’t be making renters very happy, and you’d be right. Housing costs are one of the biggest expenses for renters, and few of them enjoyed an increase of at least 17% in their income in the last year.
But also keep in mind that NXRT’s units remain some of the most affordable options for renters in their specific markets.
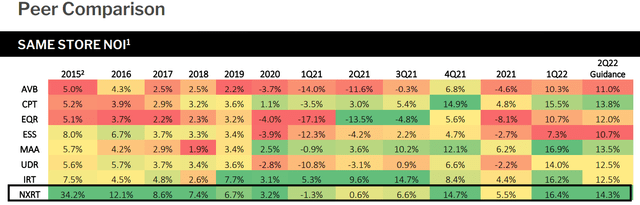
This is partly how NXRT has the room to raise rents at a faster rate than peers. See, for instance, NXRT’s same-store NOI growth over time compared to its peer group:
NXRT June Presentation
This chart is from a June presentation, though, and NXRT actually raised its guidance in the Q2 earnings report. For the full year of 2022, NXRT now forecasts SSNOI growth to fall in the range of 14.7% to 17% with a midpoint of 15.8%.
Along with impressive growth in SSNOI and AFFO per share, NXRT also has a strong track record of double-digit dividend growth. Most recently, dividends have increased by 11.8% YoY in both Q2 and 1H 2022. It’s like clockwork.
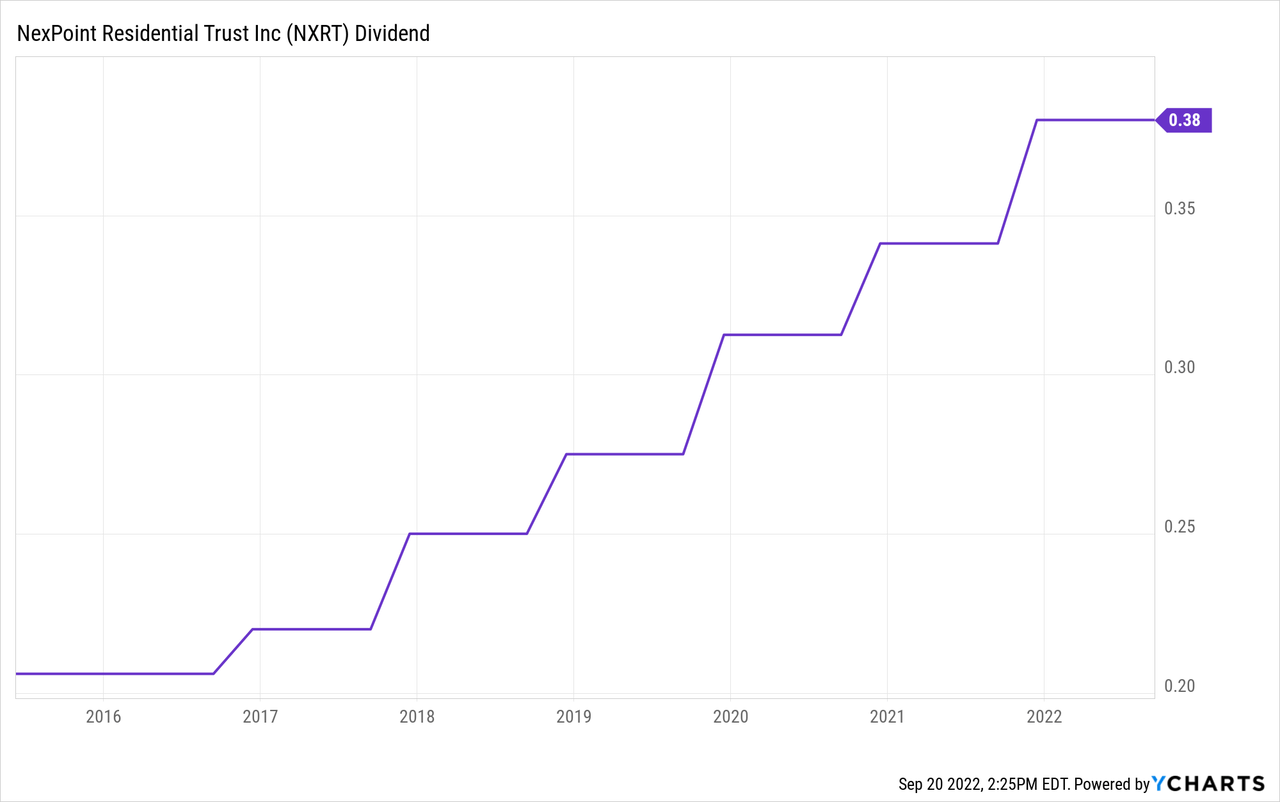
In the first half of 2022, NXRT’s AFFO payout ratio came to an ultra-low 43.2%. That gives the REIT’s payout a nice buffer to face even the worst-case scenario.
Speaking of the worst-case scenario, let’s take a peek under the hood of the balance sheet.
About All That Floating Rate Debt…
When it comes to the balance sheet, it becomes clear that NXRT is not financially managed the same as most multifamily REITs. That is not necessarily to say that NXRT has worse financial management. From what I can tell, management has done quite a fine job of arranging the balance sheet for maximal growth. But they do carry a much larger debt load than other multifamily REITs.
For instance, while most multifamily REITs have net debt to enterprise values of roughly 20-25%, NXRT’s was 51% in Q2.
And whereas most multifamily REITs have total debt to EBITDA ratios of around 4-5x, NXRT’s is a whopping 9.8x (based on TTM EBITDA).
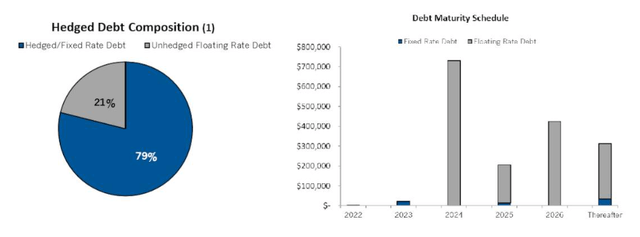
What’s more, the vast majority of NXRT’s mortgages feature floating rates. And, of course, the credit facility, on which NXRT has $335 million drawn, also has a floating interest rate of SOFR plus 1.69%.
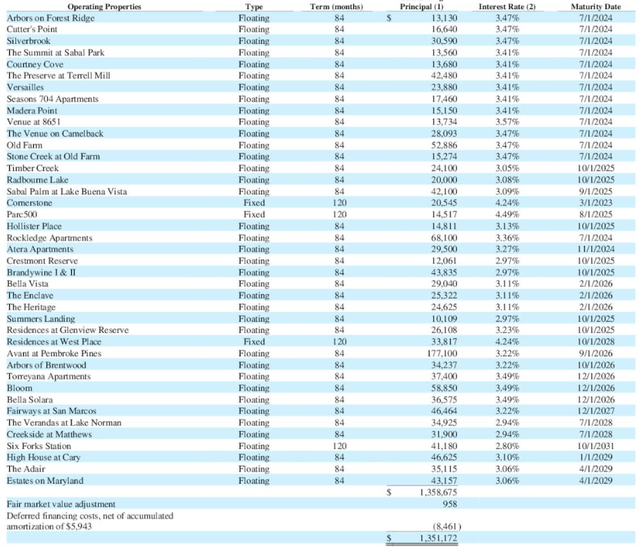
NXRT Q2 Presentation
On the surface, this would seem to explain NXRT’s abysmal performance this year. But this does not take into account the well-timed interest rate swaps management has put in place over the last few years to hedge rising rates and fix NXRT’s rates well into the future.
NXRT has 11 interest rate swap agreements in place with termination dates ranging from June 2024 to January 2027. These interest rate swaps collectively give $1.27 billion of NXRT’s $1.35 billion in total mortgage debt a weighted average fixed interest rate of 1.125%.
NXRT Q2 Presentation
Of course, as these interest rate hedges begin to expire in 2024, effective interest rates will almost certainly go up. But the point is that NXRT is in no immediate danger of a huge spike in interest expenses. Management has time (almost two years) to figure out how to tackle those expiring hedge agreements.
Besides, a lot can happen in the economy in two years. (Just think back to the Fall of 2020, before effective COVID vaccines were announced!) Macroeconomic forces could push interest rates back down by then. That is obviously the hope for such a heavily indebted company, especially after the share price has collapsed and eliminated the possibility of issuing equity near NAV to replace maturing debt.
Don’t get me wrong, NXRT’s heavy debt load does create risk. If interest rates remain around their current level in two years, or rise even higher, the REIT will begin to feel a major pinch.
But, again, a lot can happen in two years. NXRT bears have seemingly counted their “risk chickens” before they’ve hatched. (Did that metaphor make sense?)
Bottom Line
If I could rate NXRT as a “Super Strong Buy,” I would.
It’s not that I don’t see the risks. I do. But the potential rewards in a scenario in which interest rates settle back at a modest level, even if rent growth isn’t as robust, are simply enormous.
Of course, in a bearish scenario wherein secular inflationary trends remain in place, forcing interest rates higher and higher, there would probably still be more downside for NXRT.
But in a muddle-through scenario, where interest rates remain pretty much rangebound from here, I think NXRT will still produce total returns of around 10-12%.
In a moderately good scenario, wherein interest rates come down a few hundred basis points from here, I would assume NXRT should be able to turn in total returns of 15-20%.
And, finally, in an ideal scenario wherein interest rates drop back to very low levels, I think NXRT could generate total returns of 25-35% annually from here.
Be the first to comment