

Justin Sullivan/Getty Images News
Intro
This is my first article about NVIDIA (NASDAQ:NVDA). I readily admit that I do not fully understand the specifics of the company and what investors see hidden in it. Therefore, at this stage, I offer a comprehensive, quantitative analysis of the company’s fundamental value.
Price vs. Results
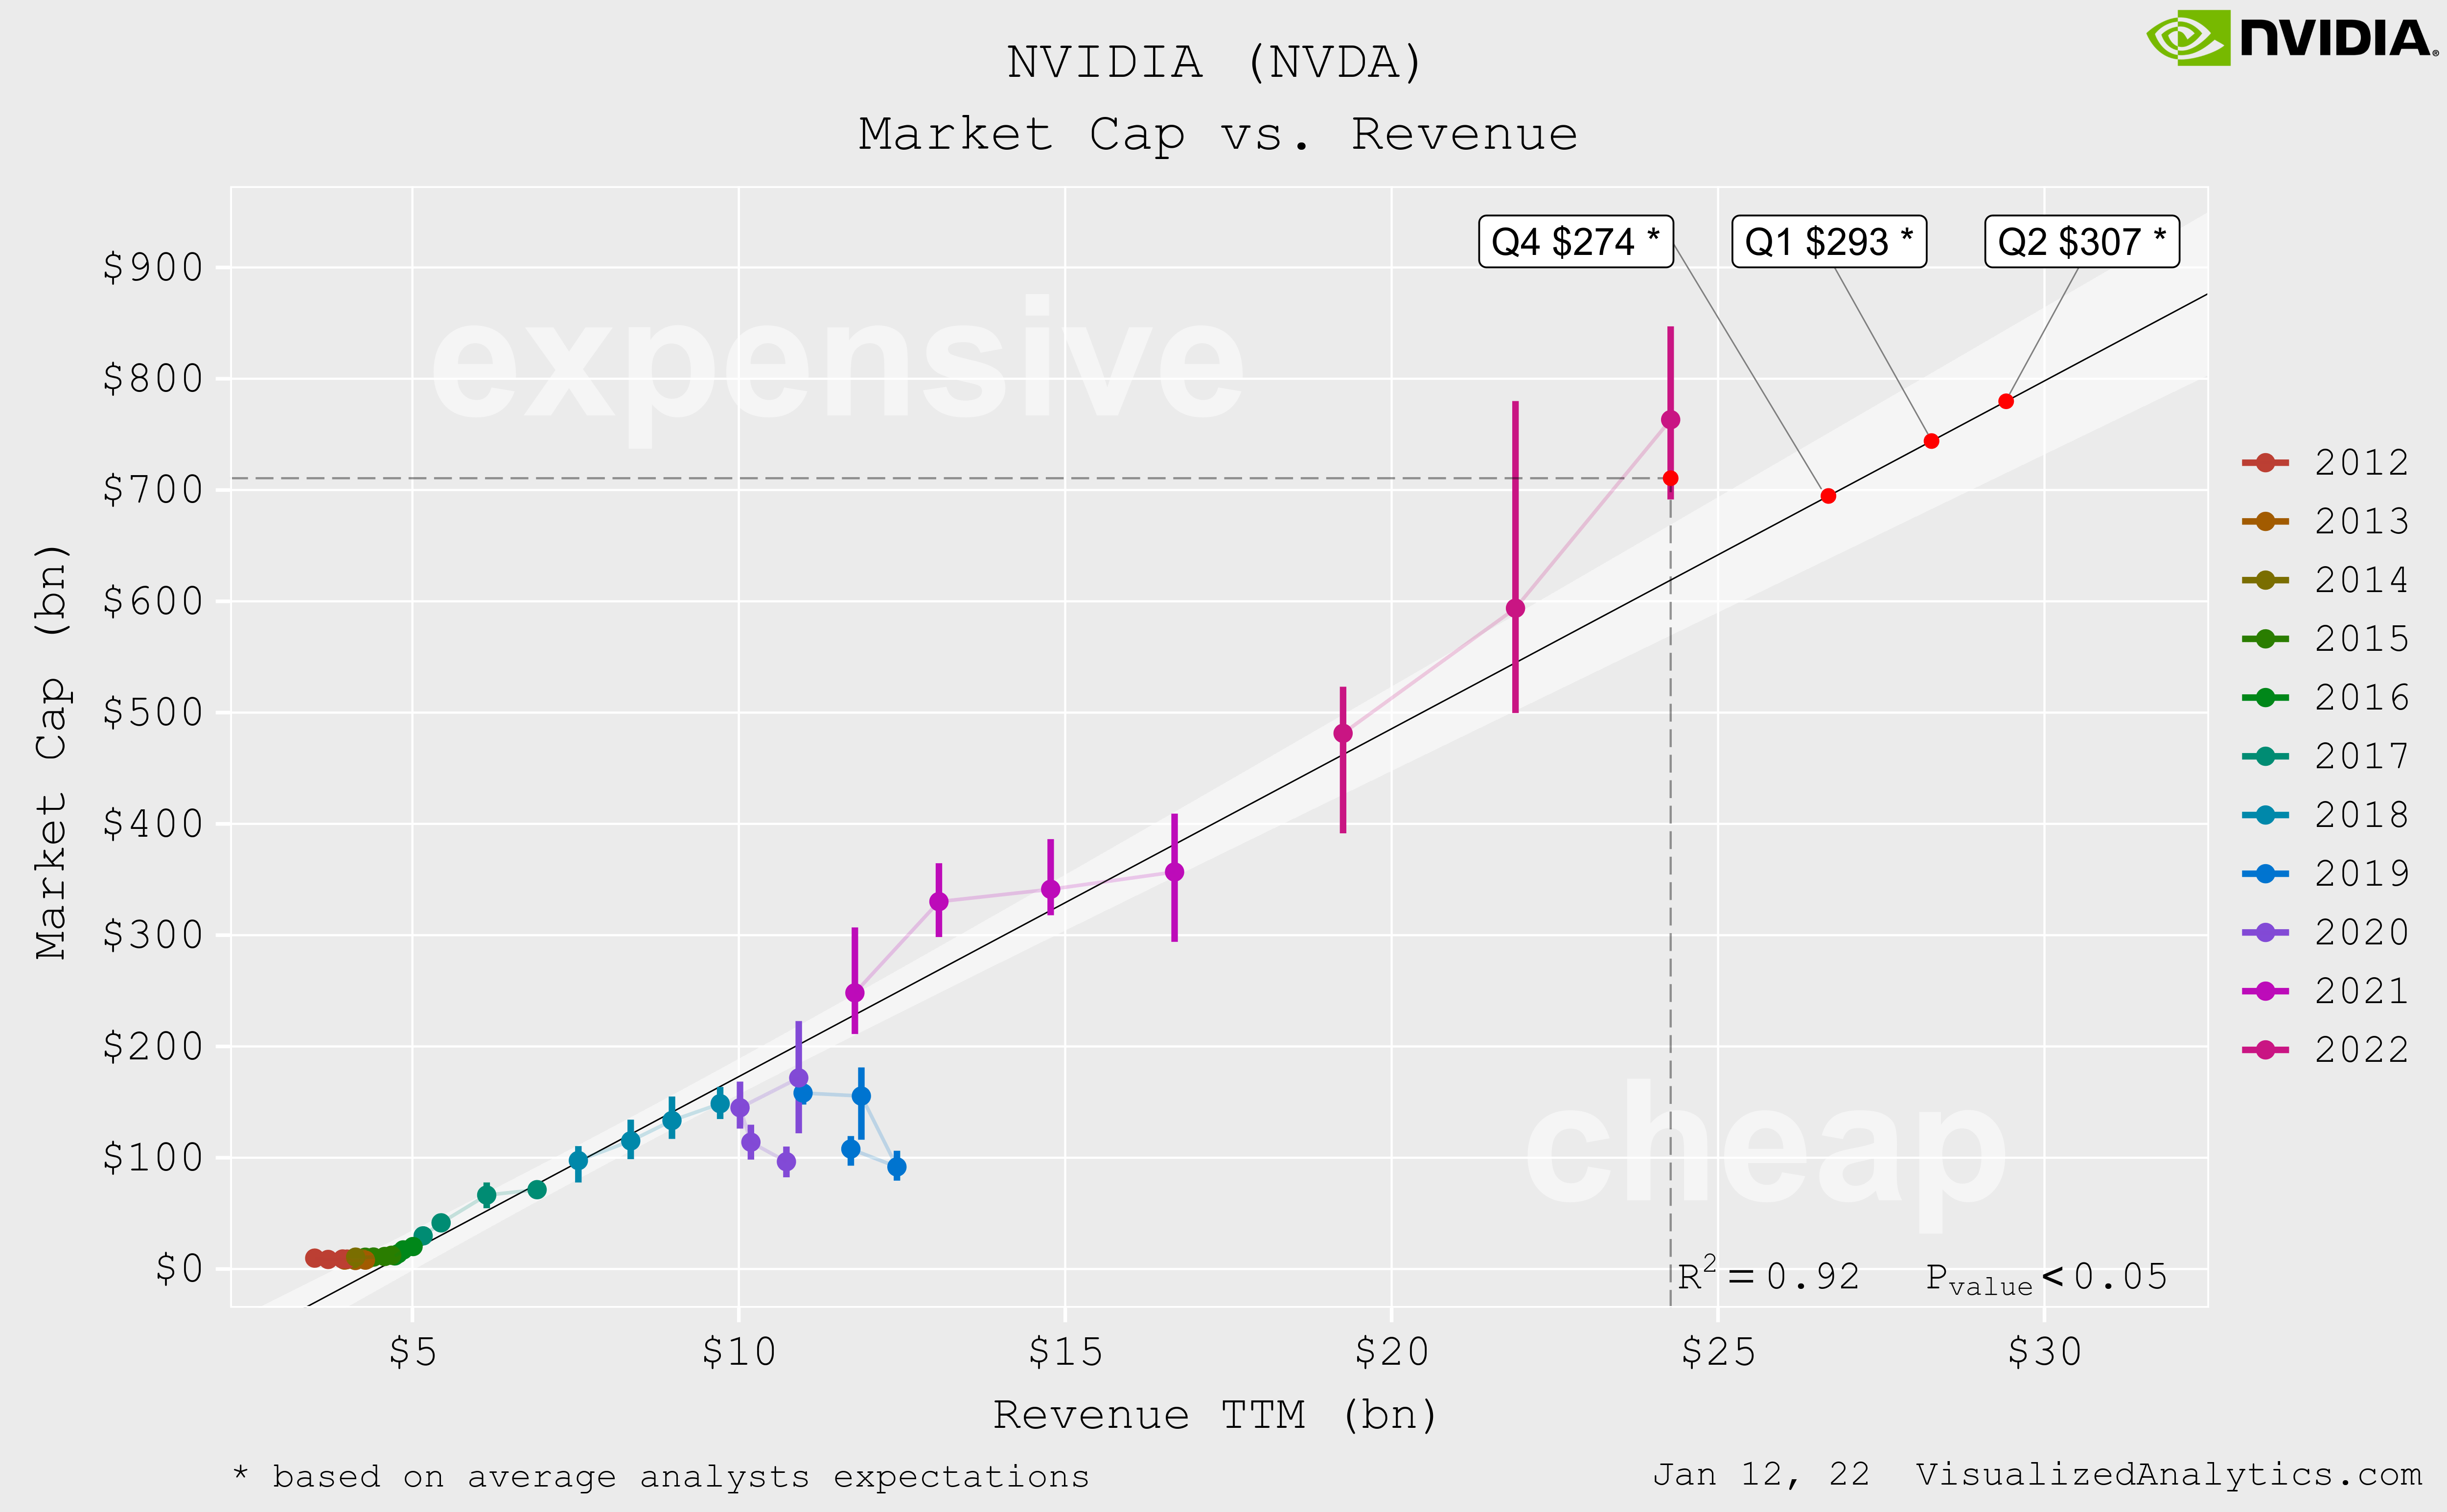
The easiest way to get a first idea of the adequacy of the company’s current price is to look at the dynamics of its capitalization in the context of the dynamics of key results. As a rule, this allows you to identify persistent regressions.
Based on the long-term relationship between the revenue TTM absolute size and the company’s capitalization, NVIDIA’s current price is somewhat overvalued:
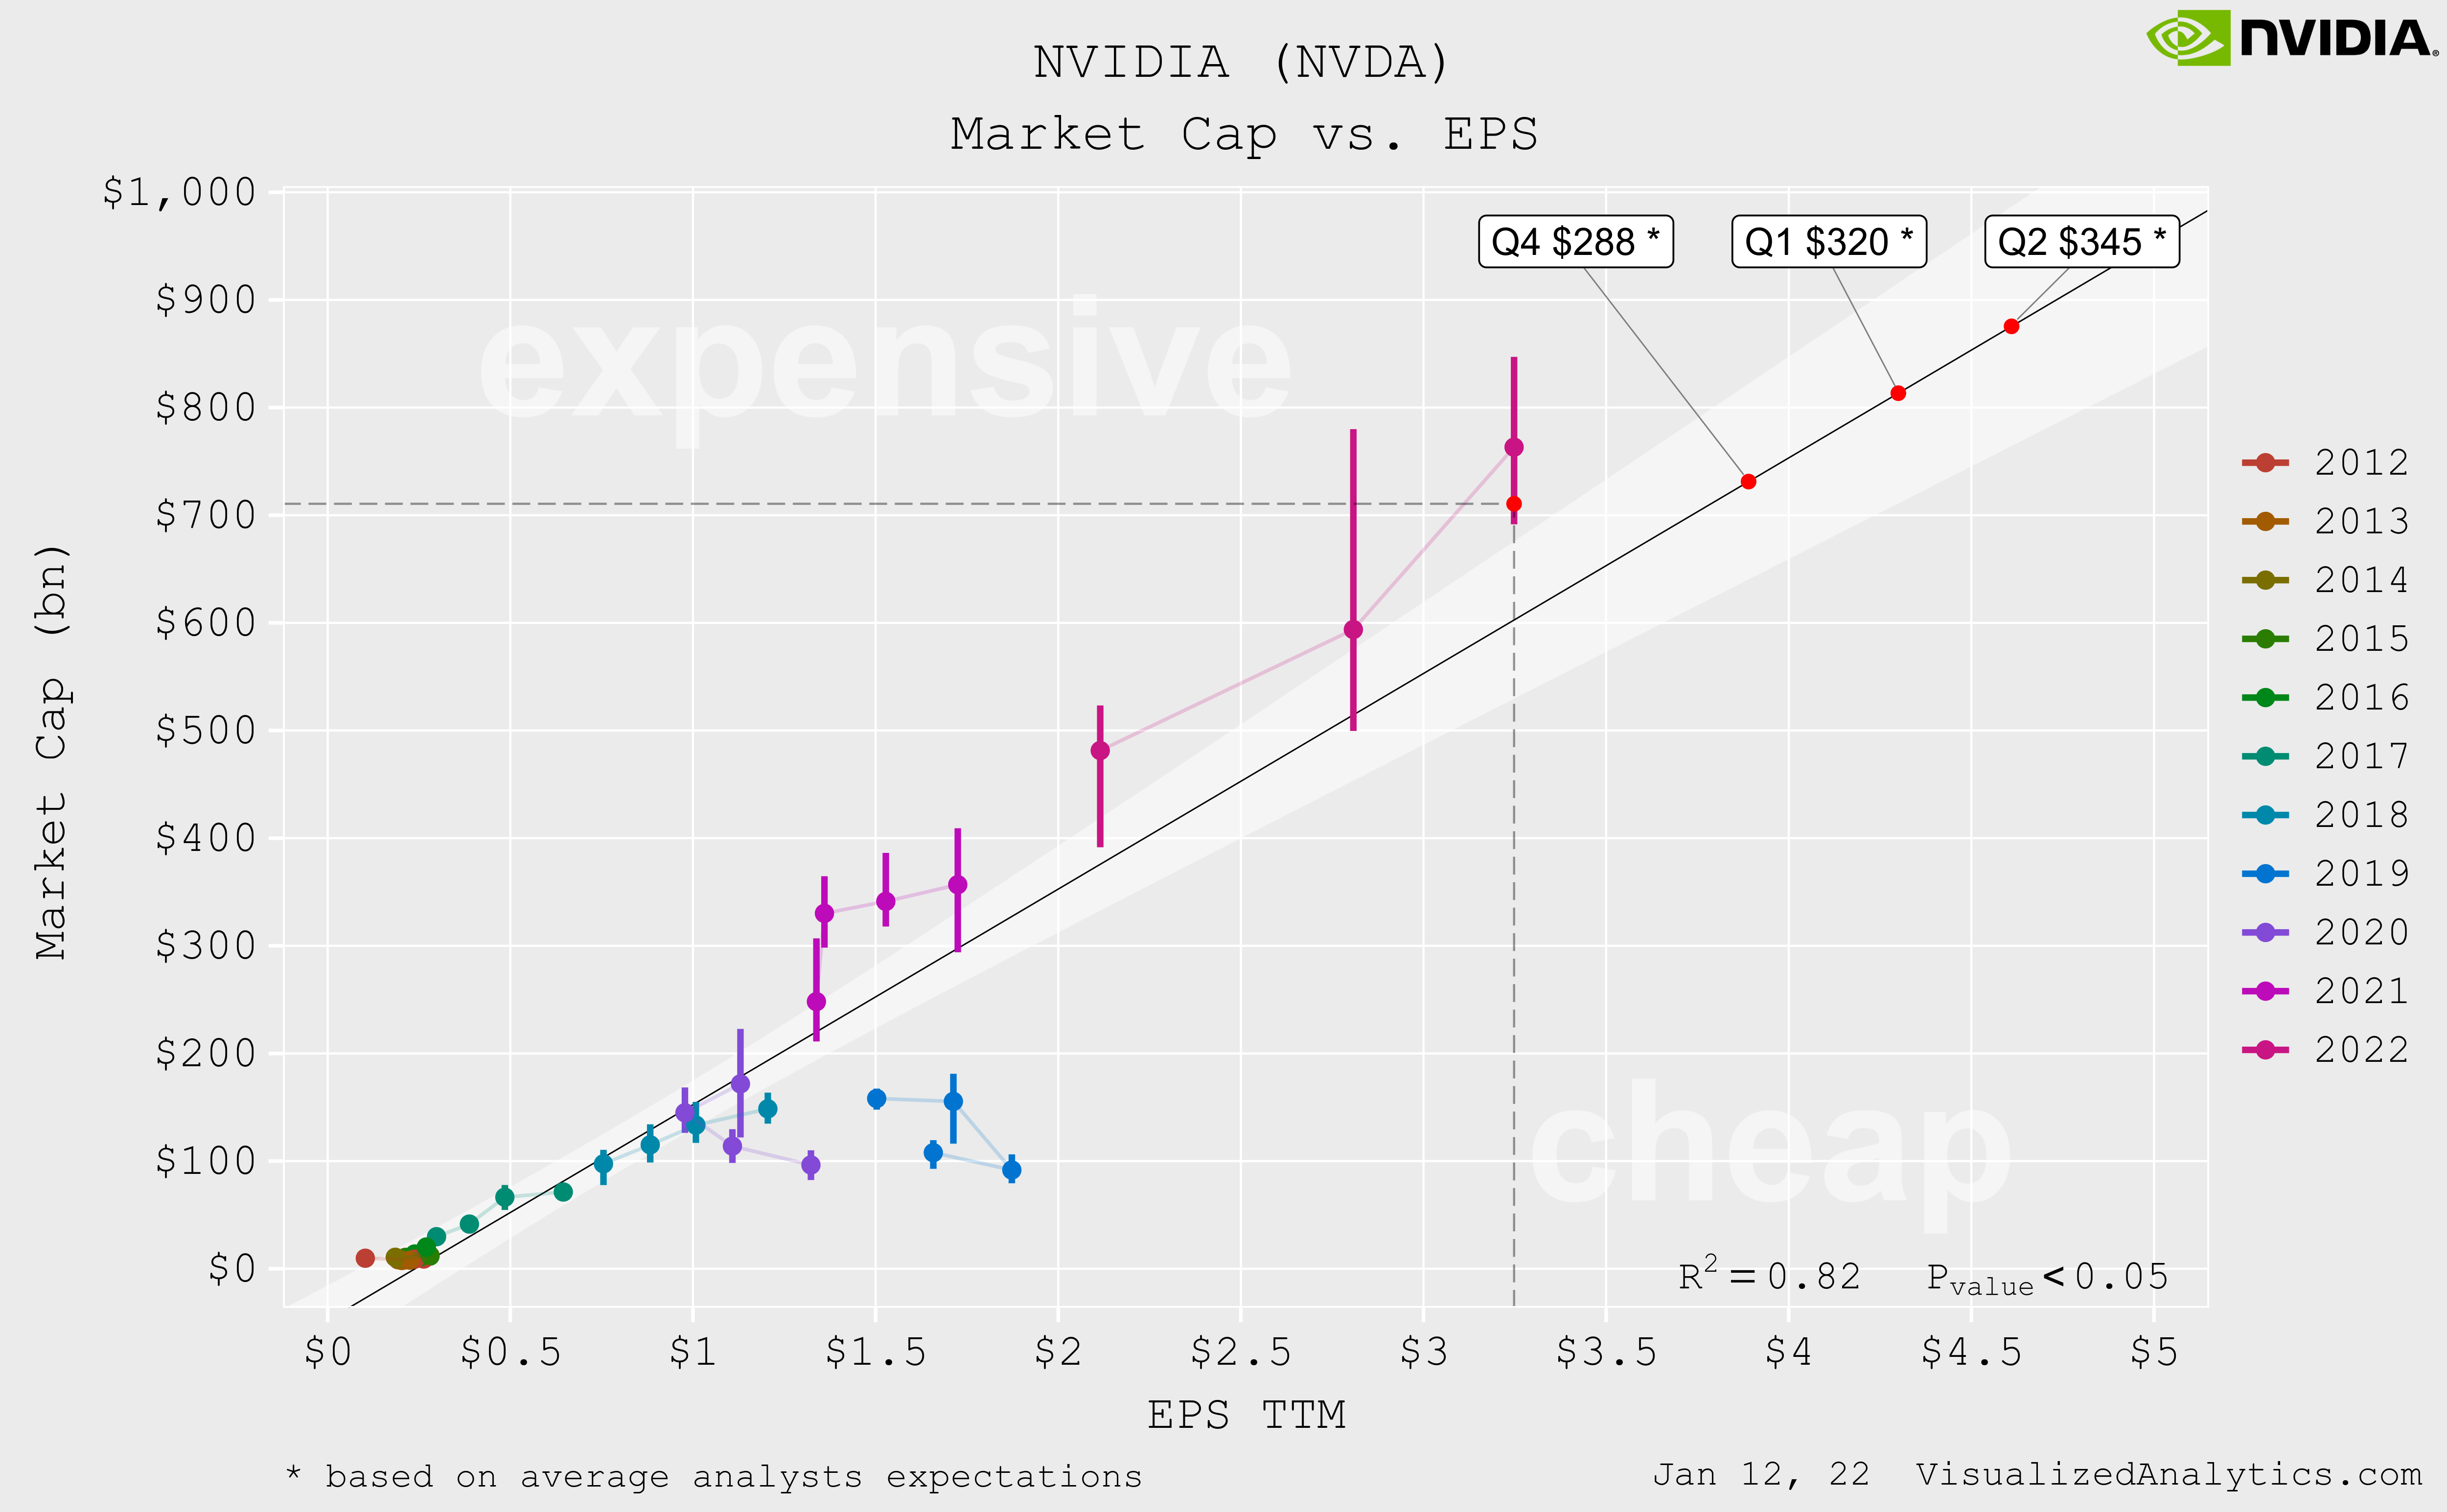
The same is true for the relationship based on the EPS TTM absolute size:
On the other side, over the past seven years, NVIDIA has shown a direct relationship between the rate of revenue growth and its P/S multiple. It should be noted that there is no similar qualitative relationship between EPS and earnings growth rate. In my opinion, this means that the rate of revenue growth is now a key driver of capitalization.
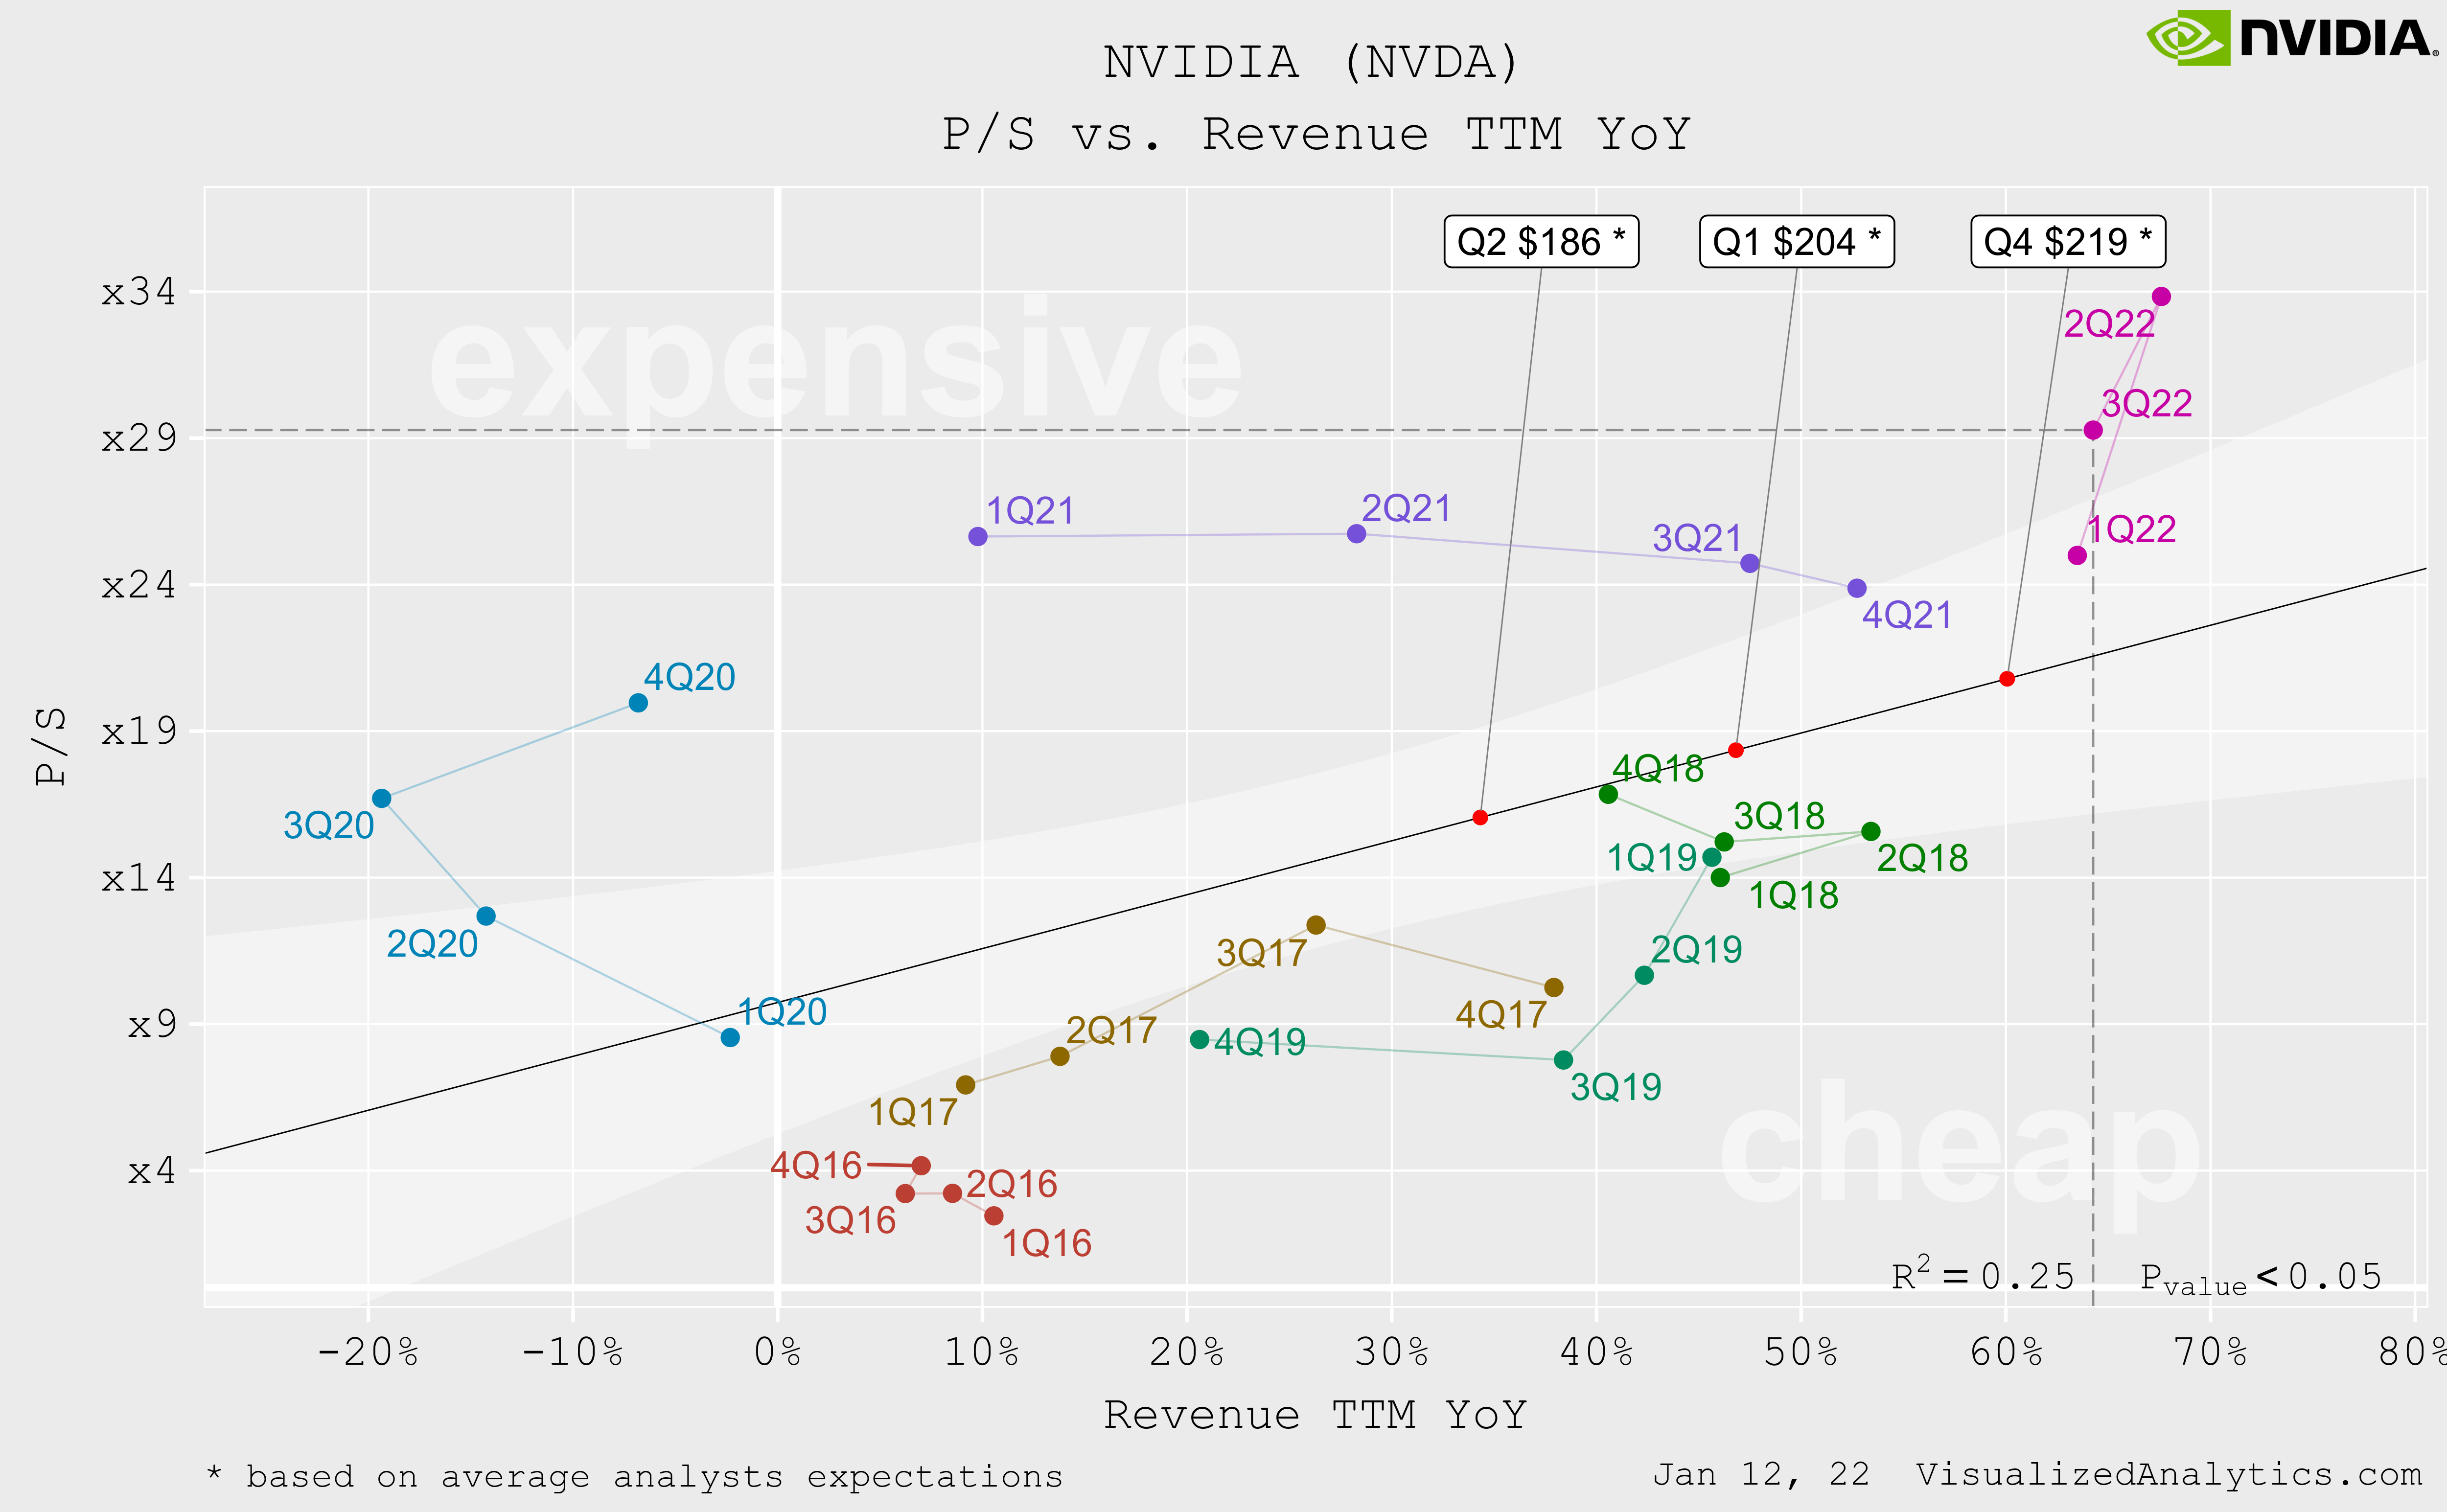
In the context of the last model, the company is now also overvalued. But more importantly, the expectation of a decrease in the revenue growth rate indicates a potential decrease in the P/S multiple in the coming quarters.
So, having determined that revenue is a key driver of company capitalization, we can build a general model that determines the company’s balanced price:

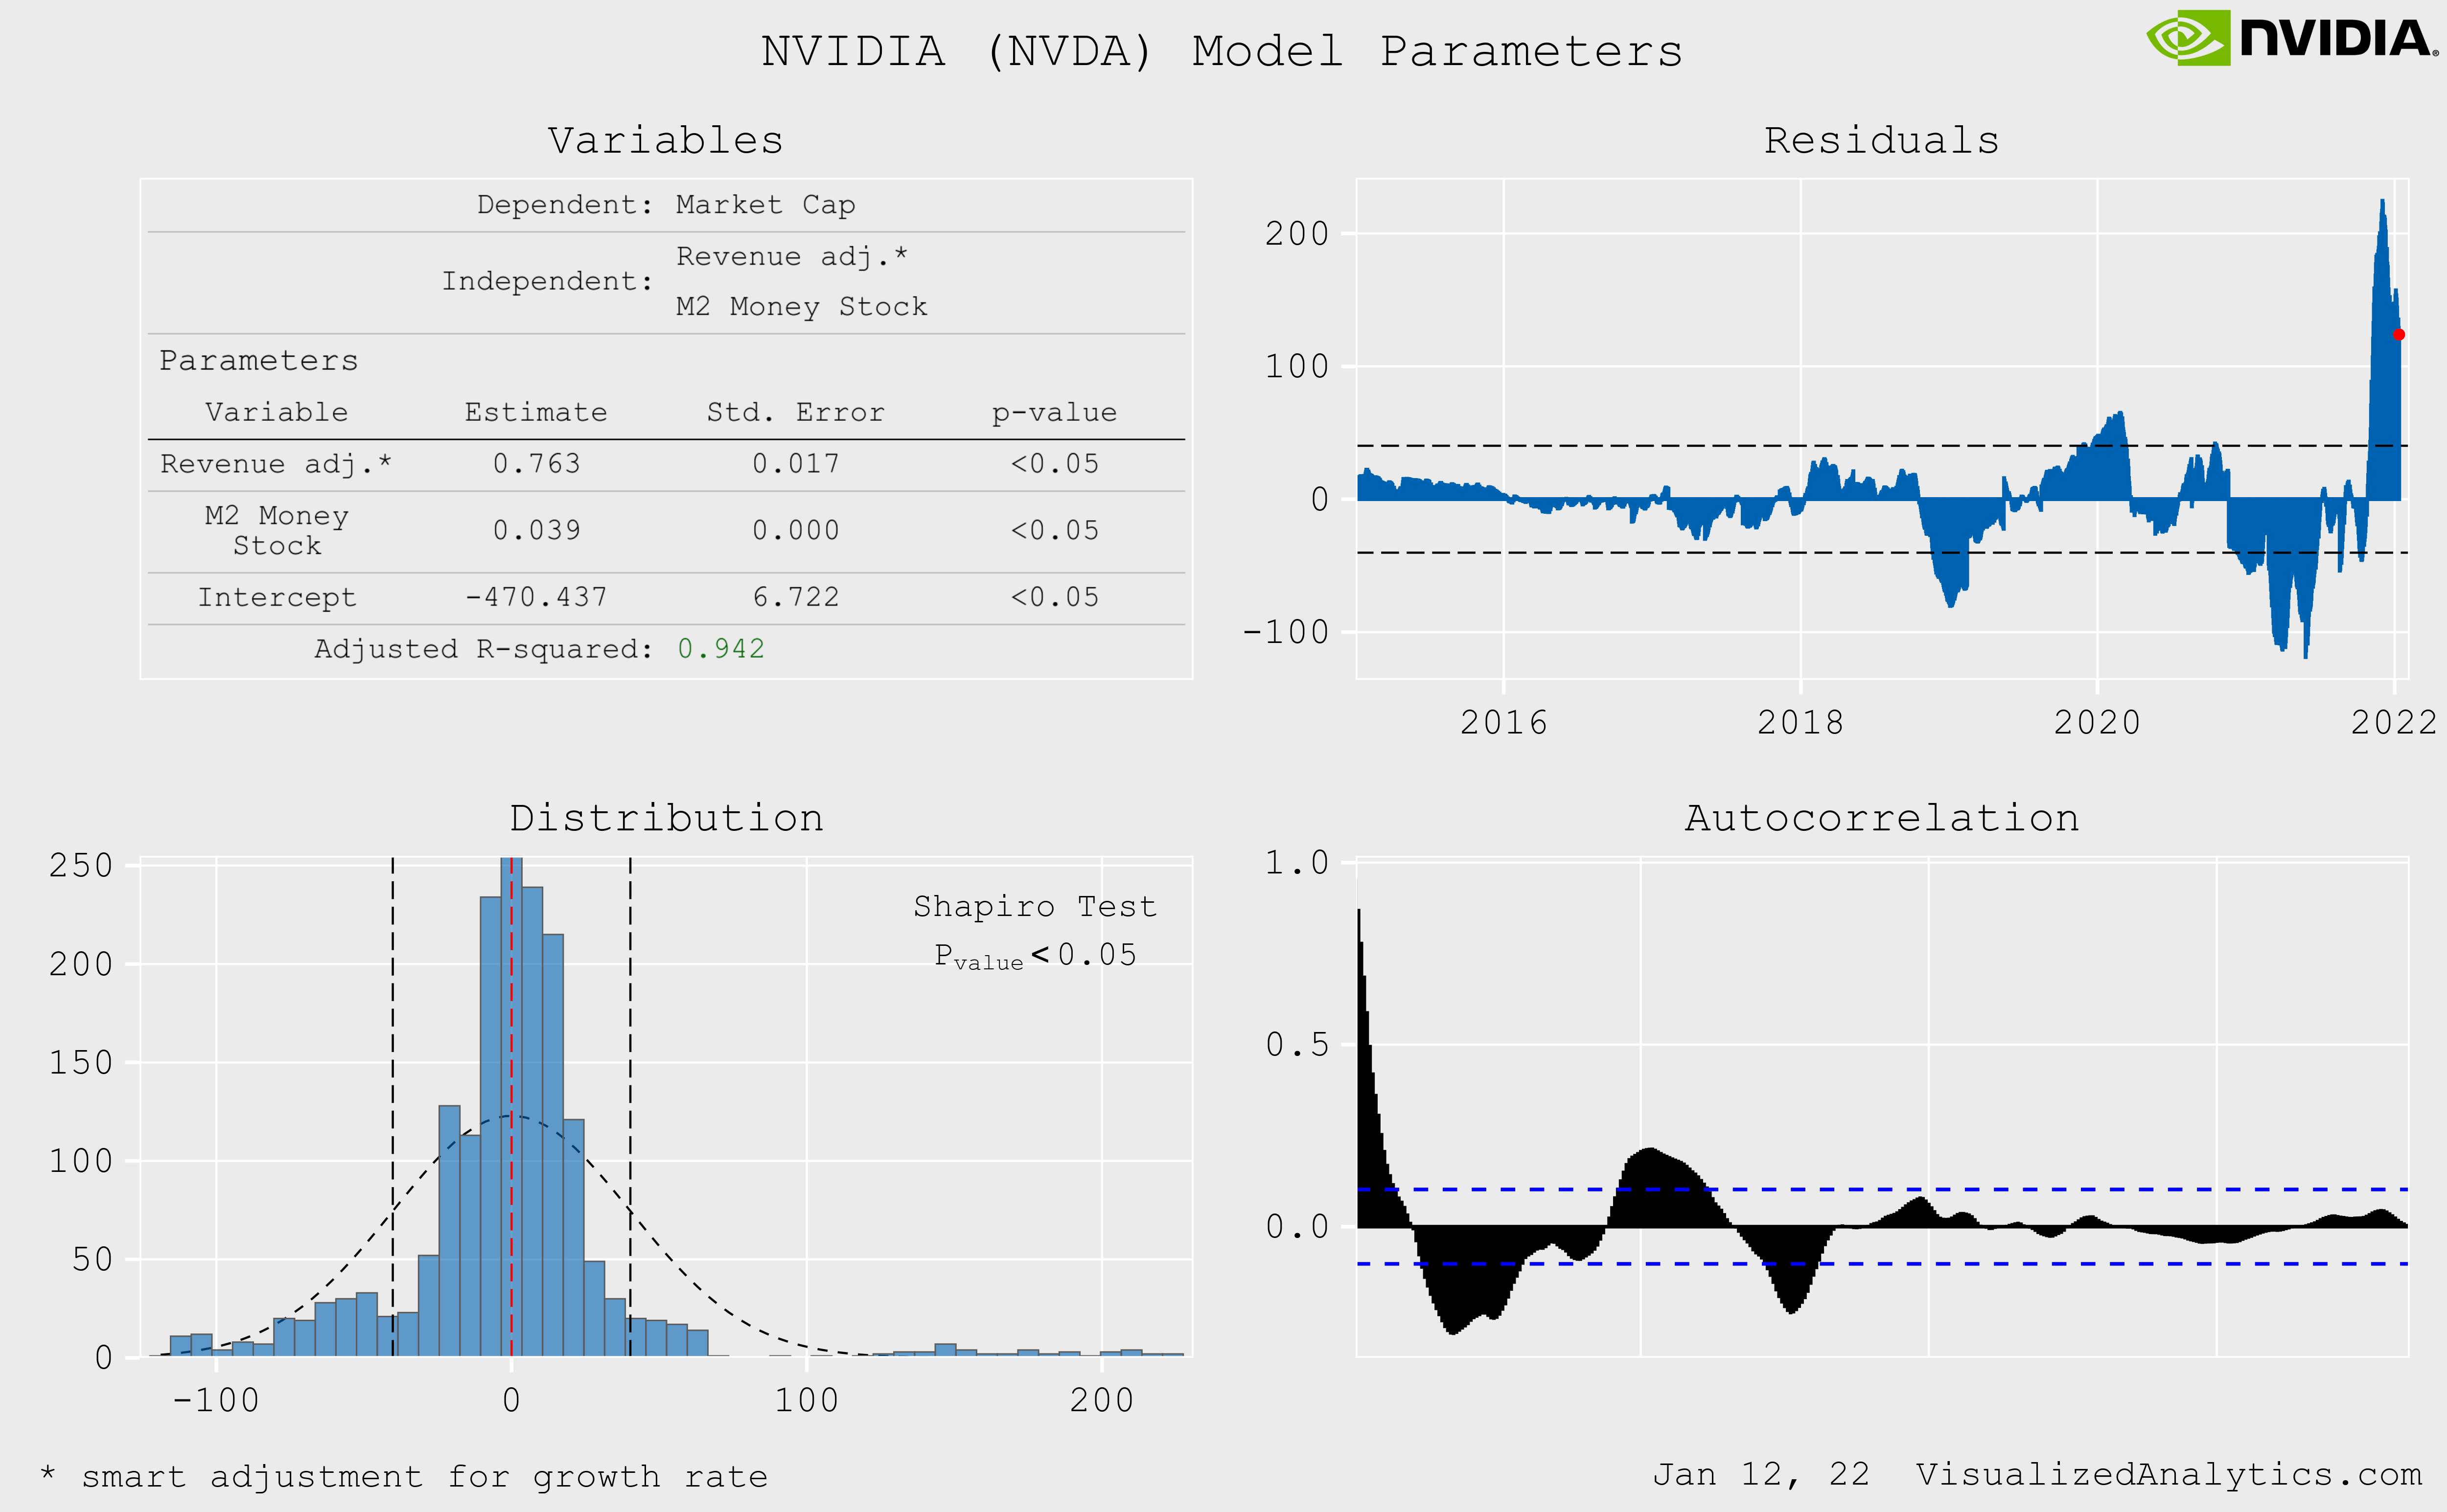
Under this approach, NVIDIA’s modeled capitalization is lower than the actual one within about two standard deviations. And the nearest forecast also does not justify the current price of the company.
Comparative Valuation
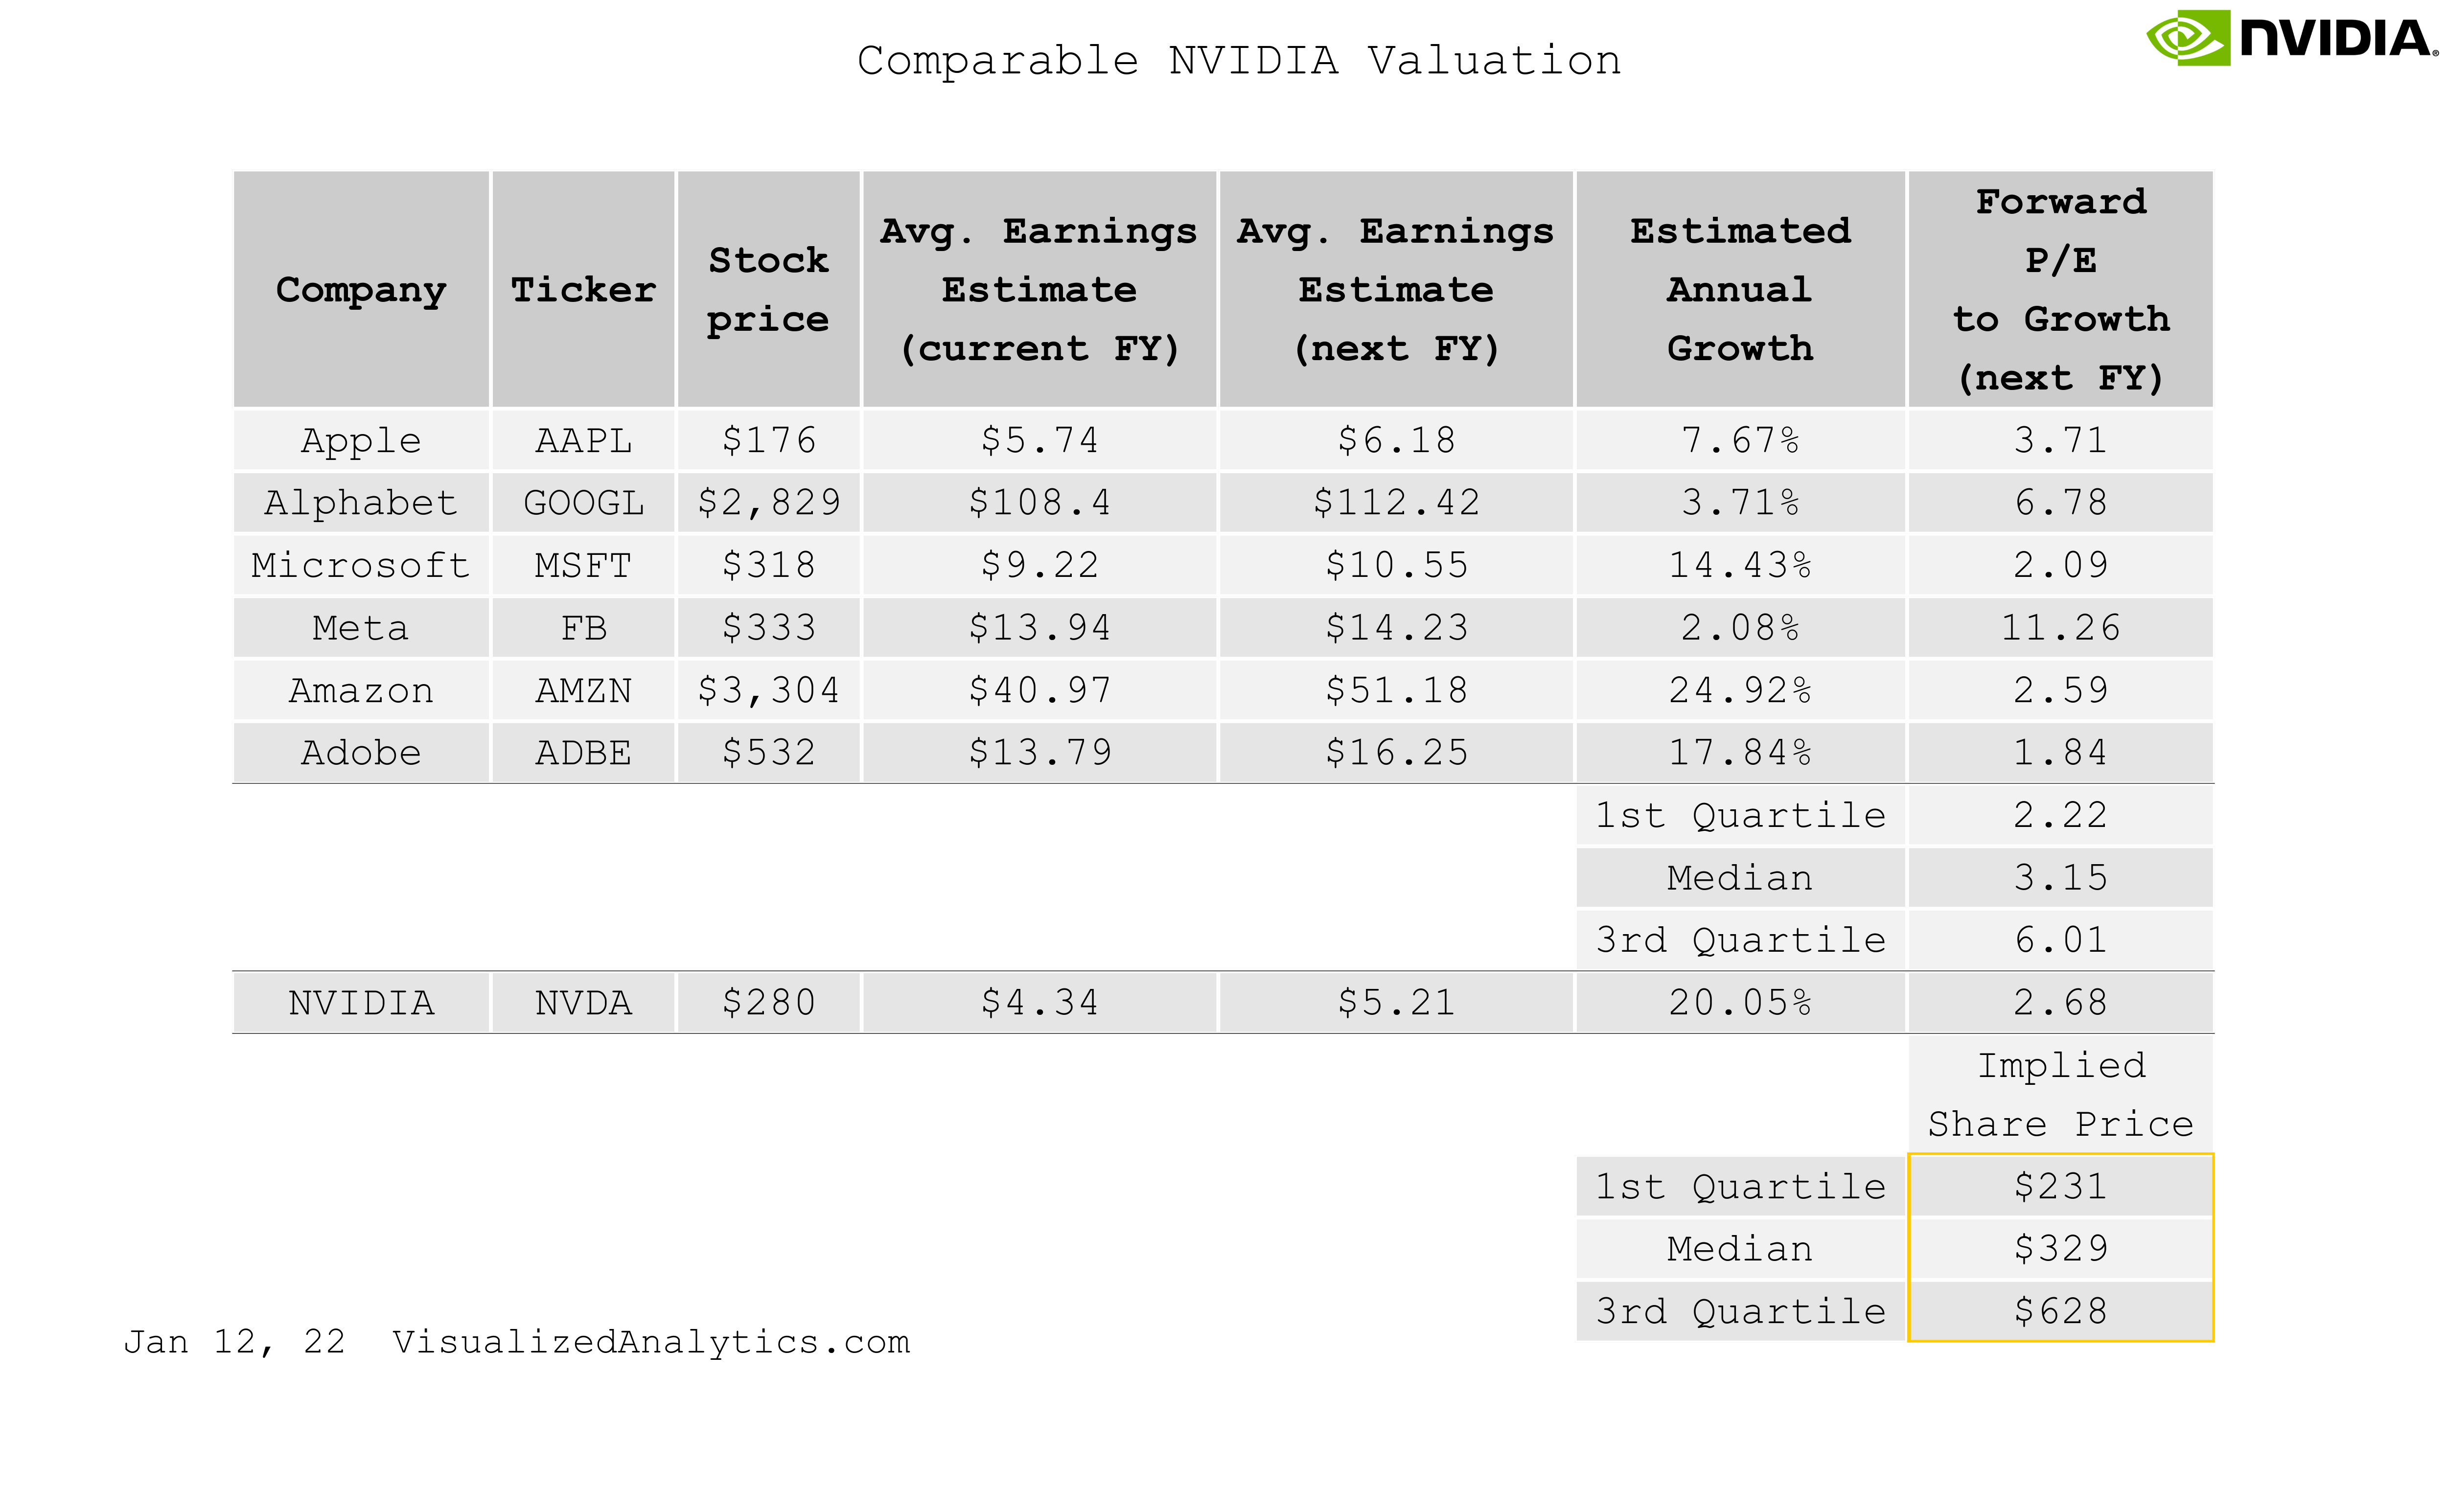
Using elements of machine learning, I analyzed many options for comparative assessment of NVIDIA through multiples. As a result, I found only three models that allow a more or less reasonable judgment of the relative value of the company. To my surprise, all of these models are based on growth-adjusted multiples. This suggests that growth is a determining factor in the level of NVIDIA multiples.
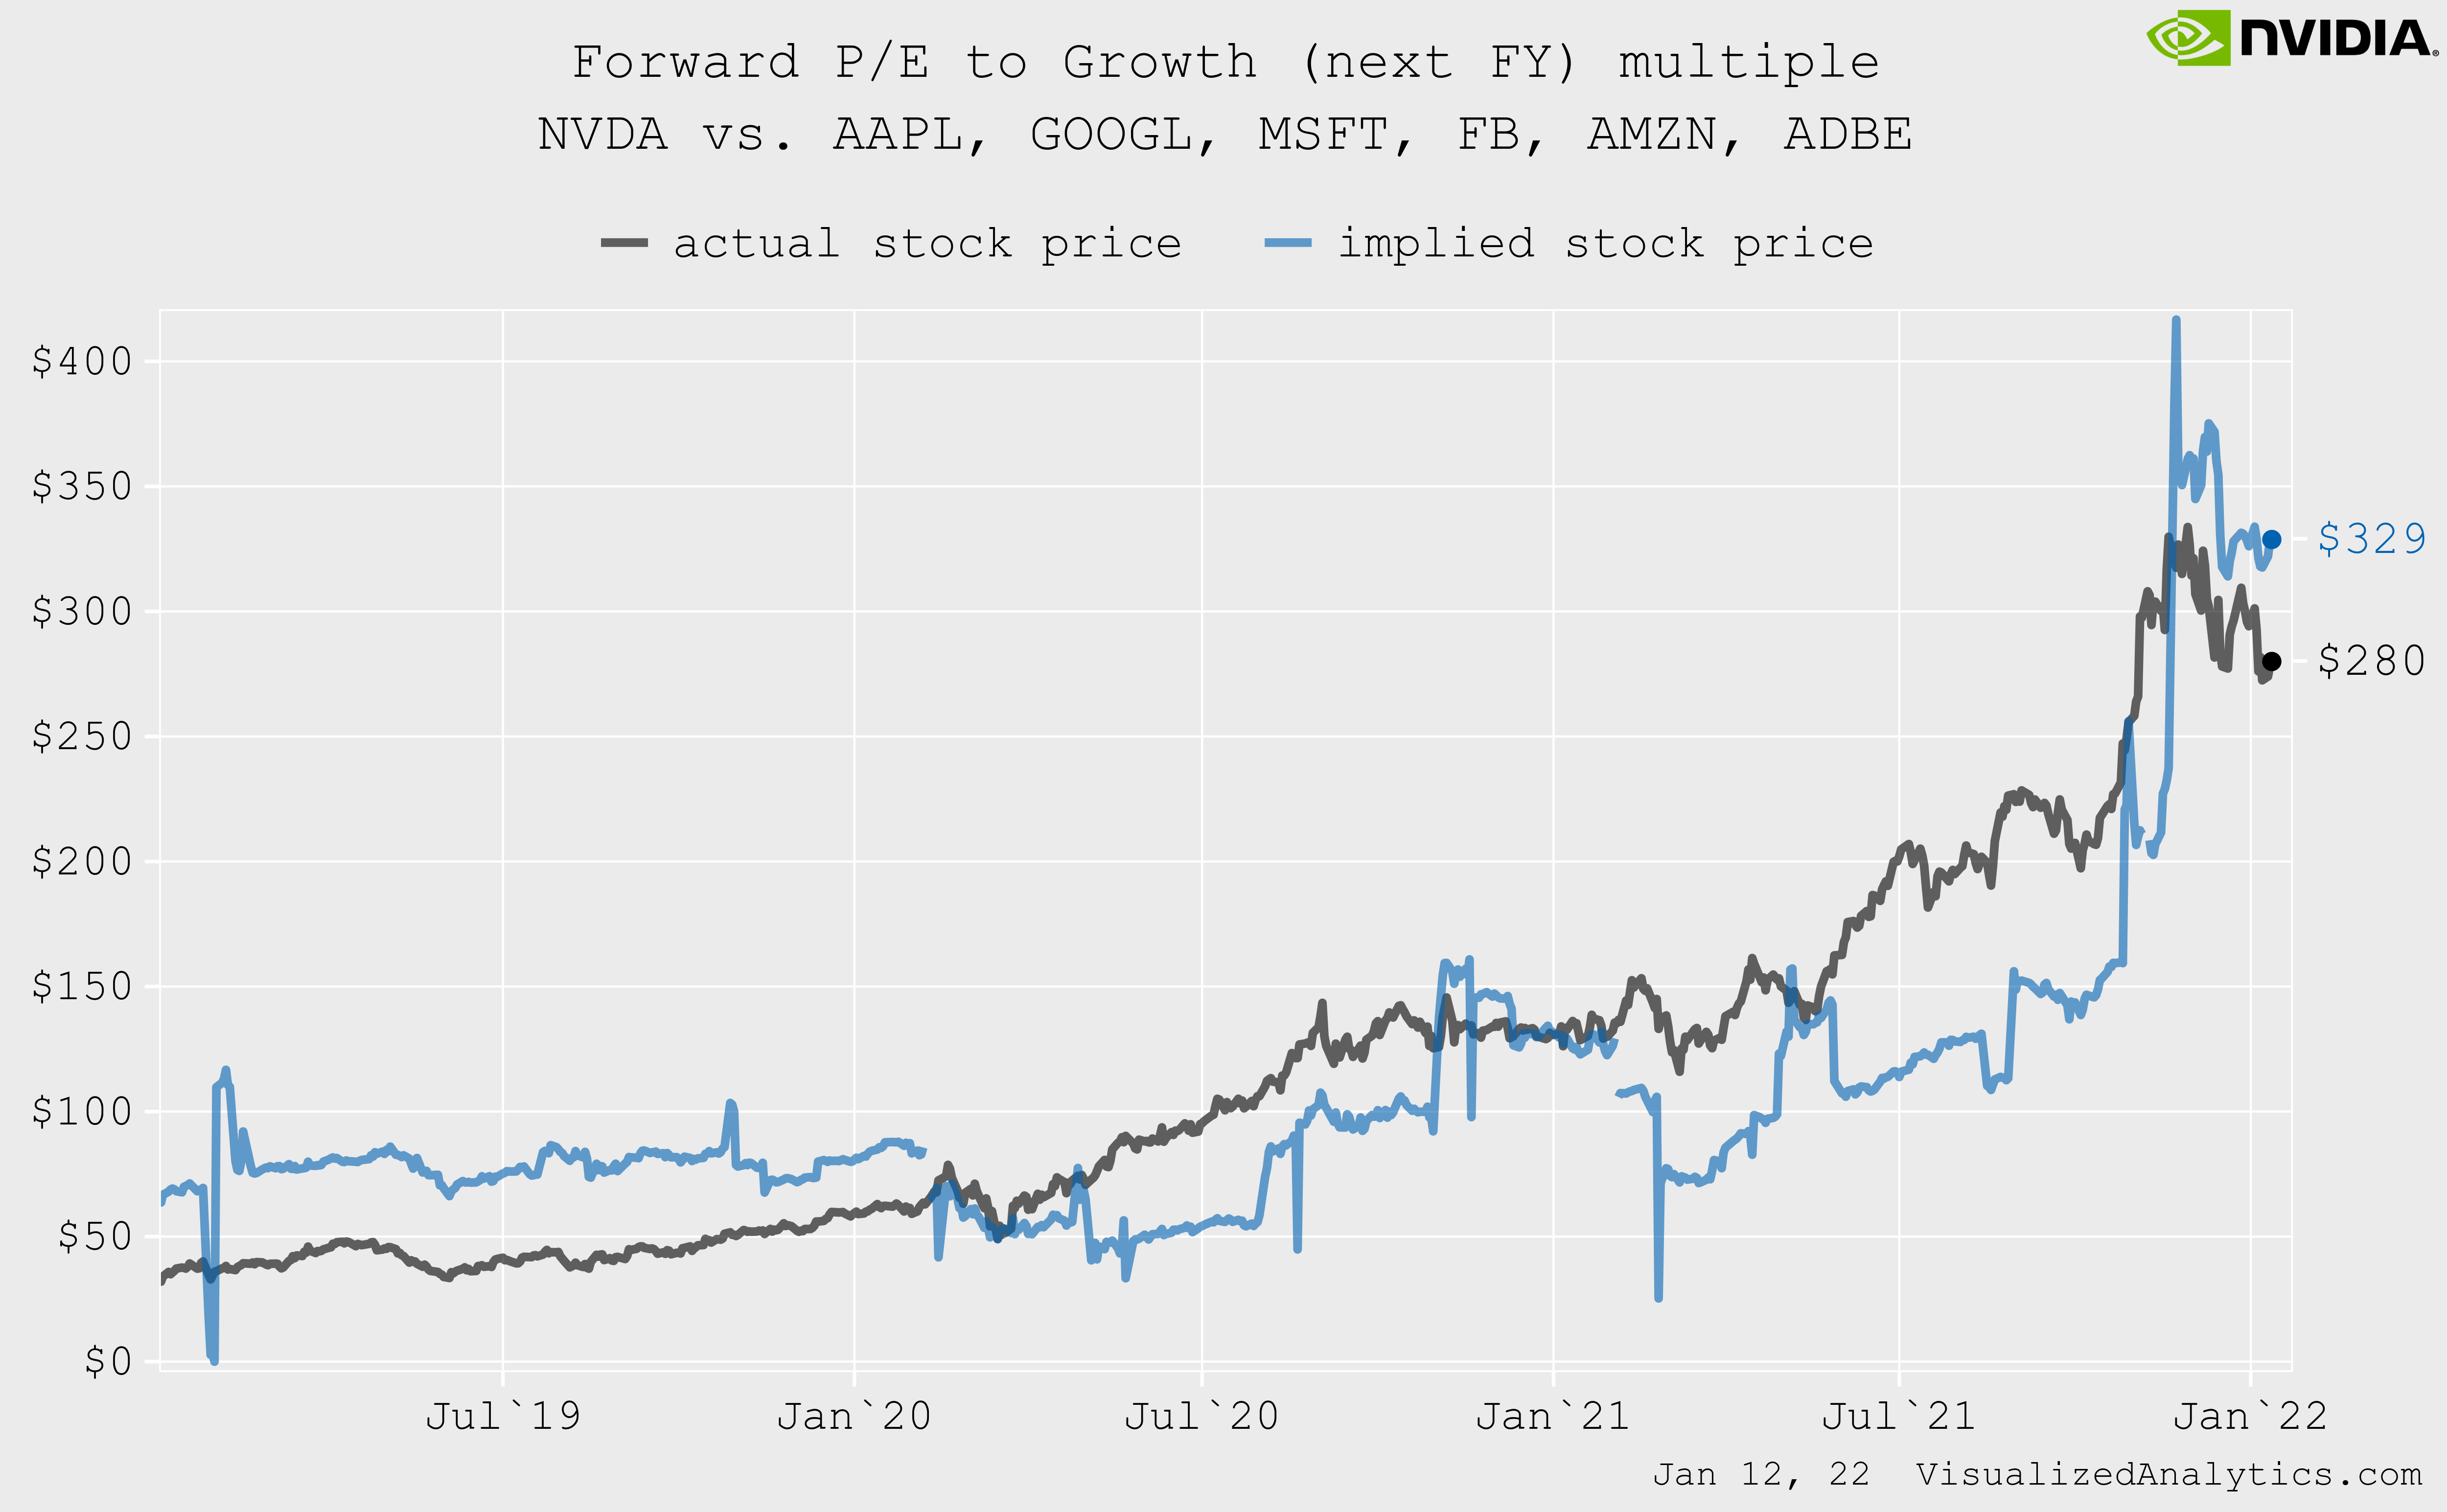
A comparative valuation of NVIDIA through the forward P/E (next FY) to growth multiple indicates that the company is undervalued by 18%. But the quality of this model is not high enough:
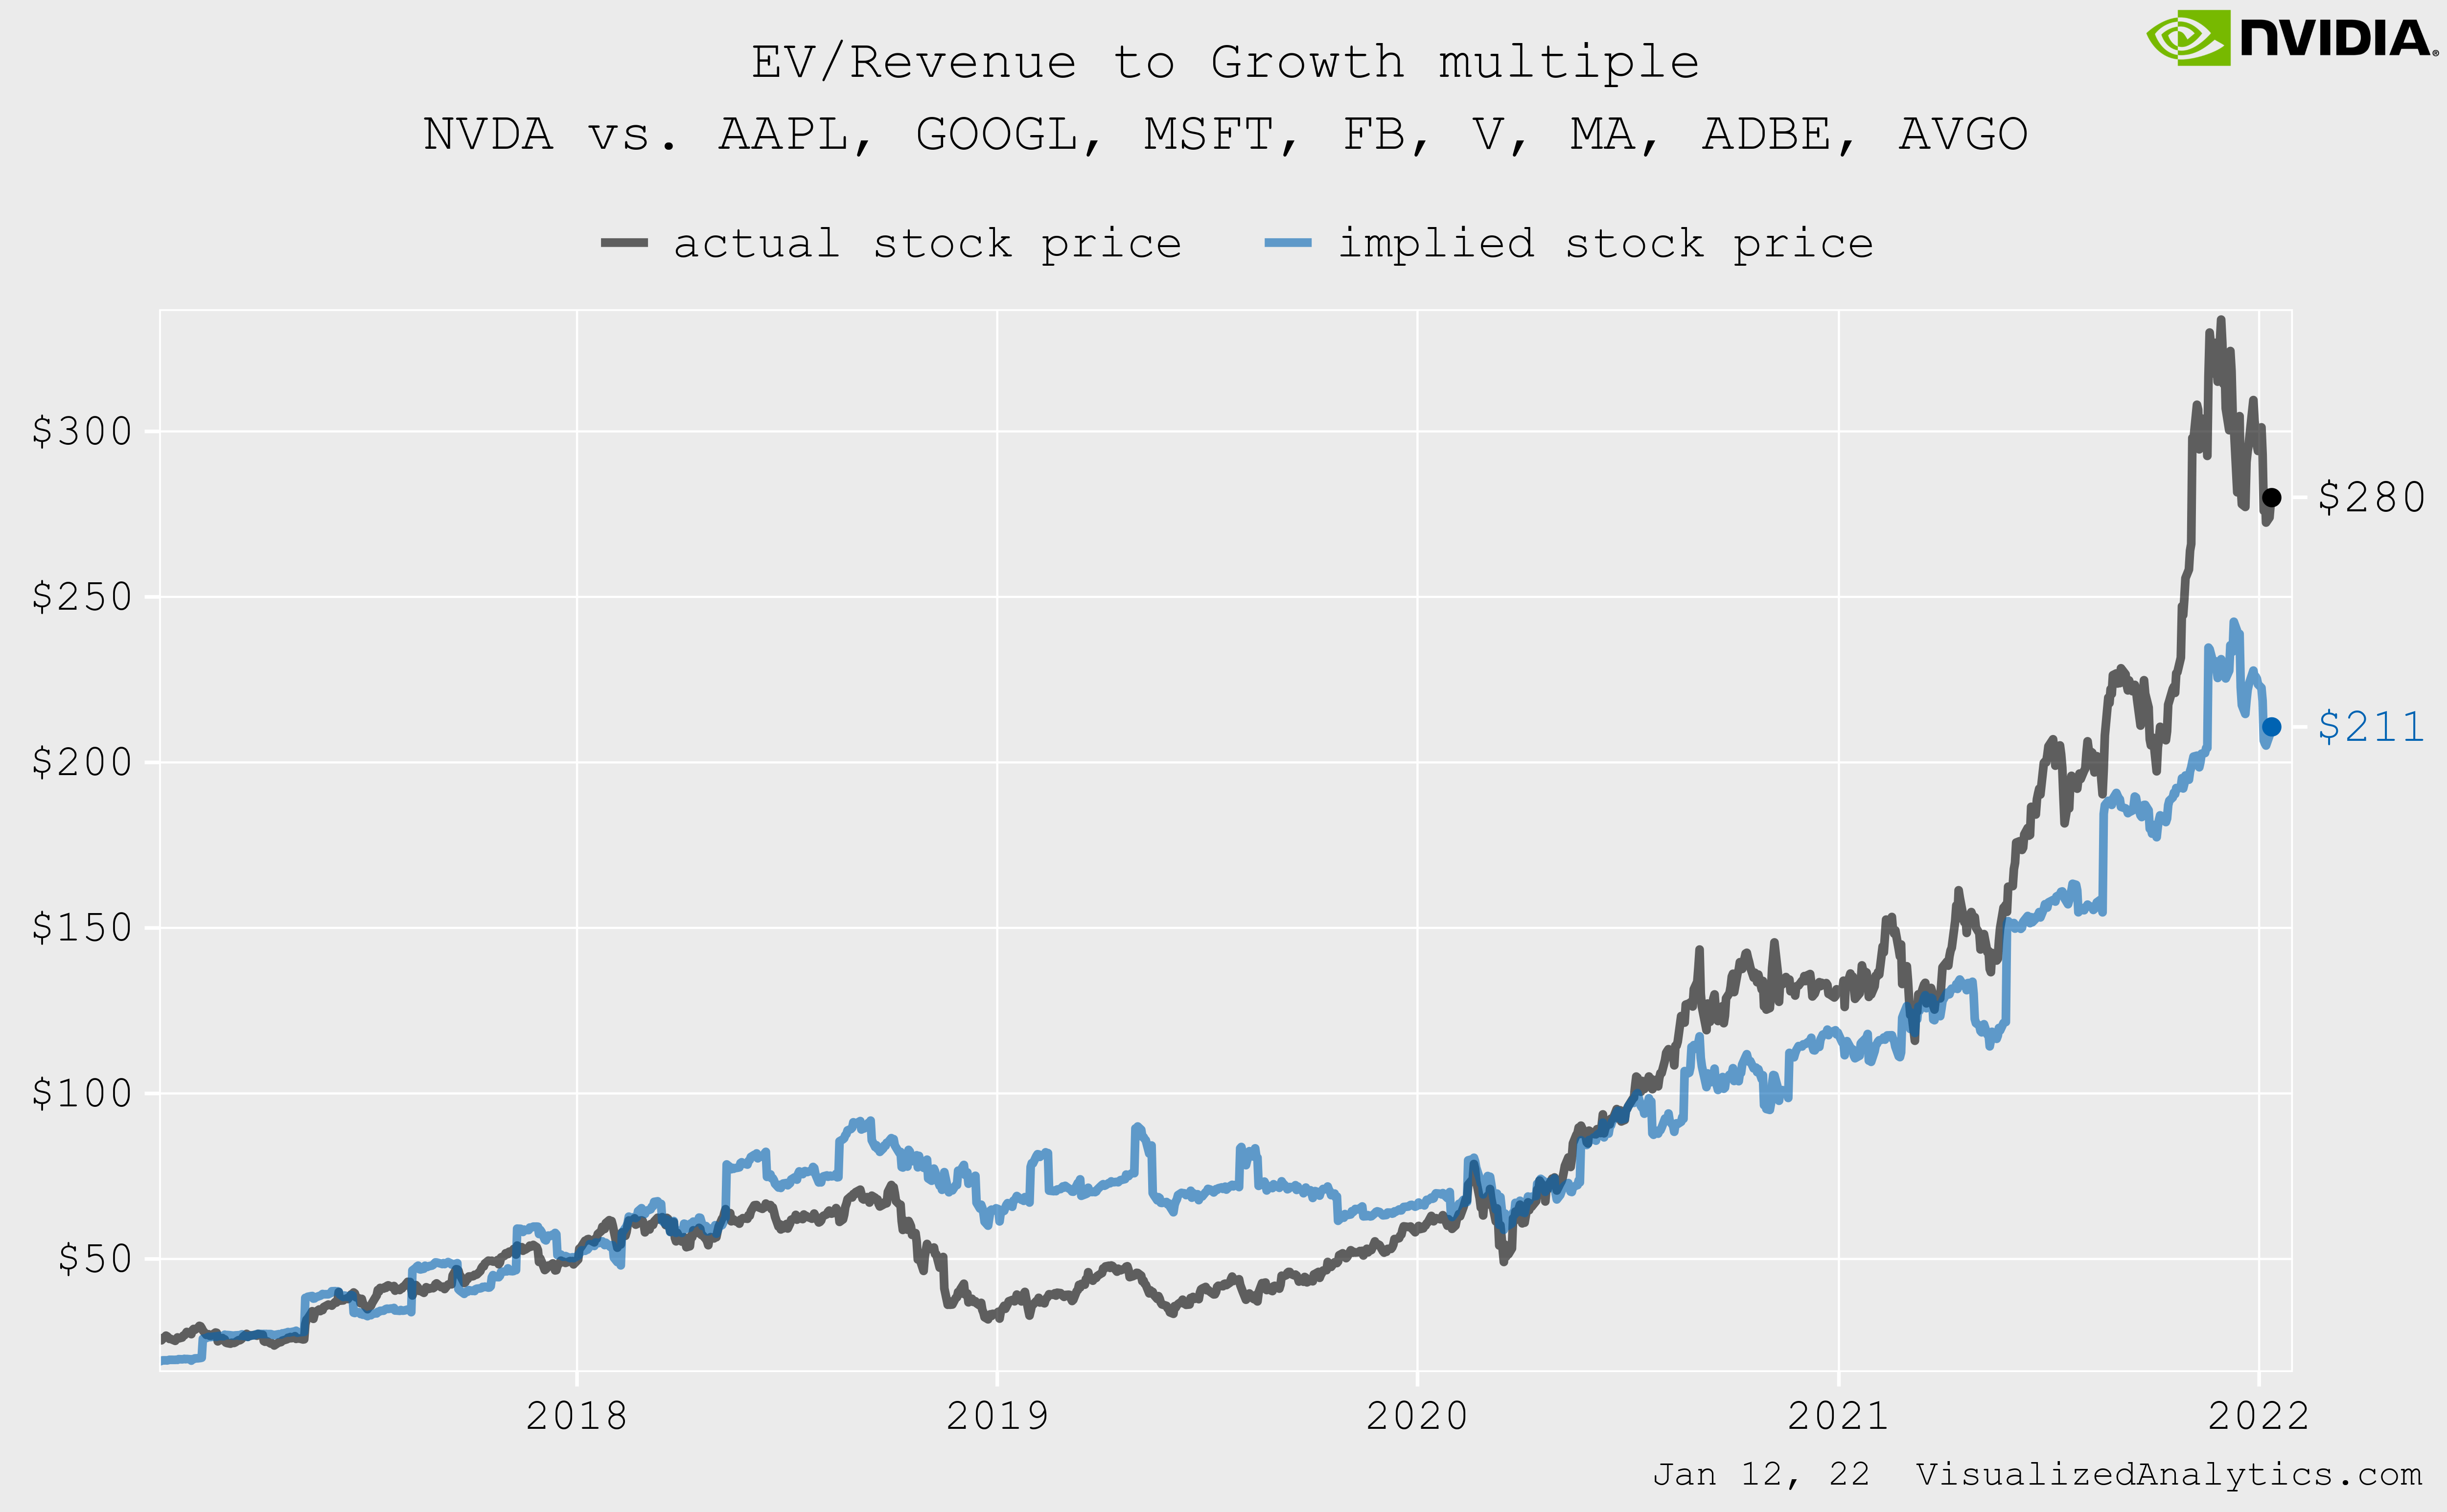
Considering the EV/Revenue to growth multiple, NVIDIA seems expensive:

The same is true for the EV/EBITDA multiple:

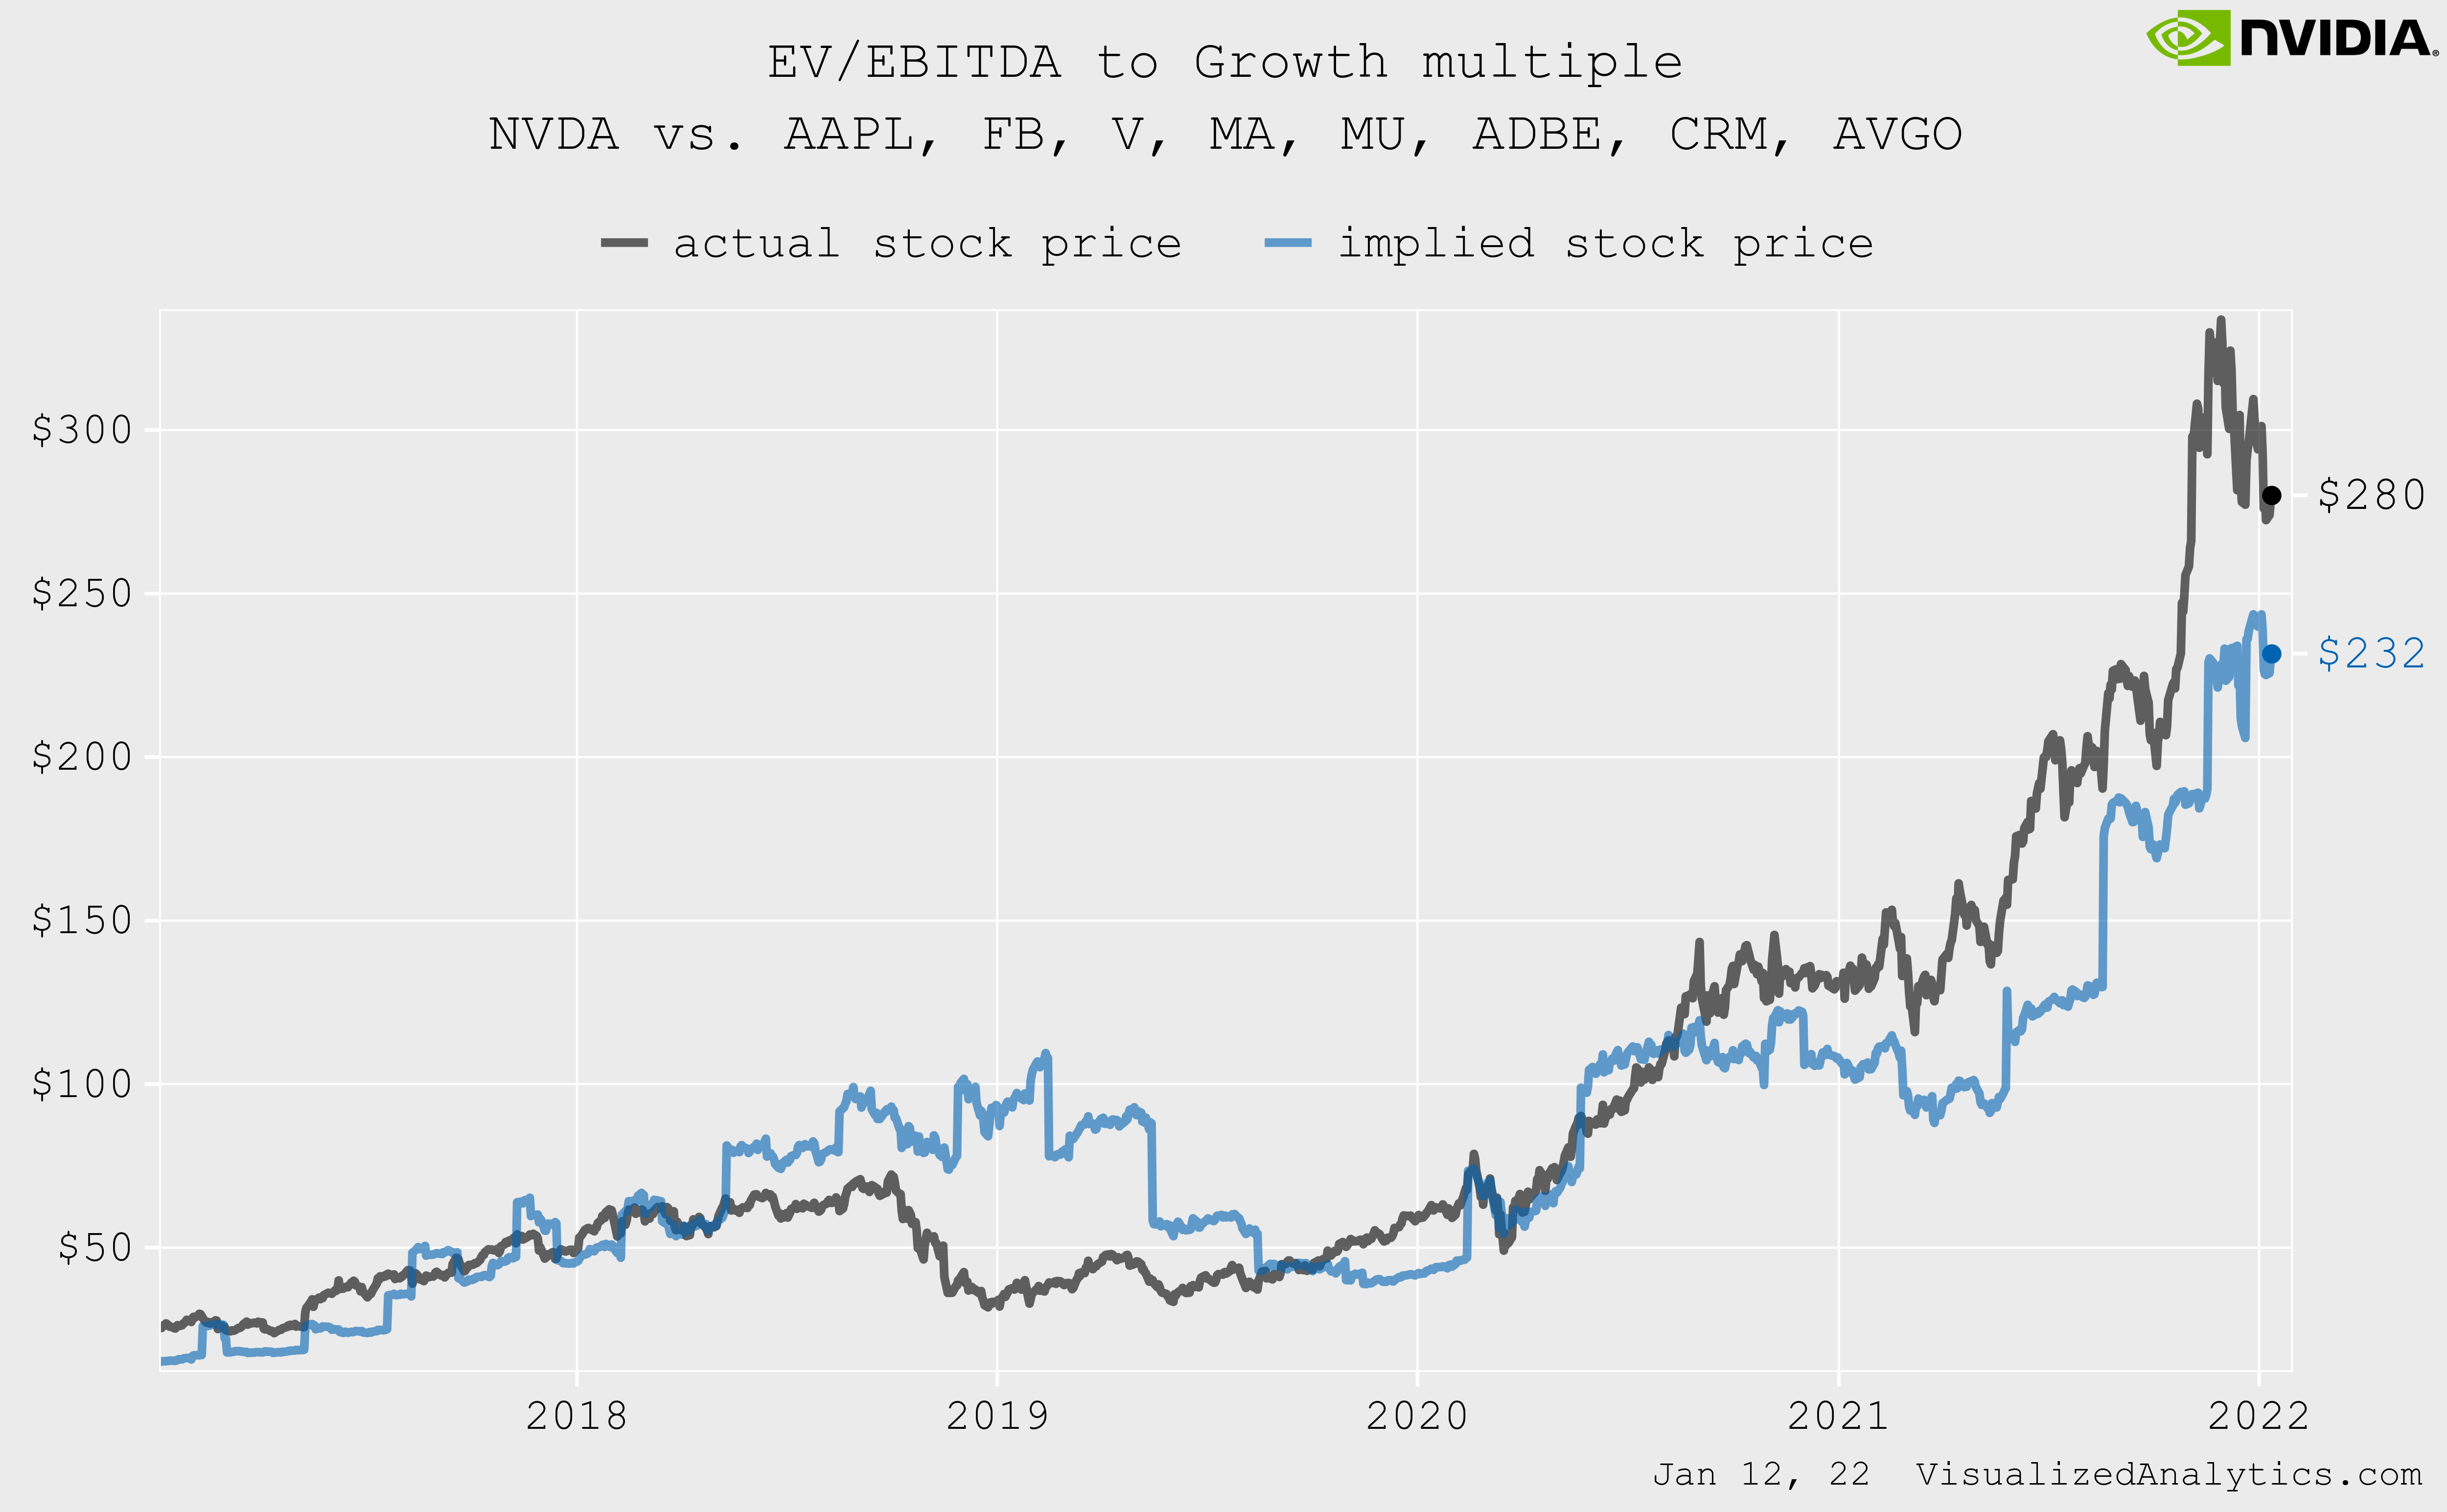
Judging by the proposed multiples, I cannot make an unambiguous conclusion. The only thing that can be stated is that the company’s growth rate is a determining factor in the level of NVIDIA multiples. The slowdown should significantly reduce the level of its multiples.
Discounted Cash Flow Model
When predicting NVIDIA’s revenue for the next ten years, I proceeded from the average expectations of analysts. According to consensus forecasts, in the next decade, the company’s annual revenue will exceed $160 billion.
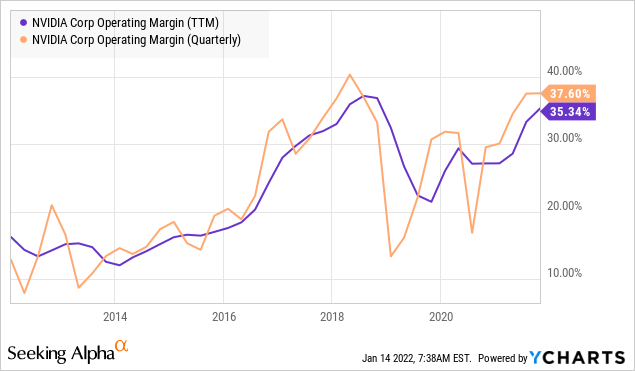
NVIDIA’s operating margin has reached 35% in the last quarter. This is close to the historical maximum of the company. But the model is based on the assumption that the operating margin over the next 10 years will gradually decline to 30% in the terminal year. This is a standard approach based on the likely increase in competition.
Here is the calculation of the Weighted Average Cost of Capital:
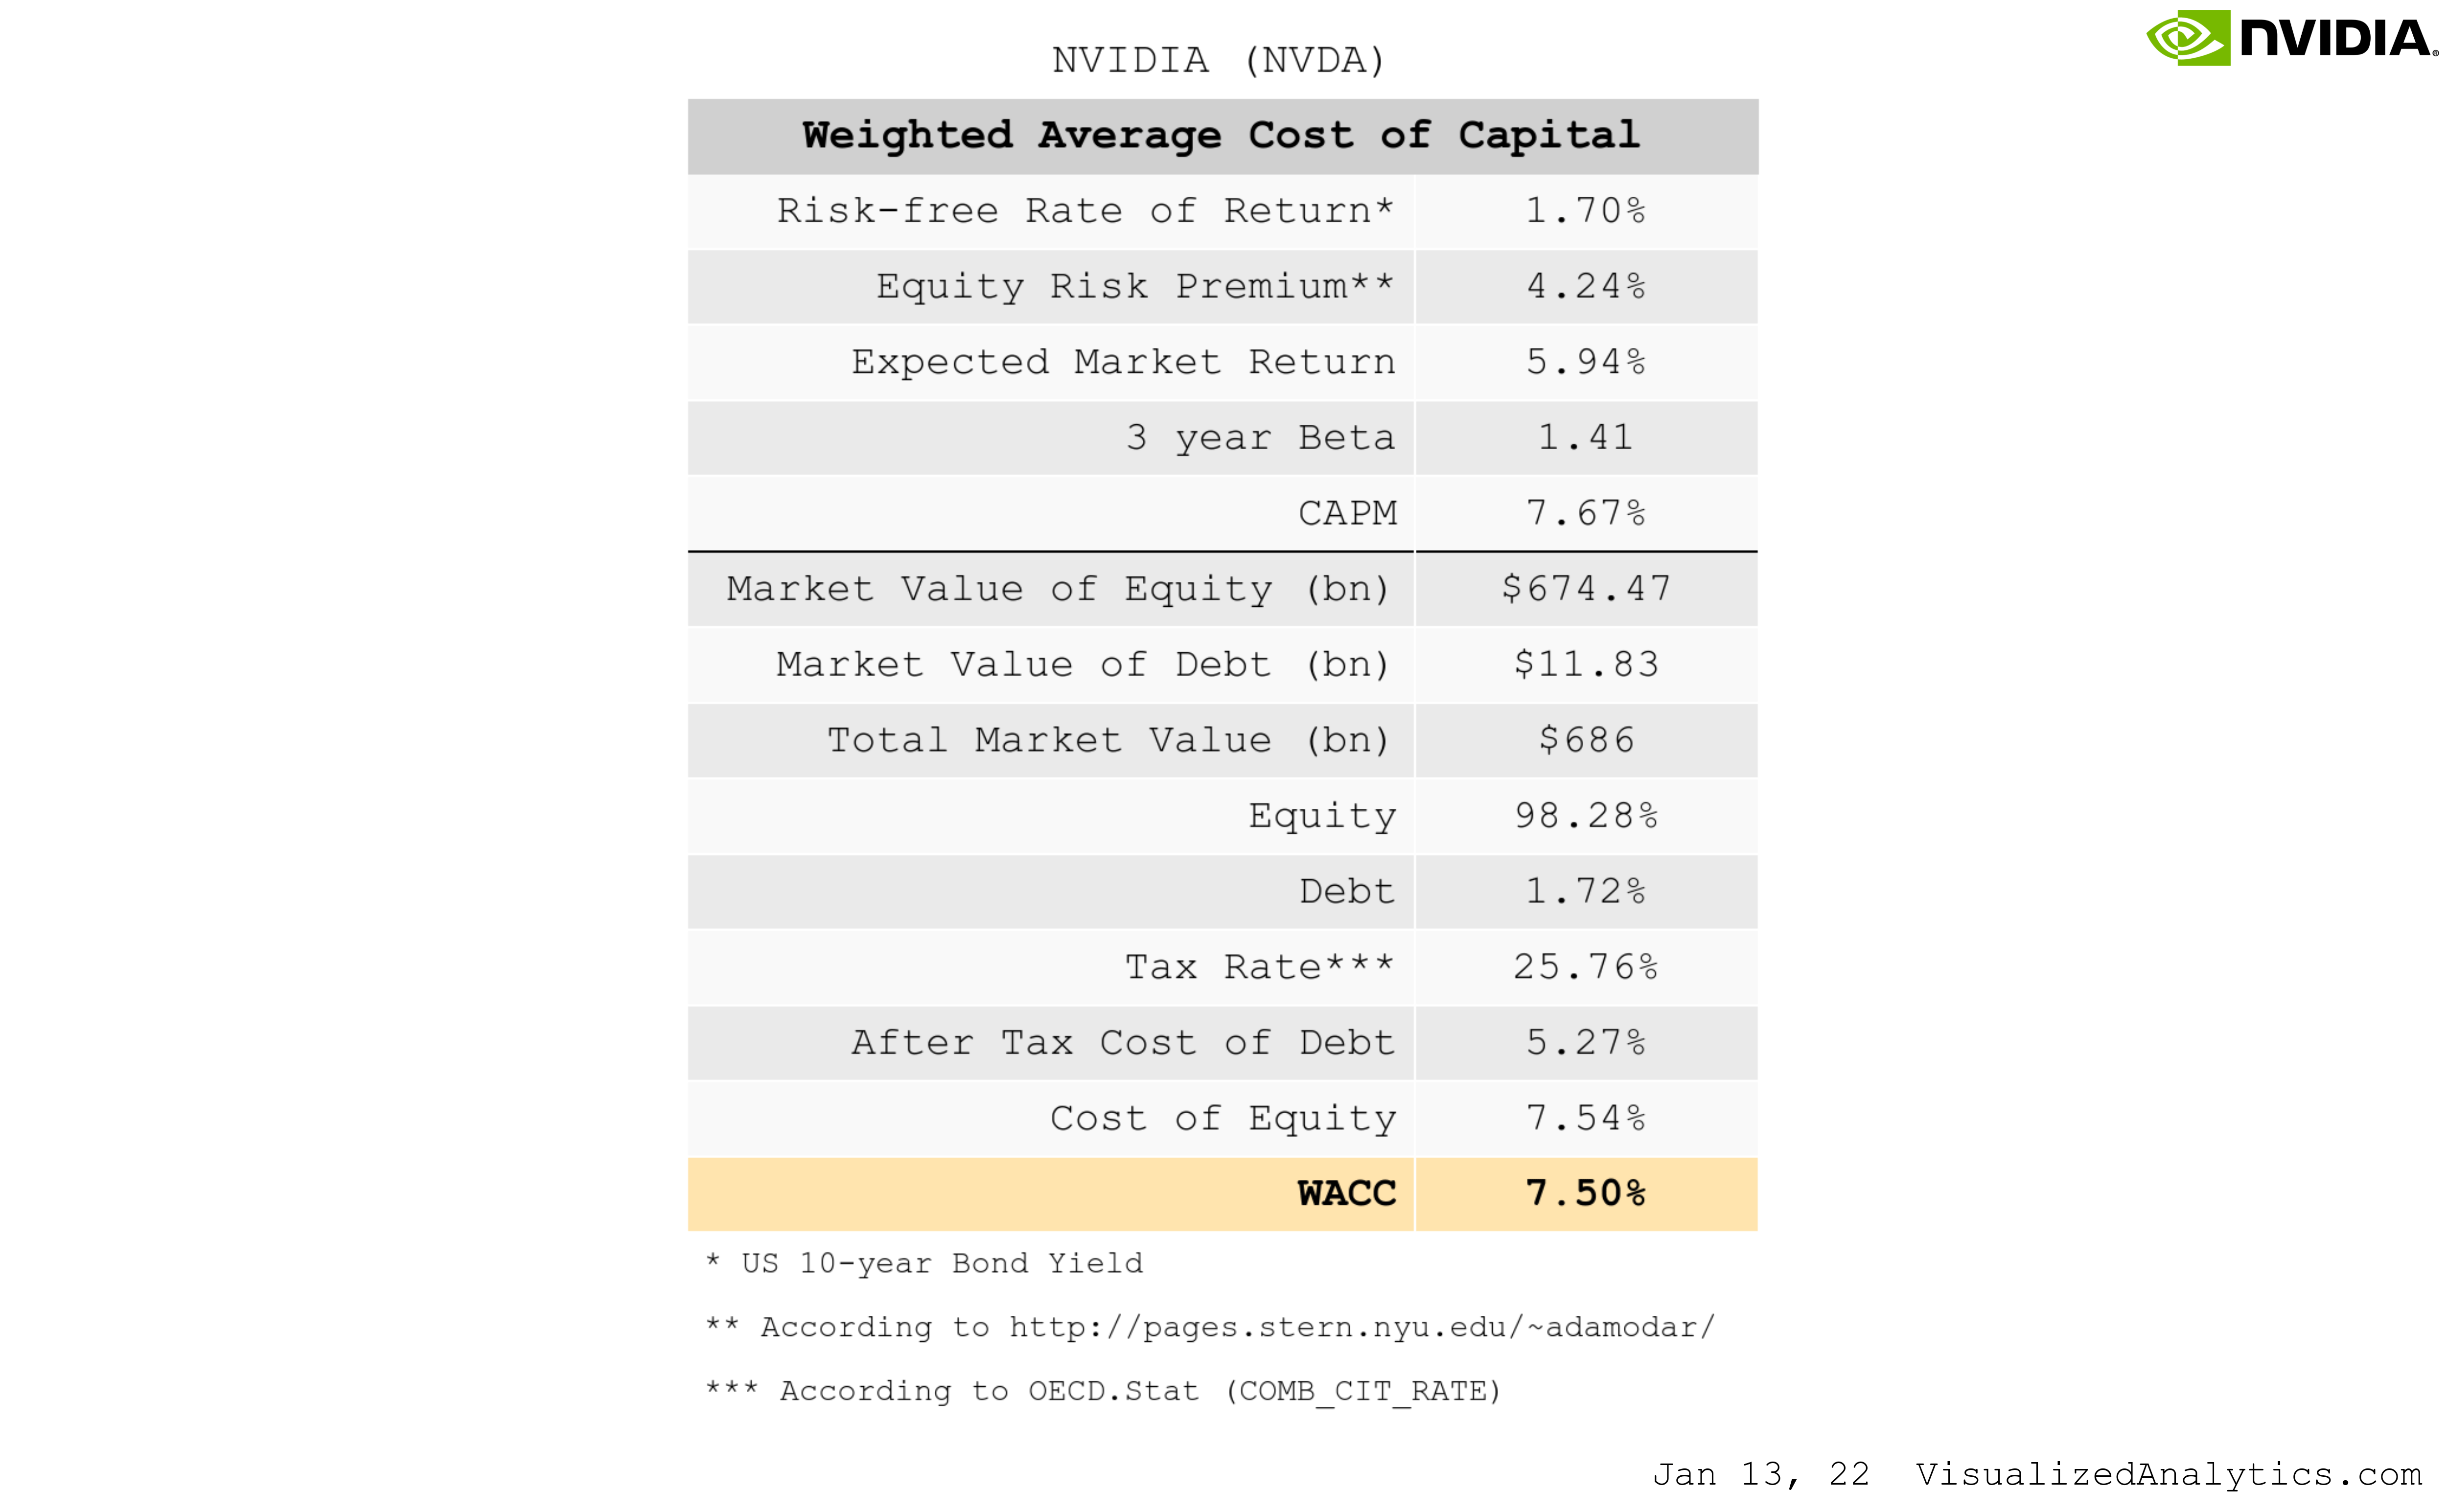
Some explanations:
- In order to calculate the market rate of return, I used values of equity risk premium (4.24%) and the current yield of UST10 as a risk-free rate (1.7%).
- I used the current value of the three-year beta coefficient. For a terminal year, I used Beta equal to 1.
- To calculate the Cost of Debt, I used the interest expense for 2021 divided by the average debt in 2019 and 2020.
Here’s the model itself:
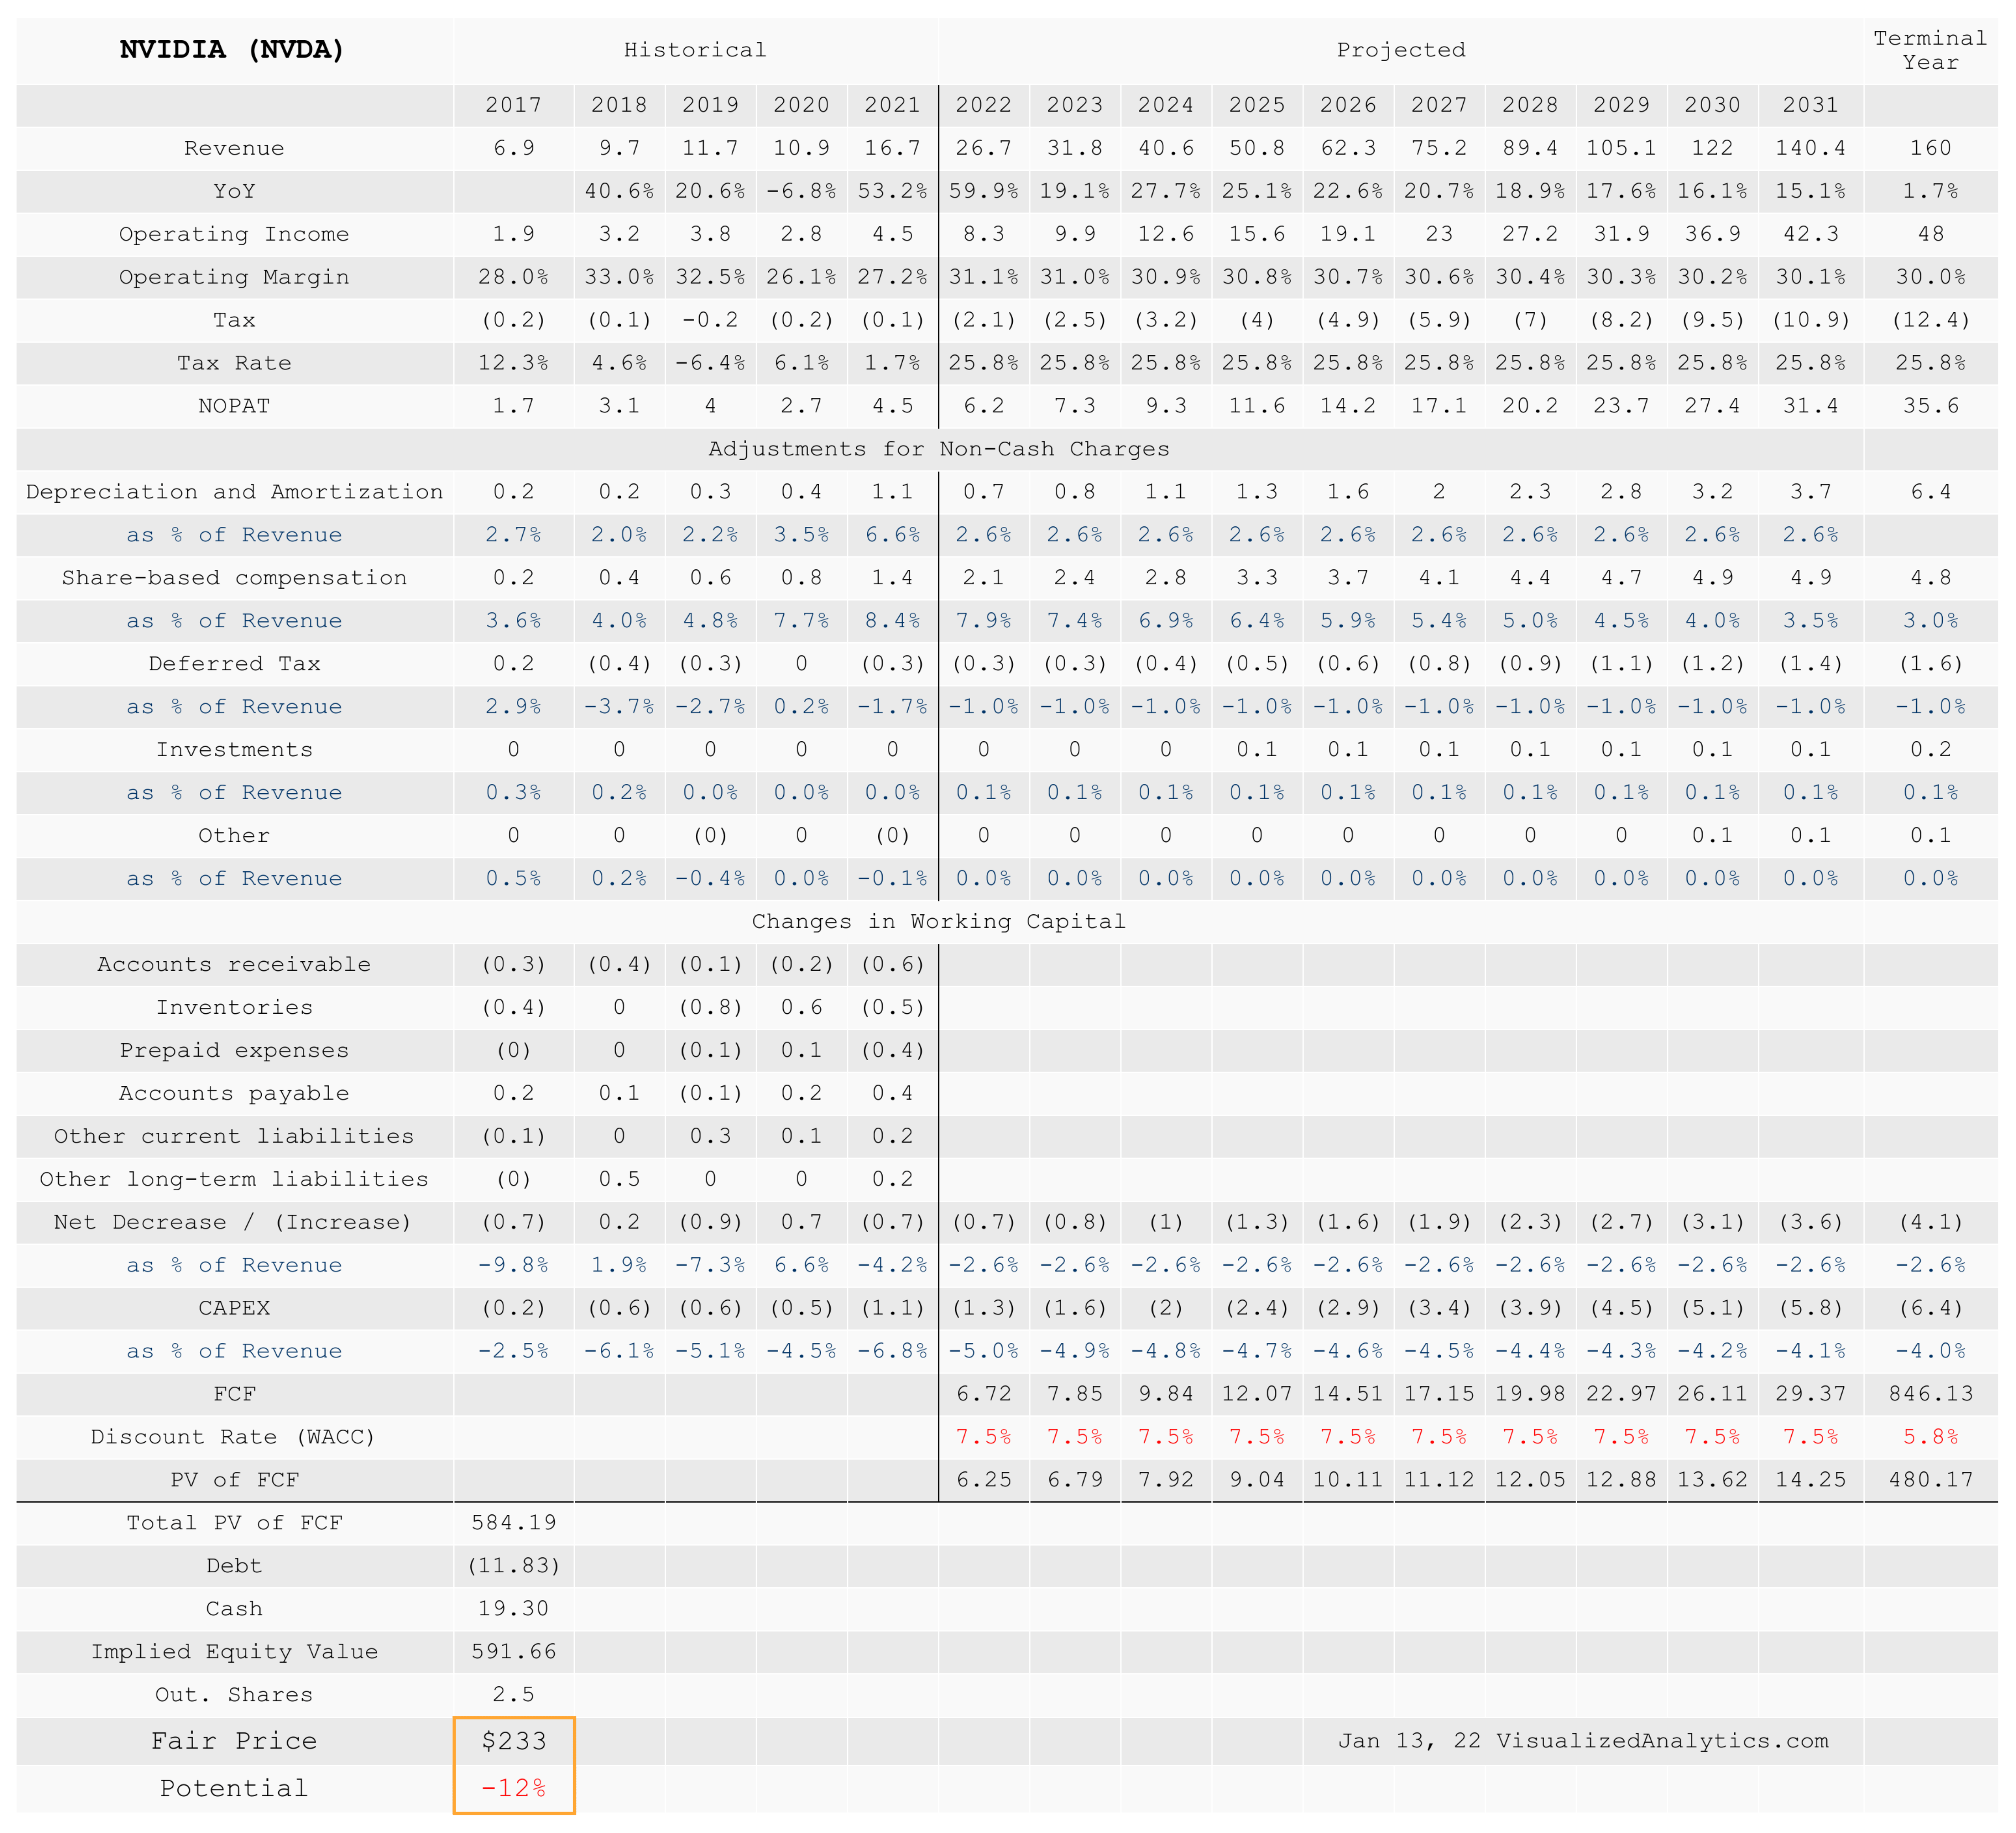
The DCF-based target price of NVIDIA’s shares is $233, offering 12% downside. At the same time, in my opinion, I considered a relatively positive scenario for the future development of the company.
Free Cash Flow Yield
Looking at NVIDIA in the context of free cash flow, I want to draw your attention to one important indicator – the free cash flow yield. It shows how much the company generates free cash flow per dollar of its market price.
Free Cash Flow Yield = Free Cash Flow TTM / Market Capitalization
I compared this figure of NVIDIA with other technology companies and closest competitors. Alas, the company’s figure is the lowest:
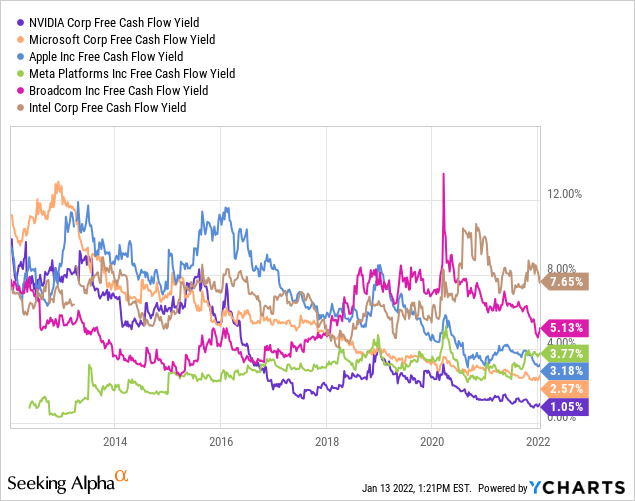
The free cash flow that NVIDIA generates for every dollar of its capitalization is about 1%. This is lower than the US 10-year treasury yield. I don’t even compare with inflation. In general, this is a wake-up call for an investor.
Technical Picture
From October to November last year, NVIDIA’s share price rose nearly 80%. During this period, two gaps were recorded. These gaps have defined strong support levels. And the first of these levels seems to have already been broken. In my opinion, before the level of the second support is reached, it is premature to talk about the completion of the correction.
TradingView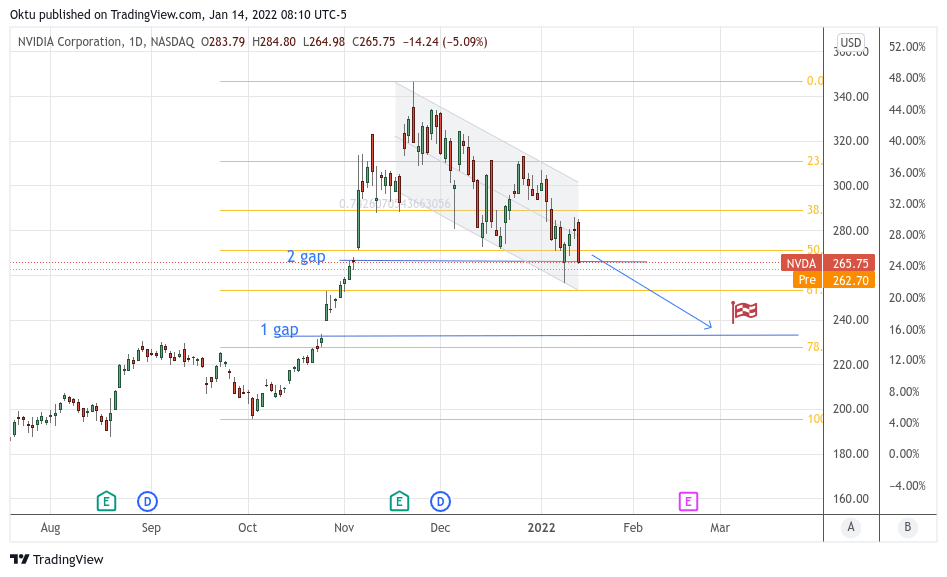
Bottom line
I do not share the optimism of those who believe that NVIDIA is an extremely attractive investment at its current price. I won’t jump to conclusions about the company’s long-term potential just yet, but it’s highly likely that the decline will continue in the short term.
Be the first to comment